unit 2 scm
1/53
There's no tags or description
Looks like no tags are added yet.
Name | Mastery | Learn | Test | Matching | Spaced | Call with Kai |
|---|
No analytics yet
Send a link to your students to track their progress
54 Terms
supply management
broad set of activities carried out by organizations
analyze sourcing opportunities
develop sourcing strategies
select suppliers
procure goods and services
measure and manage suppliers
global sourcing
competing against world class organizations
global competition requires global sourcing
considerations
where and when are goods and services needed?
what suppliers have the best mix of performance characteristics?
advances in informations systems have enabled global sourcing efforts
global sourcing applies to services and business processes, as well as manufactured goods
invoice processing, financial analysis, call centers, IT processing
performance impact
affecting the way your company performs
quality
performance, features, reliability, conformance, durability, serviceability, perceived quality
delivery
right qty, right time, right place
price
financial impact
direct influence on bottom line profits
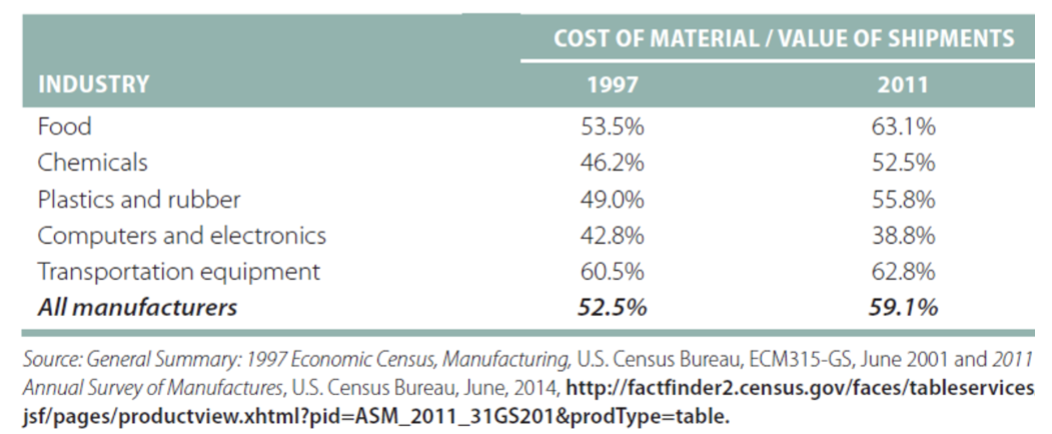
COGS
the purchased cost of goods from outside suppliers
merchandise inventory
a balance sheet item that shows the amount a company paid for the inventory it has on hand at a particular point in time
profit margin
the ratio of earnings (profit) to sales (revenue) for a given time period
profit leverage effect
decreasing the money spent on purchasing functions increases profit FASTER than increasing revenue as a result of marketing and sales
every $1 saved in purchasing, lowers COGS by $1 and directly contributes $1 to bottom line profits
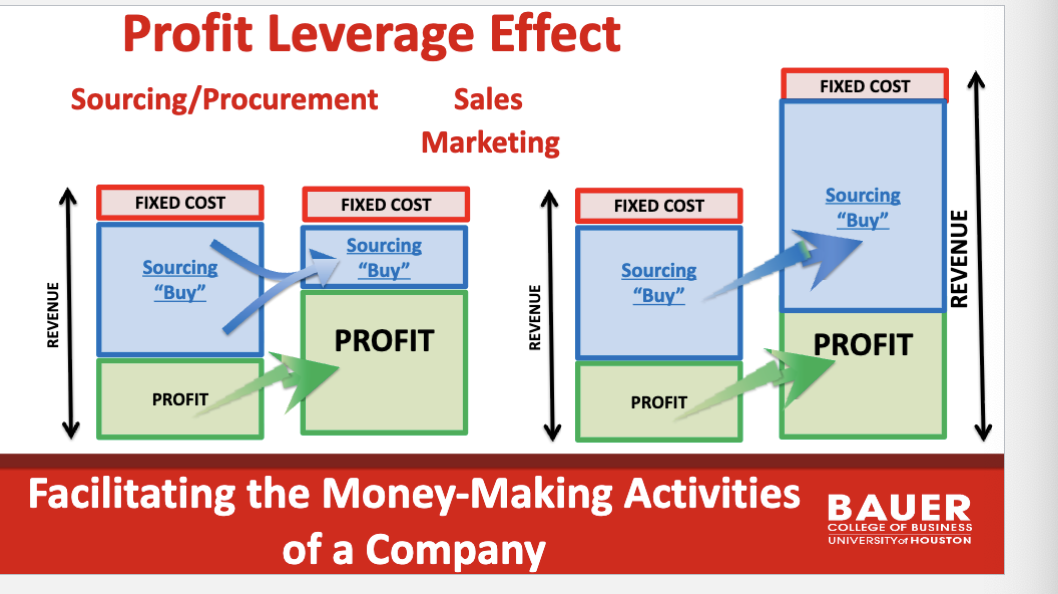
financial indicators reported as “percent of sales”
% COGS = COGS/sales revenue
pretax profit margin = pretax profit / sales revenue
same amount
when purchasing/procurement reduces COGS by a qty or percentage, the money saved increases pretax profit by ?
ex., reducing cogs by $10 increases pretax profit by $10
ex., COGS = $100. reducing cogs by 10% reduces cogs by
$100 × 0.1= $10, which increases pretax profit by $10
profit leverage effect
sales must increase by
[cogs savings]/[pretax profit margin] to have the same effect
ex., pretax profit margin = 10%, purchasing/procurement save $10
sales must increase by $10/0.1= $100 to have the same effect on profit
strategic sourcing process
identifying ways to improve long term business performance by better understanding sourcing needs, developing long term sourcing strategies, selecting suppliers, and managing the supply base
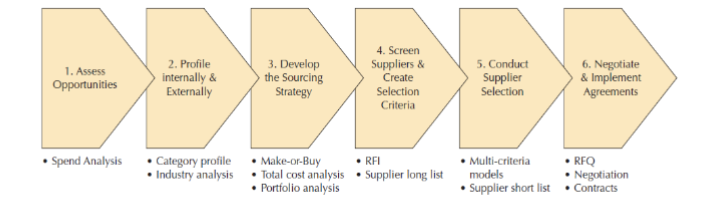
assess opportunities
step 1 of strategic sourcing process
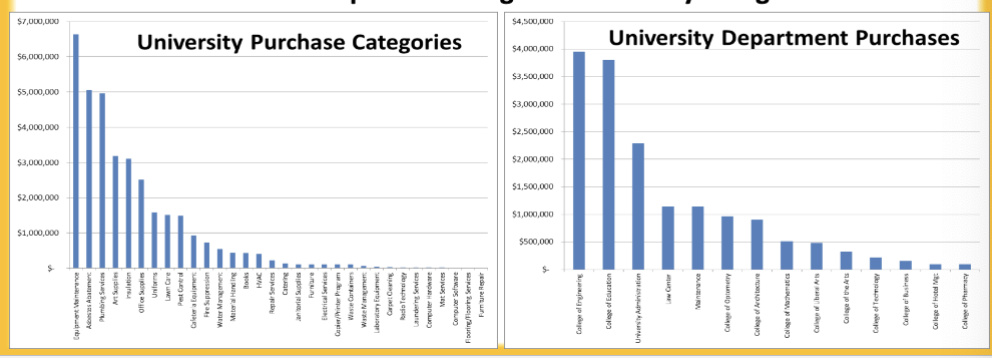
spend analysis
the application of quantitative techniques to purchasing data in an effort to better understand spending patterns and identify opportunities for improvement
purpose
determine where efforts to change purchasing practices will have the most influence
what categories of products or services make up the bulk of company spending?
how much are we spending with various suppliers? who are our suppliers? how much are we spending with each?
what are our spending patterns like across different locations? what divisions, departments, plants, business units are responsible for the most spending?
pareto chart
visualize most important categories
graphically orders categories of numerical data in descending order so that the most important categories are easily recognized
profile internally and externally
step 2 of strategic sourcing process
2 approaches to creating profiles
[internal] category profile
understanding all aspects of a particular sourcing category could ultimately have an impact on the sourcing strategy
breaking down categories of purchasing into more detail
identifying where problems are occurring internally
consolidate purchases btw depts to save money (higher volume same amt)
[external] industry analysis
profiling the major forces and trends that are impacting an industry, including pricing, competition, regulatory forces, substitution, technology changes, and supply/demand trends
maintaining visibility of global political and regulatory policy
tracking trends in commodity and supply pricing
monitoring market, customer, and competitor trends
internal category profile
understanding all aspects of a particular sourcing category could ultimately have an impact on the sourcing strategy
breaking down categories of purchasing into more detail
identifying where problems are occurring internally
external industry analysis
profiling the major forces and trends that are impacting an industry, including pricing, competition, regulatory forces, substitution, technology changes, and supply/demand trends
maintaining visibility of global political and regulatory policy
tracking trends in commodity and supply pricing
monitoring market, customer, and competitor trends
develop the sourcing strategy: make or buy
make or buy decision
high level, strategic decision regarding which products or services will be provided internally (make) and which will be provided by external supply chain partners (buy)
insourcing
the use of resources within the firm to provide products or services “do it myself” [insourcing the supply chain is “vertical integration”]
outsourcing
the use of supply chain partners to provide products or services; “pay someone to do it”
where is the physical location of the producer/provider of products or services?
off shoring:
location of an insourced or outsourced firm in a foreign country
near shoring
offshoring in an adjacent country
on shoring
location of an insourced or outsourced firm in the firm’s country
insourcing
the use of resources within the firm to provide products or services “do it myself” [insourcing the supply chain is “vertical integration”]
outsourcing
the use of supply chain partners to provide products or services; “pay someone to do it”
nearshoring
offshoring in an adjacent country
on shoring
location of an insourced or outsourced firm in the firm’s country
reasons to make or insource
better control over quality
better visibility of process
better control over social and environmental impact
to protect intellectual property
for core competencies
to utilize excess capacity
to reduce handling/storage costs
when product life cycles are stable
reasons to buy or outsource
if low volumes increase costs
to maintain strategic flexibility
to gain access to state of the art technology and processes
cost and/or quality advantage
when suppliers are reliable
when relationships have been established
when product life cycles are short
total cost analysis
a process by which a firm seeks to identify and quantify all of the major costs associated with various sourcing options
direct costs
costs tied directly to the level of operations or supply chain activities
“if you make/do more, the unit cost increases directly” incurred.
ex., part time labor, direct material costs, direct energy costs
multiply “direct costs” by the “number of units needed” to calculate “total costs”
incremental direct costs
costs that are incurred only after a certain number of products are produced
“each time you produce x, a cost of $y is incurred”
ex., direct labor, transport cost, direct maintenance cost, setup cost
divide “number of units needed” by the threshold “x” and multiply by the incremental cost $y to calculate “total costs”
one time costs
costs that are incurred only when a product or service is first produced
ex., product design, fixture purchase, mold/die purchase
one time costs are added directly to “total costs”
indirect costs
costs that are not tied directly to the level of operations or supply chain activities
“if you make/do more, the unit cost does not change”
ex., administrative costs, overhead, depreciation, basic utilities
difficult to calculate accurately. for this class, indirect costs wil be given as an allocated direct cost ($/unit)
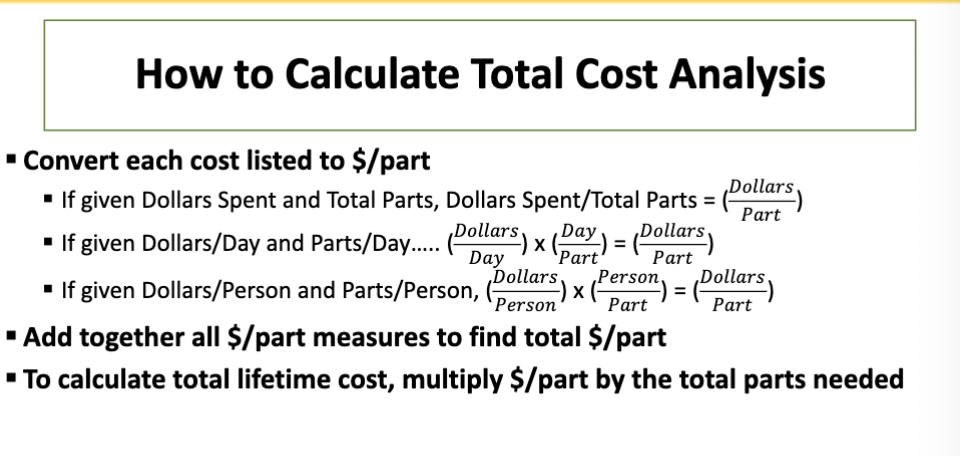
calculate total cost analysis
convert each cost listed to $/part
if given dollars spent and total parts, dollars spent/total parts
(dollars/part)
if given dollars/day and parts/day
dollars/day x day/part = dollars/part
if given dollars/person and parts/person
dollars/person x person/part = dollars/part
add together all $/part measures to find total $/part
to calculate total lifetime cost, multiply $/part by the total parts needed
portfolio analysis
step 3 of sourcing strategy
kralijic’s portfolio analysis
a structured approach used by decision makers to develop a sourcing strategy for a product or service, based on the value potential and the relative complexity or risk represented by a sourcing opportunity
the routine quadrant
readily available products or services representing a relatively small portion of a firm’s purchasing expenditures of low cost/value
the leverage quadrant
standardized and readily available products or services representing a significant portion of spend
the bottleneck quadrant
products or services with unique or complex requirements that can be met only by a few potential suppliers representing low cost/value
the critical quadrant
products or service with unique or complex requirements coupled with a limited supply base that are high cost/value

routine quadrant
readily available products or services representing a relatively small portion of a firm’s purchasing expenditures of low cost/value

leverage quadrant
standardized and readily available products or services representing a significant portion of spend
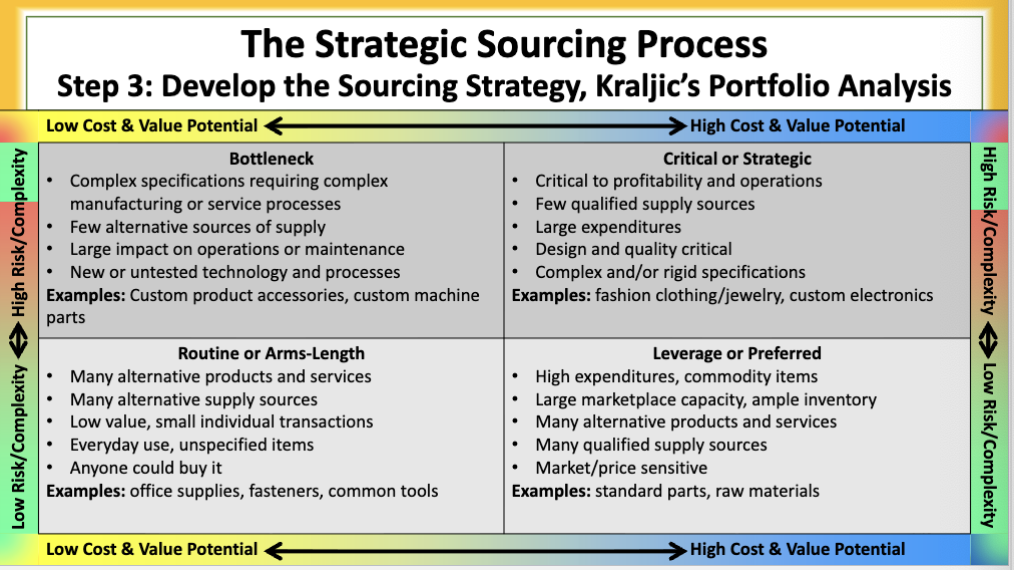
bottleneck quadrant
products or services with unique or complex requirements that can be met only by a few potential suppliers representing low cost/value

critical quadrant
products or service with unique or complex requirements coupled with a limited supply base that are high cost/value

bottleneck sourcing strategy
complex specifications requiring complex manufacturing or service processes
few alternative sources of supply
large impact on operations or maintenance
new or untested technology and processes
ex., custom product accessories, custom machine parts

critical or strategic sourcing strategy
critical to profitability and operations
few qualified supply sources
large expenditures
design and quality critical
complex and/or rigid specifications
ex., fashion clothing/jewelry, custom electronics

routine or arms length sourcing strategy
many alternative products and services
many alternative supply sources
low value, small individual transactions
everyday use, unspecified
anyone could buy it
ex., office suppliers, fasteners, common tools
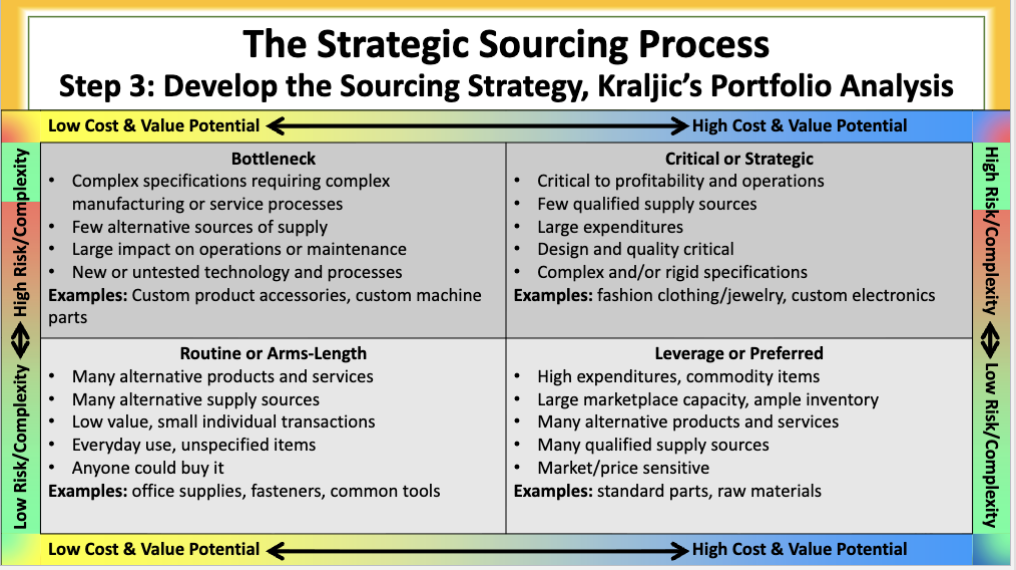
leverage or preferred
high expenditures, commodity items
large marketplace capacity, ample inventory
many alternative products and services
many qualified supply sources
market/price sensitive
ex., standard parts, raw material

bottleneck
ensure supply continuity by decreasing the uniqueness of the suppliers and managing the supply
widen the specifications where possible
increase competition by developing new suppliers
set medium term contracts
utilize competitive bidding

critical or strategic
form partnerships and communication with selected suppliers
persistent negotiation tactics
monitor and manage supplier processes
create contingency plans
analyze marketplace and competition trends

routine or arms length
simplify the acquisition process by increasing the role of systems and reducing the effort to purchase
supplier rationalization- minimze suppliers used
automate the purchase process - electronic data
vendor managed inventory
minimal negotiation
critical or strategic
form partnership and communication with selected suppliers
persistent negotiation tactics
monitor and manage supplier processes
create contingency plans
analyze marketplace and competition trends

leverage or preferred
maximize commercial advantage by maintaining pressure on suppliers to improve
relationships with several preferred suppliers
long term contracts with conditions for improvement
expectation of lower costs over time
coordination of procurement with market cycles

single sourcing
the buying firm depends on a single company for all or nearly all of a particular item or service
advantages: volume discounts, reduction in variability, enables strong relationships
disadvantages: increased supply risk, supplier dependence, must monitor best practices
multiple sourcing
the buying firm shares its business across multiple suppliers
advantages: creates competition, shares risk, promotes improvements
disadvantages: decreases dedication of suppliers, increases variability
cross sourcing
the buying firm uses a single supplier for one particular part or service and another supplier with the same capabilities for a different part or service
balances risk while allowing for strong relationships with suppliers
dual sourcing
multiple sourcing across only two suppliers
enables stronger relationships while reducing risk
maverick spending
employees buy goods or services without following the organization's established purchasing rules, often leading to higher costs, compliance risks, and reduced spending control
basically go to staples with company cc and buy paper