USE PHYSICAL CARDS ib economics chapter 2
0.0(0)
0.0(0)
Card Sorting
1/22
Earn XP
Study Analytics
Name | Mastery | Learn | Test | Matching | Spaced |
|---|
No study sessions yet.
23 Terms
1
New cards
Market: Where the exchange of goods and services take place
• Involves interactions between buyers and sellers
• Does not have a fixed location
• Involves interactions between buyers and sellers
• Does not have a fixed location
Market
2
New cards
Market ⇨ Story surrounding consumer ⇨ Theory of Demand
Market ⇨ Story surrounding producers ⇨ Theory of Supply
Market ⇨ Story surrounding producers ⇨ Theory of Supply
Market Structure
3
New cards
The quantities of the good and service that consumers are willing and able to buy
at various prices of a period of time
at various prices of a period of time
Demand
4
New cards
The quantities of a good or service that consumers are willing and able to buy
at a single price over a period of time
at a single price over a period of time
Quantity Demand
5
New cards
Theory of Demand: A law stating there is a negative relationship between the price of a good and quantity of the good demanded over a particular period of time
Inverse Relationship:
- when price decreases, quantity increase + when price increase, quantity decreases, ceteris paribus
Inverse Relationship:
- when price decreases, quantity increase + when price increase, quantity decreases, ceteris paribus
Theory of Demand
6
New cards
the summation of all the individual demand curves based on overall market demand. (is a display of how quantity demand relates in variation in prices) *draw a negative linear function
Market Demand Curve
7
New cards
o Expansion: quantity demand increases (fall in price)
o Contraction: quantity demand decreases (rise in price)
o Shifts Right: demand increases
o Shifts Left: demand decreases
o Contraction: quantity demand decreases (rise in price)
o Shifts Right: demand increases
o Shifts Left: demand decreases
Shifts in Demand Curve
8
New cards
1) Normal and inferior goods (e.g. normal good= luxury bad, inferior good= normal bag)
o Normal good= increase in demand + increase income vice versa
o Inferior good= increase in income + decrease in demand
2) Financial ability to pay for the product
3) Consumers’ attitudes to the product (behaviour and influences)
4) Price, availability and attractiveness of related products goods
o Substitute goods: Alternative
o Complementary goods: enhance satisfaction (e.g. cars and petrol)
5) Demographic changes
6) Expectations of the future (e.g. if you think rice is going to increase you buy it before)
7) Composite demand (increase in demand for cows means increase demand for beef and leather)
Causes of Shifts in Demand Curve
9
New cards
The quantities of a product that suppliers are willing and able to sell at various prices per period of time
Supply
10
New cards
The quantities of a product that suppliers are willing and able to sell at a single price per period of time
Quantity Supply
11
New cards
A law stating there is a positive relationship between the price of a good and quantity of the good demanded over a particular period of time
Inverse Relationship:
o when price decreases, quantity decreases + when price increase, quantity increases, ceteris paribus
Inverse Relationship:
o when price decreases, quantity decreases + when price increase, quantity increases, ceteris paribus
Theory of Supply
12
New cards
o Extension: increase in quantity supplied
o Contraction: decrease in quantity supplied
o Shifts Right: increase in supply
o Shifts Left: decrease in supply
o Contraction: decrease in quantity supplied
o Shifts Right: increase in supply
o Shifts Left: decrease in supply
Shifts in Supply Curve
13
New cards
1) Cost: increase in cost shifts supply leftward
o Cost of production (wage, worker productivity, raw materials, energy costs)
2) Technology: increase in advanced technology shifts supply right
3) Competitive & Joint supply: when a firm can produce alternative foods and services which fight for the use of the same factors of production
o e.g. turning alcohol production into hand sanitiser production
o Therefore if hand sanitiser sells for more it increase profits, supply shifts right
4) Producers’ expectations: if firms expect the price of products to rise, they will reduce current supply as they can make more profits at a higher price in the future
5) Taxes & Subsidies: increase costs of production therefore less tax means more supply
6) The Size and Nature of the Industry: Firms invest in capital equipment to grow bigger and capitalise on profit making opportunities
o Increase in firms= increase in supply
7) Other Supply Influencing Factors
o E.g. weather/natural disasters of agricultural produce
Causes in Supply Curve Shift
14
New cards
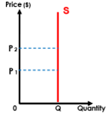
Regardless of price, quantity will be fixed
Example: antiques, quantity of seating in synonym
Example: antiques, quantity of seating in synonym
Vertical Supply Curve
15
New cards
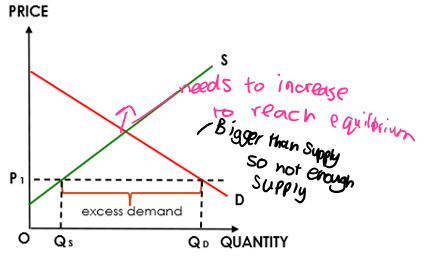
Demand & Supply Curve: A representation of the amount of a commodity, product or service available
o Excess Demand= demand>supply
To reach equilibrium again=
increase price
o Excess Demand= demand>supply
To reach equilibrium again=
increase price
Demand & Supply Curve
16
New cards
A situation of balance, under current circumstance, where there is no tendency to change. DEMAND=SUPPLY as plans of consumers meets plans of suppliers
Equilibrium in the Market
17
New cards
A situation of imbalance, where change will happen
(e.g. excess supply leads to: supply > demand)
o When prices change, quantity supply changes. Producers will either enter or leave the market (demand and supply diagram) until equilibrium reached
(e.g. excess supply leads to: supply > demand)
o When prices change, quantity supply changes. Producers will either enter or leave the market (demand and supply diagram) until equilibrium reached
Disequilibrium in the Market
18
New cards
Due to disturbances to present market conditions, lines will shift and create a new equilibrium *know how to find this*
Changes in Equilibrium
19
New cards
The system where prices are determined by demand and supply in competitive markets, resulting from the free interaction of buyers and sellers. These interactions determine the allocation of resources
Price Mechanism
20
New cards
1) Signalling Function: price signal where resources are needed and where they are not
- Rise and fall of prices reflect scarcity and surpluses
2) Transmission of Preferences: through their choices consumers send information to producers about the changing nature of needs and wants
- Higher prices act as an incentive to raise output because the supplier stands to make a better profit
3) Rationing Function: prices serve to ration scarce resources when demand in a market exceeds supply
- When there is a shortage, the price is pushed up, leaving only those with the willingness and ability to pay to purchase the products
Functions of a Price Mechanism
21
New cards
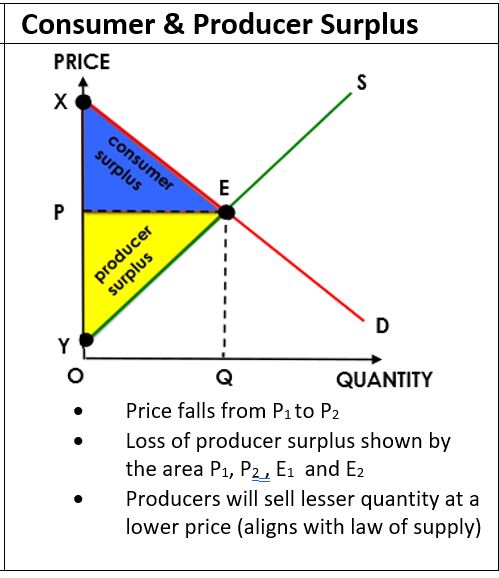
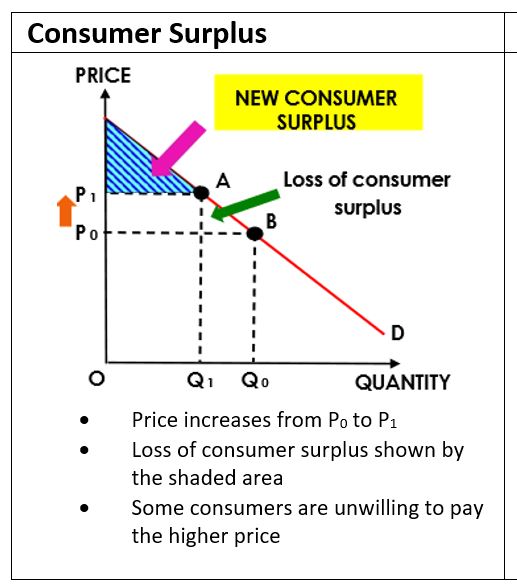
Consumer Surplus: the price that consumers are willing and able to pay on a good or service vs what they actually pay
↑consumer surplus= ↓market price (vice versa)
↑consumer surplus= ↓market price (vice versa)
Consumer Surplus
22
New cards
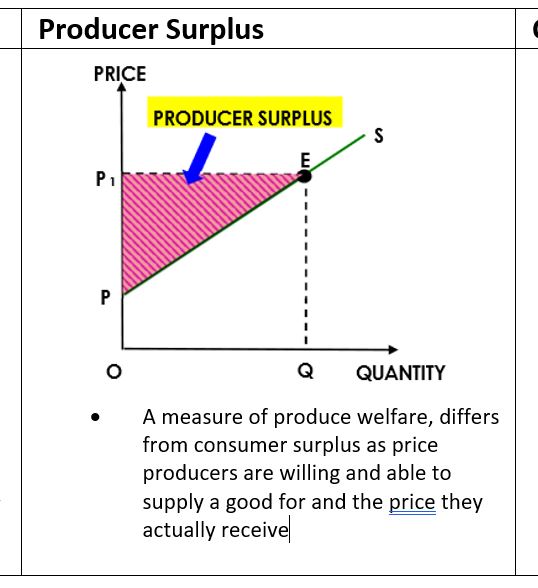
Producer Surplus: the difference between the price producers are willing and able to supply a good or service for and the price they actually receive ↑producer surplus= ↑market price (vice versa)
Producer Surplus
23
New cards
Consumer & Producer Surplus: a surplus which arises because some consumers are willing to pay more than the given price for all but the last unit they buy
Consumer & Producer Surplus