3.7 - conflicting objectives, equity, inequality, wealth, income, Lorenz and Gini, poverty
1/28
There's no tags or description
Looks like no tags are added yet.
Name | Mastery | Learn | Test | Matching | Spaced |
|---|
No study sessions yet.
29 Terms
conflicting macroeconomic objectives
low unemployment and low inflation
high economic growth and low inflation
high economic growth and environmental sustainability
high economic growth and equity in income distribution
equity
recognizes each person’s/ group’s circumstances and allocates the exact resources/ opportunities needed for equal outcome
equality
each individual/group is given some resources/opportunities
wealth
total value of net assets
income
return on all factors of production owned by households (rent, wages, interest,profit)
types of inequality
economic
income
wealth
economic inequality
difference in population’s ability to satisfy their economic needs
sources of economic inequality
income and wealth
education
health and nutrition
gender
social status
income inequality
arises from differences in how evenly income is distributed among individuals or groups within a society.
wealth inequality
arises from differences in amount of net assets people own
how is economic inequality measured
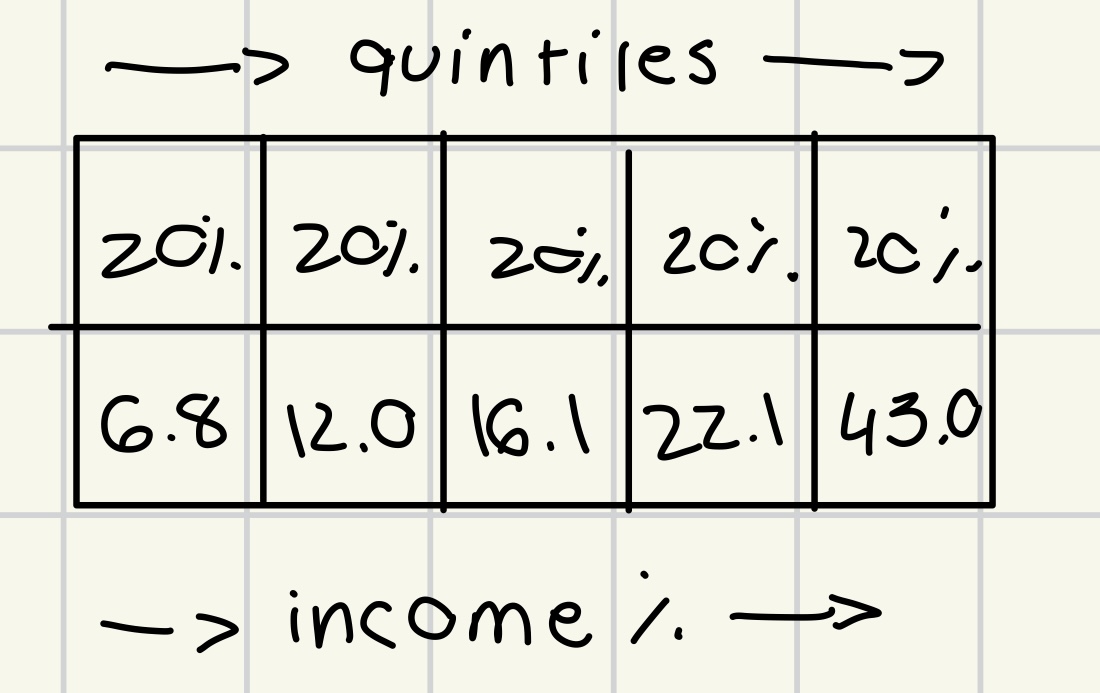
quintiles
deciles
quintiles and deciles explained
quintile = 20% of population
population divided into 5 quintiles
deciles = 10% of population
population divided into 10 deciles
*if equal distribution = each quintile gets 20% of income, decile gets 10% of income
**in real world
quintile 1 < 20% income
quintile 5 > 20 % of income
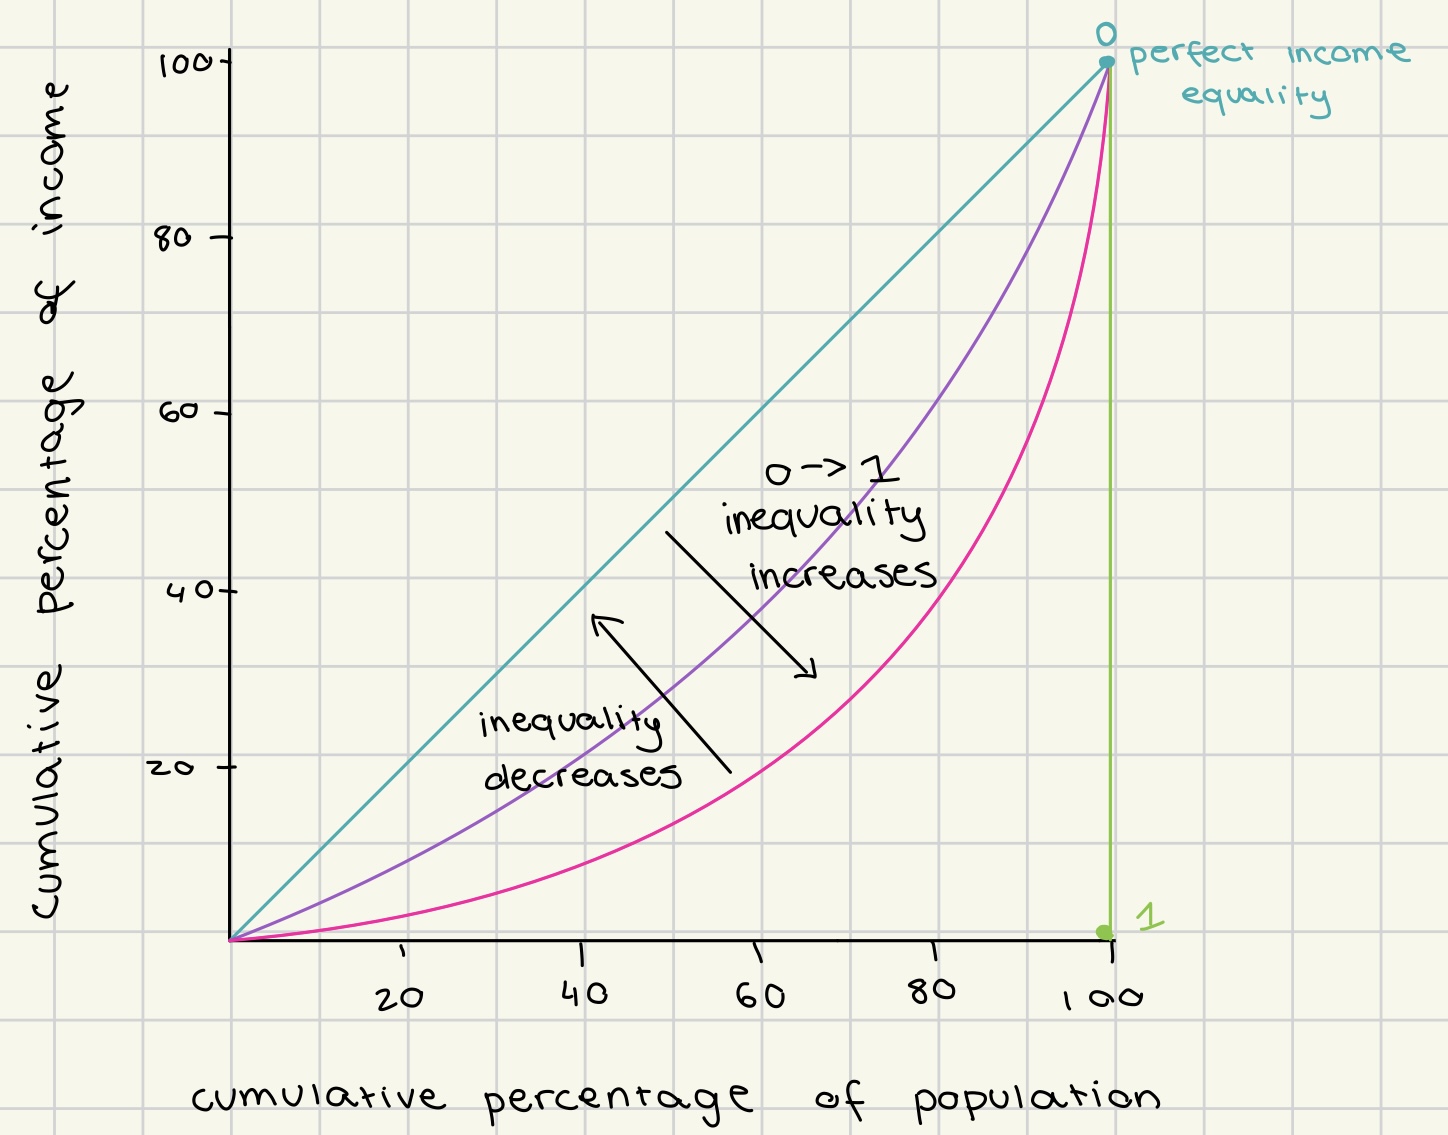
Lorenz curve
used to show degree of income/ wealth inequality in a economy
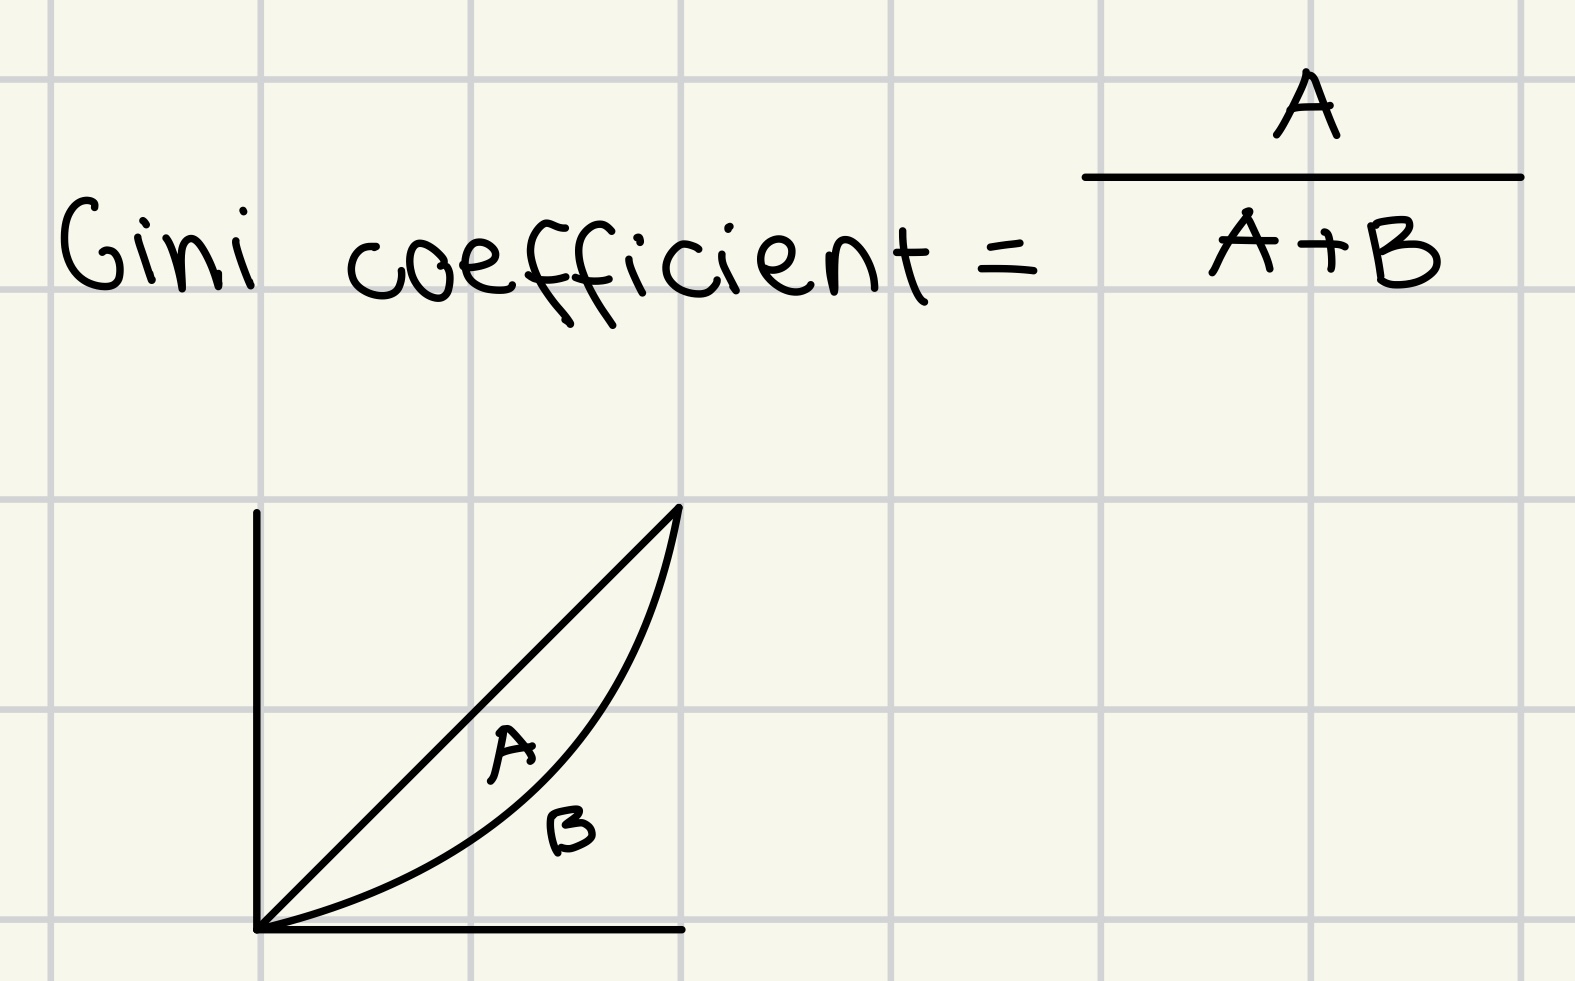
Gini coefficient/ index
summary measure of information about income distribution.
coefficient of 0 represents perfect equality
coefficient of 1 signifies maximum inequality.
*has to be expressed in percentages
Gini index = a/a+b
reasons behind greater wealth inequality
limited wage growth
difficult for low/middle class to save and accumulate wealth
variations in consumption patterns
high-income tend to consume lower fraction of their income therefore have greater chance of saving and accumulating wealth
income and wealth inequalities feed on each other
poverty
inability to satisfy minimum consumption needs
absolute poverty
when an individual/ household lacks sufficient income to meet basic human needs
food
housing
clothing
healthcare.
poverty line
minimum level of income deemed sufficient, below which individuals/ families are considered to be in poverty.
relative poverty
individuals/ households are unable to maintain an average standard of living compared to others in society.
measured as 50% of income’s median in society (below is considered poor)
eg. $20000 is median, 50% → $10000, anyone below is poor
extreme poverty
where individuals live on less than $1.90 a day, lacking basic resources for survival.
$3.20 a day in lower-middle income countries
$5.50 a day in upper-middle income countries
groups with increased poverty rates than national averages
older people
women
single-parent households
children
racial and ethnic groups
measurements of poverty
poverty line
minimum income standards (MIS)
multidimensional poverty index (MPI)
minimum income standards (MIS)
produces budgets for a basket of goods required by households in order to achieve minimum standard of living
informs about:
nr. of people living below the minimum income required for essentials
relative contribution of each item in the basket to household’s abilities to achieve MIS
changes over time
composite indicators
try to capture more than 1 dimension of the issue in question
MPI
multidimensional poverty index (MPI)
measures poverty in 3 dimensions and 10 indicators → each is intended to reflect deprivations
health
child mortality
nutrition
education
years of schooling
school attendance
living standards
cooking fuel
sanitation
drinking water
electricity
housing
assets
MPI (0→ 1)↑ = poverty↑
poor = deprived in at least 1/3 of the indicators
advantages of multidimensional poverty index
can be broken up by indicators → provides better insights
possible to determine which indicator contributes most and compare to other countries
difficulties in measuring poverty
poverty has different meaning meanings
different approaches to measurement
wealth and savings are not accounted for
subjective household surveys
doesn’t say by how much people wall below the poverty line
over/underestimates of poverty line by government
over → to get more financial aid/assistance
under → to spend less money on solving poverty
opportunity
set of circumstances that make it possible for individuals to do something
causes of economic inequality and poverty
inequality of opportunity
discrimination
unequal status and power
tax and benefits policies
technology changes
supply-side policies
unemployment
low living standards
social and political instability
impacts of income and wealth inequality
low living standards
reduced access to education and healthcare
increased crime rates
diminished trust in institutions.