Looks like no one added any tags here yet for you.
c
1. A city planner is comparing traffic patterns at two different intersections. He randomly selects 12 times between 6 am and 10 pm, and he and his assistant count the number of cars passing through each intersection during the 10-minute interval that begins at that time. He plans to test the hypothesis that the mean difference in the number of cars passing through the two intersections during each of those 12 times intervals is 0. Which of the following is appropriate test of the city planner's hypothesis?
(a) Two-proportion z-test
(b) Two-sample z-test
(c) Matched pairs t-test
(d) Two proportion t-test
(e) Two sample t-test
d
Janice and her cousin Linda are a little competitive about the relative merits of their home towns. One contest they had was to determine who had more rainy days. They found weather records on the internet and each of them randomly selected 60 days from the past 5 years. Janice found that there had been measurable rainfall on 17 of the 60 days she selected for Asheville, and Linda found that there had been measurable rainfall on 12 of the 60 days she selected for Lincoln.
They intend to perform a test of significance on their data, using the hypotheses
H0: PA - PL = 0; Ha: PA - PL ≠ 0 and the 0.05 significance level.
6. When calculating the test statistic, what expression would they use to estimate the standard deviation of the sampling distribution of the difference in proportions, P(hat)A - P(hat)L?
(a) √12²/60+17²/60
(b) √12/√60+17/√60
(c) √(0.28)(0.72)/60+(0.2)(0.8)/60
(d) √(0.24)(0.76)/60+(0.24)(0.76)/60
(e) √(0.28)(0.72)/60+√(0.2)(0.8)/60
e
Janice and her cousin Linda are a little competitive about the relative merits of their home towns. One contest they had was to determine who had more rainy days. They found weather records on the internet and each of them randomly selected 60 days from the past 5 years. Janice found that there had been measurable rainfall on 17 of the 60 days she selected for Asheville, and Linda found that there had been measurable rainfall on 12 of the 60 days she selected for Lincoln.
They intend to perform a test of significance on their data, using the hypotheses
H0: PA - PL = 0; Ha: PA - PL ≠ 0 and the 0.05 significance level.
7. Janice and Linda's test statistic is 1.07. Which of the following is closest to the appropriate P-value for the test?
(a) 0.0446
(b) 0.0892
(c) 0.1423
(d) 0.1449
(e) 0.2846
a
Janice and her cousin Linda are a little competitive about the relative merits of their home towns. One contest they had was to determine who had more rainy days. They found weather records on the internet and each of them randomly selected 60 days from the past 5 years. Janice found that there had been measurable rainfall on 17 of the 60 days she selected for Asheville, and Linda found that there had been measurable rainfall on 12 of the 60 days she selected for Lincoln.
They intend to perform a test of significance on their data, using the hypotheses
H0: PA - PL = 0; Ha: PA - PL ≠ 0 and the 0.05 significance level.
8. Which of the following best describes what it would mean if Janice and Linda's test resulted in a Type I error?
(a) Concluding that there is a difference in the proportion of rainy days in the two cities when
there is no difference.
(b) Concluding that there is no difference in the proportion of rainy days in the two cities when there is a difference.
(c) Choosing the wrong test procedure, such as using a z-test instead of a t-test.
(d) Accepting the alternative hypothesis instead of rejecting the null hypothesis.
(e) Accepting the null hypothesis instead of
rejecting the alternative hypothesis.
c
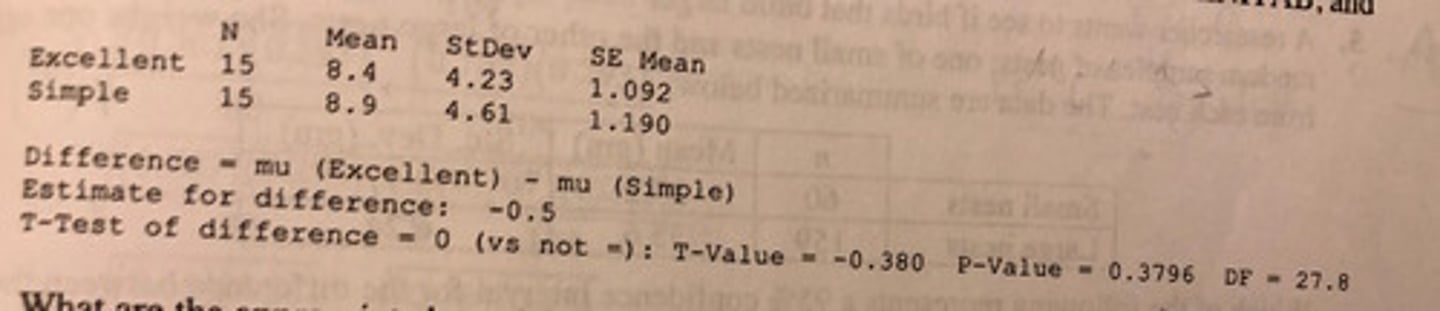
The Excellent Drug Company claims its aspirin tablets will relieve headaches faster than any other aspirin on the market. To determine whether Excellent's claim is valid, 30 volunteers who are suffering from headaches are randomly assigned to two groups. The subjects in one group are given Excellent's aspirin, and the subjects in the other group are given aspirin from the Simple Drug company. The number of minutes required for each subject to recover from the headache is recorded. A 5% significance level test is performed to determine whether Excellent's aspirin cures headaches significantly faster than Simple's aspirin. The data were analyzed with MINITAB, and the following output was obtained:
*SEE PICTURE*
1. What are the appropriate hypotheses for this test?
(a) H0: UE - US = 0; Ha: UE - US > 0
(b) H0: UE - US = 0; Ha: UE - US ≠ 0
(c) H0: UE - US = 0; Ha: UE - US < 0
(d) H0: UE - US < 0; Ha: UE - US = 0
(e) H0: UE - US > 0; Ha: UE - US = 0
e
The Excellent Drug Company claims its aspirin tablets will relieve headaches faster than any other aspirin on the market. To determine whether Excellent's claim is valid, 30 volunteers who are suffering from headaches are randomly assigned to two groups. The subjects in one group are given Excellent's aspirin, and the subjects in the other group are given aspirin from the Simple Drug company. The number of minutes required for each subject to recover from the headache is recorded. A 5% significance level test is performed to determine whether Excellent's aspirin cures headaches significantly faster than Simple's aspirin. The data were analyzed with MINITAB, and the following output was obtained:
*SEE PICTURE*
2. Which of the following is the most appropriate conclusion to draw at the a = 0.05 level?
(a) Reject H0: there is sufficient evidence that Excellent cures headaches faster than Simple.
(b) Accept Ha: there is sufficient evidence that Excellent cures headaches faster than Simple.
(c) Accept Ha: there is insufficient evidence to conclude that Excellent cures headaches faster than Simple.
(d) Fail to reject H0: there is sufficient evidence that Excellent cures headaches faster than Simple.
(e) Fail to reject H0: there is insufficient evidence to conclude that Excellent cures headaches faster than Simple.
b
The Excellent Drug Company claims its aspirin tablets will relieve headaches faster than any other aspirin on the market. To determine whether Excellent's claim is valid, 30 volunteers who are suffering from headaches are randomly assigned to two groups. The subjects in one group are given Excellent's aspirin, and the subjects in the other group are given aspirin from the Simple Drug company. The number of minutes required for each subject to recover from the headache is recorded. A 5% significance level test is performed to determine whether Excellent's aspirin cures headaches significantly faster than Simple's aspirin. The data were analyzed with MINITAB, and the following output was obtained:
*SEE PICTURE*
3. If the company performing this test committed a Type II error, which of the following describes what happened?
(a) The company concluded that Excellent aspirin works faster than Simple aspirin when it doesn't.
(b) The company hasn't concluded that Excellent aspirin works faster than Simple aspirin when it does.
(c) The company concluded that Excellent aspirin works faster than Simple aspirin when it does.
(d) The company rejected H0 when the P-value was greater than a.
(e) The company failed to reject H0 when the P-value was less than a.
c
4. All of us nonsmokers can rejoice-the mosaic tobacco virus that affects and injures tobacco plants is spreading! Meanwhile, a tobacco company is investigating if a new treatment is effective in reducing the damage caused by the virus. Eleven plants were randomly chosen. On each plant, one leaf was randomly selected, and the other half of the leaf (randomly chosen) was coated with the treatment, while the other half was left untouched (control). After two weeks, the amount of damage to each half of the leaf was assessed. For purposes of comparing the damage, which of the following is the appropriate type of procedure?
(a) Two-proportion z procedures
(b) Two-sample z procedures
(c) Matched pairs t procedures
(d) Two-proportion t procedures
(e) Two-sample t procedures
a
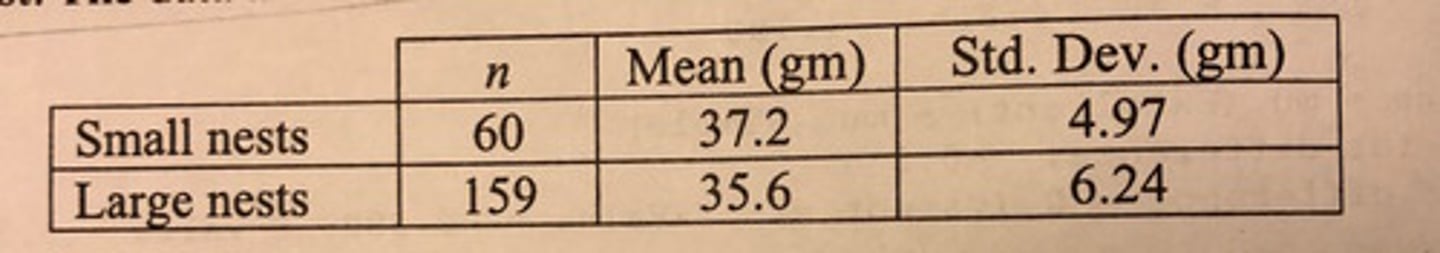
A researcher wants to see if birds that build larger nests lay larger eggs. She selects two random samples of nests: one of small nests and the other of large nests. She weighs one egg from each nest. The data are summarized below.
*SEE PICTURE*
5. Which of the following represents a 95% confidence interval for the difference between the average mass of eggs in small and large nests?
(a) (37.2-35.6) ± 2.009√4.97²/60+6.24²/159
(b) (37.2-35.6) ± 2.009√4.97²/59+6.24²/158
(c) (37.2-35.6) ± √4.97/59+6.24/158
(d) (37.2-35.6) ± √(4.97²+6.24²)/(59+158)
(e) (37.2-35.6) ± 4.97/√59+6.24/√158
c
6. Which of the following describes a situation in which it is safe to employ t-procedures
(a) n1=10, n2=40; both samples are moderately skewed.
(b) n1=10, n2=8; sample 1 is approximately normal, while sample 2 is skewed right.
(c) n1=6, n2=6; both samples are approximately normal.
(d) n1=35, n2=40; both samples are approximately normal, sample 2 has two outliers.
(e) It is safe to use t-procedures in more than one of the situations above.
b
Phoebe has a theory that older students at her high school are more likely to bring a bag lunch than younger students, because they have grown tired of cafeteria food. She takes a simple random sample of 80 sophomores and finds that 52 of them bring a bag lunch.
A simple random sample of 104 seniors reveals that 78 of them bring a bag lunch. Letting p1 = proportion of sophomores who bring a bag lunch, and p2 = proportion of seniors who bring a bag lunch, Phoebe
tests the hypotheses H0: p1 - p2 = 0; Ha: p1 - p2 < 0 at the α = 0.05 level.
7. When calculating the test statistic, what expression would Phoebe use to estimate the standard deviation of the sampling distribution of the difference in proportions, p(hat)1-p(hat)2?
(a) √(0.65)(0.35)/80+(0.75)(0.25)/104
(b) √(0.707)(0.293)/80+(0.707)(0.293)/104
(c) √(0.707)(0.293)/80+√(0.707)(0.293)/104
(d) √(0.65)(0.35)/80+√(0.75)(0.25)/104
(e) √((0.65)(0.35)/80)²+√((0.75)(0.25)/104)²
a
Phoebe has a theory that older students at her high school are more likely to bring a bag lunch than younger students, because they have grown tired of cafeteria food. She takes a simple random sample of 80 sophomores and finds that 52 of them bring a bag lunch.
A simple random sample of 104 seniors reveals that 78 of them bring a bag lunch. Letting p1 = proportion of sophomores who bring a bag lunch, and p2 = proportion of seniors who bring a bag lunch, Phoebe
tests the hypotheses H0: p1 - p2 = 0; Ha: p1 - p2 < 0 at the α = 0.05 level.
8. Phoebe's test statistic is -1.48. Which of the following is the closest to the appropriate P-value for the test?
(a) 0.0694
(b) 0.0808
(c) 0.1388
(d) 0.8612
(e) 0.9306
d
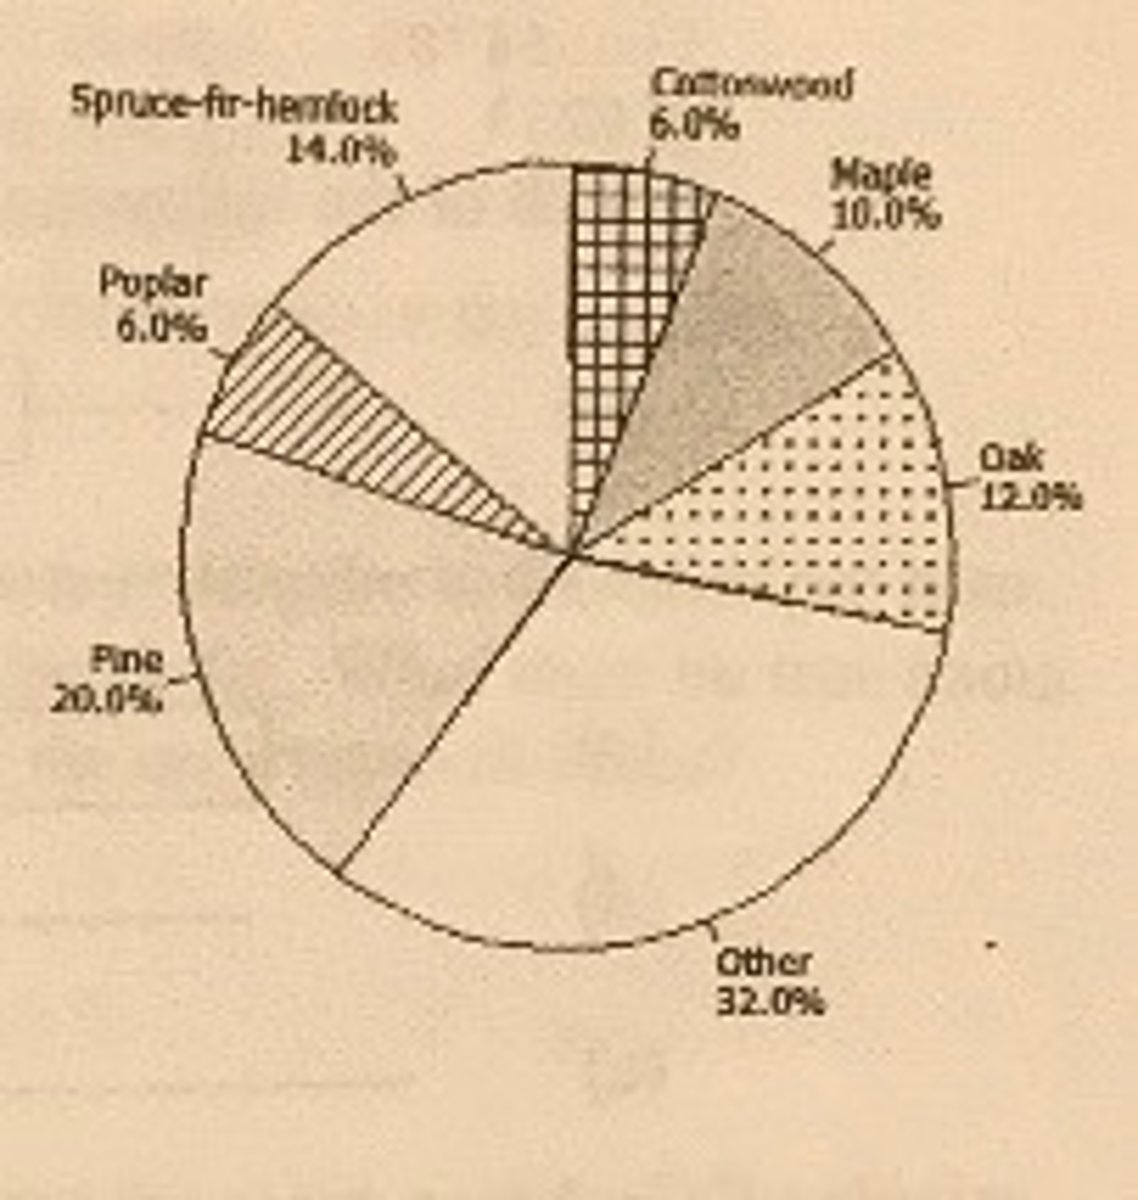
The pie chart at the right describes the distribution of state tree types for the 50 states in the United States. The category "Other" includes all trees that are the state tree for two or fewer states. Which of the following conclusions can we draw from this chart?
a. Some states have not designated a "state tree."
b. The cottonwood is the state tree for 12 states.
c. Taken together, oak, pine, and maple are the state trees for more than half the states.
d. There are 10 states that have designated a pine as their state tree.
e. There is no state that has designated the Eastern Red Cedar as its state tree.
c
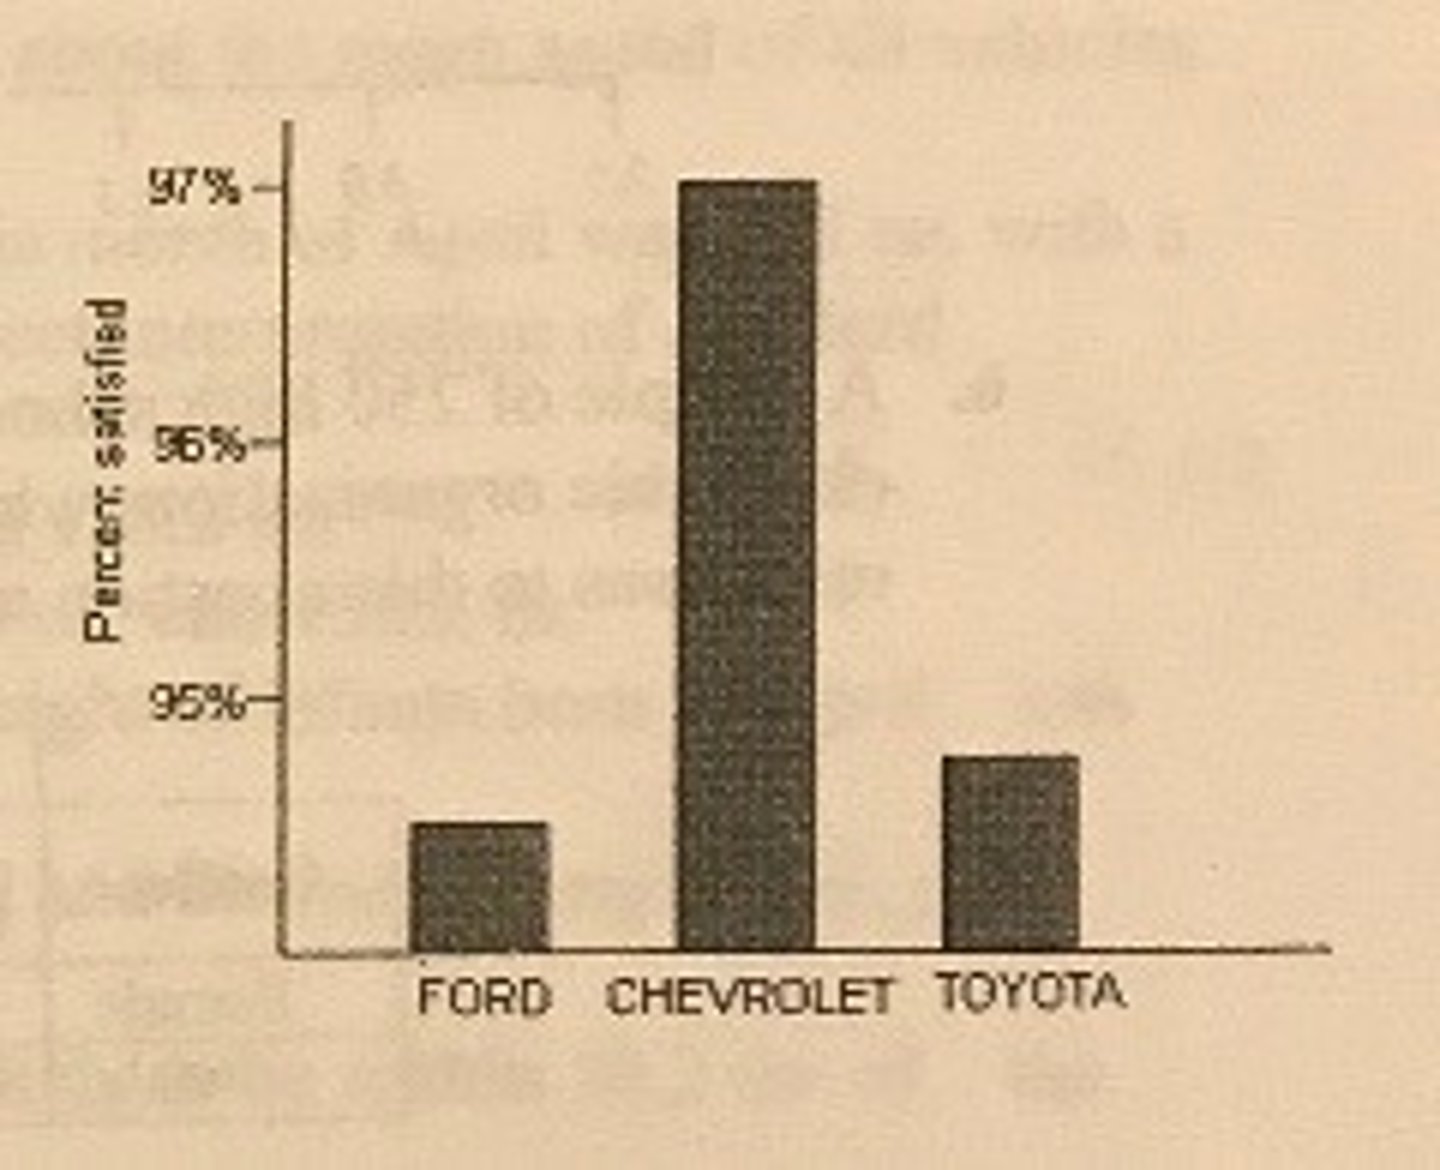
The following bar graph gives the percent of owners of three brands of trucks who are satisfied with their truck. From this graph, we may conclude that
a. owners of other brands of trucks are less satisfied than the owners of these three brands.
b. Chevrolet owners are much more satisfied than Ford or Toyota owners.
c. There are only small differences in the satisfaction of owners for the three brands.
d. Chevrolet probably sells more trucks than Ford or Toyota.
e. A pie chart would have been a better choice for displaying these data.
b
Here are the IQ test scores of 10 randomly chosen fifth-grade students.
145 139 126 122 125 130 96 110 118 118
To make a stemplot of these scores, you would use as stems
a. 0 and 1
b. 09, 10, 11, 12, 13, and 14
c. 96, 110, 118, 122, 125, 126, 130, 139, and 145
d. 0, 2, 3, 5, 6, 8, 9
e. None of the above is a correct answer.
c
If a distribution is skewed to the right, which of the following is true?
a. The mean must be less than the median.
b. The mean and median must be equal.
c. The mean must be greater than the median.
d. The mean is either equal to or less than the median.
e. It's impossible to tell which of the above statements is true without seeing the data.
c
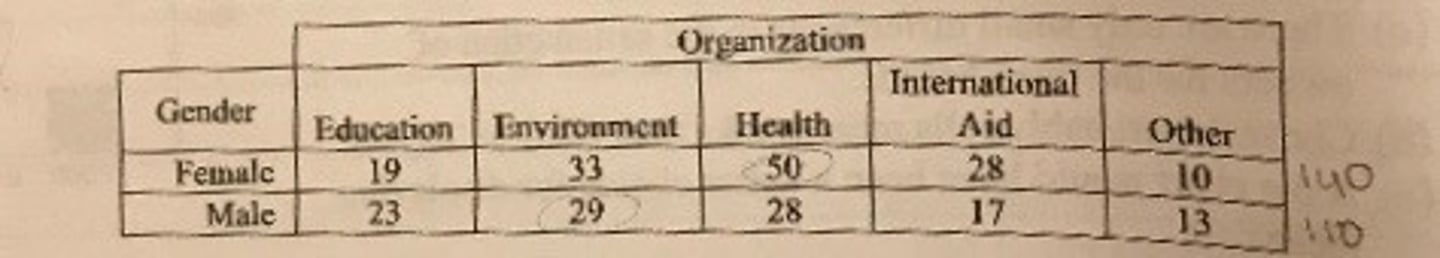
A sample of 250 high school students were asked, "If you had $1000 to contribute to one kind of charitable organization, which type of organization would you choose?" Below is a two-way table of responses to this question and gender. Which of the following conclusions seems to be supported by the data?
a. Most of the females who chose a health organization would have chosen an environmental organization as their second choice, had they been asked.
b. There is no association between gender and choice of organizations.
c. The proportion of males who said they would contribute to an environmental organization was higher than the proportion of females who said they would contribute to such an organization.
d. None of the students surveyed said they would contribute to religious organizations.
e. The marginal distribution of Organization is 140, 110.
b
A small company that prints custom t-shirts has 6 employees, one of whom is the owner and manager. Suppose the owner makes $120,000 per year and the other employees make between $40,000 and $50,000 per year. One day, the owner decides to give himself a $30,000 raise. Which of the following describes how the company's mean and median salaries would change?
a. The men and median would both increase by $5,000.
b. The mean would increase by $5,000 and the median would not change.
c. The mean would increase by $6,000 and the median would not change.
d. The median would increase by $6,000 and the mean would not change.
e. The mean would increase by $6,000, but we cannot determine the change in the median without more information.
a
The mean speed of vehicles in the "cars only" lanes of the New Jersey turnpike is 68 miles per hour. The mean speed of vehicles in the "any vehicle" lanes is 64 miles per hour. What must be true about the mean speed of all vehicles on the turnpike, assuming these are the only types of lanes?
a. It could be any number between 64 and 68 miles per hour.
b. It must be larger than the median speed.
c. It must be larger than 66 miles per hour.
d. It must be 66 miles per hour.
e. We don't have enough information to draw any conclusion about the mean speed of all vehicles.
d
The mean birth weight of infants born at a certain hospital in the month of April was 128 oz, with a standard deviation of 10.2 oz. Which of the following is a correct interpretation of standard deviation?
a. All the infants born in April weighed between 117.8 oz. and 138.2 oz.
b. About half the infants born in April weighed between 117.8 oz. and 138.2 oz.
c. The difference between the mean weight and the median weight of infants born in April was 10.2 oz.
d. The distance between the weight of each infant born in April and the mean weight was, on average, about 10.2 oz.
e. The mean weight of infants born in subsequent months is likely to be within 10.2 oz. of the mean weight in April.
c
A medical researcher collects health data on many women in each of several countries. One of the variables measured for each woman in the study is her weight in pounds. The following list gives the five-number summary for the weights of adult woman in one of the countries.
Country A: 92, 110, 120, 160, 240
About what percent of Country A women weigh between 110 and 240 pounds?
a. 50%
b. 65%
c. 75%
d. 85%
3. 95%
b
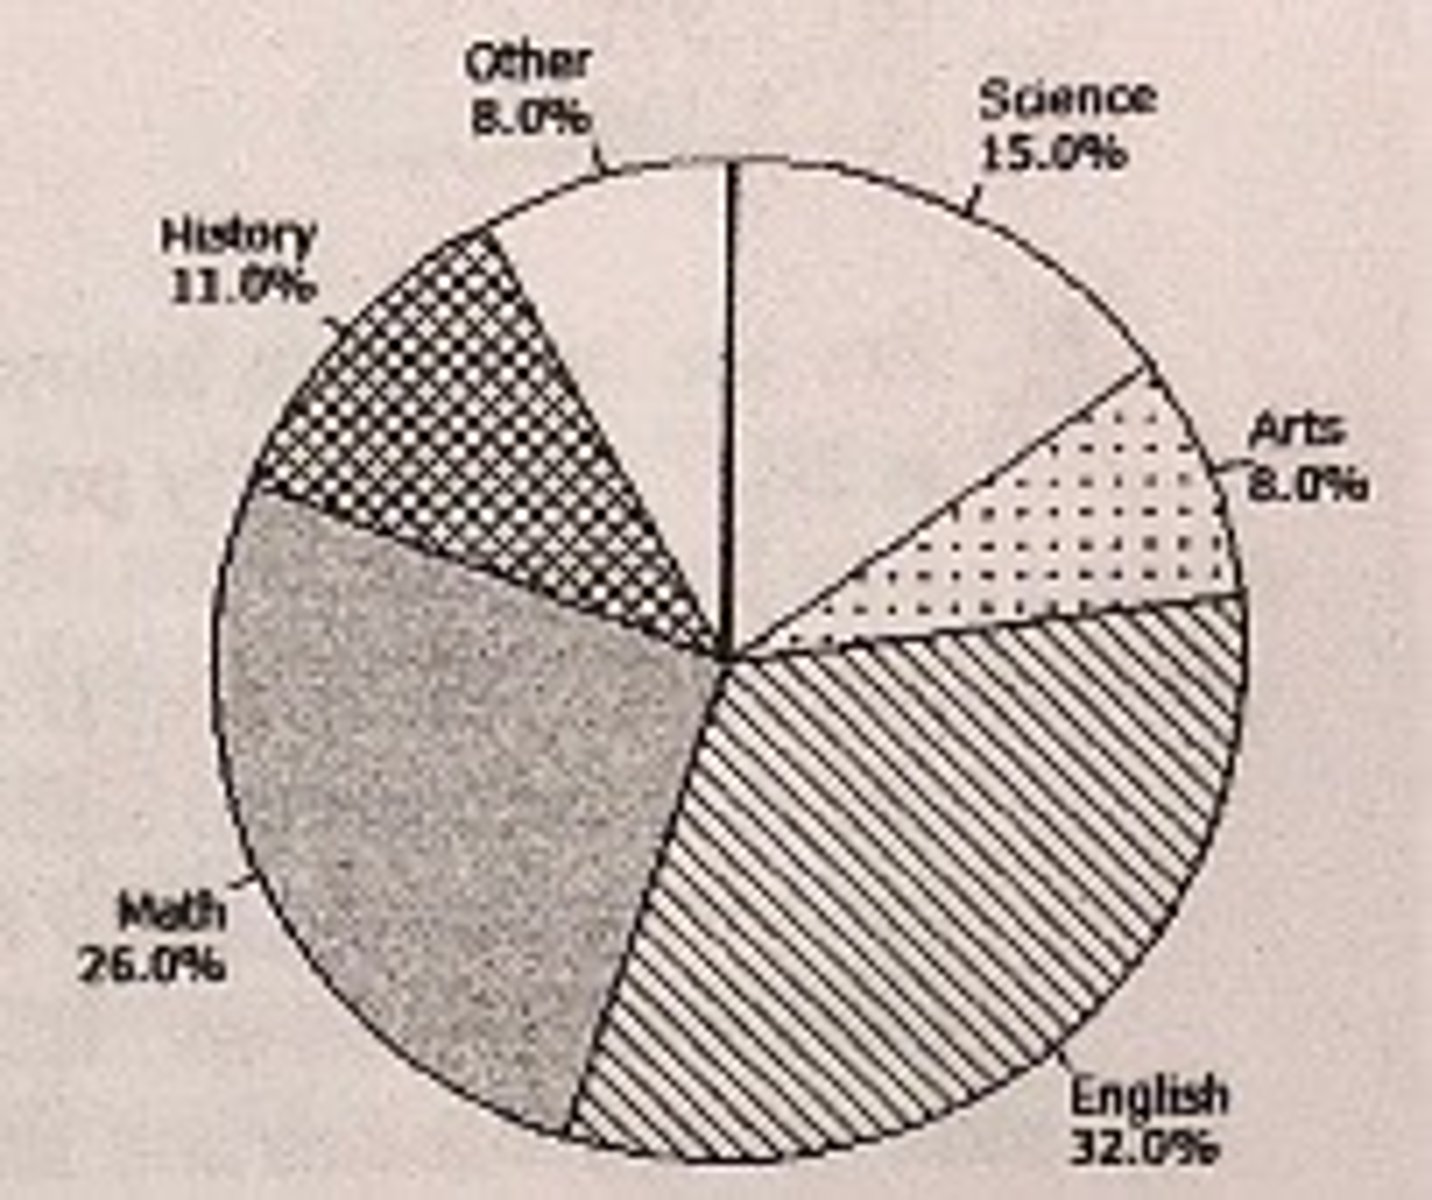
The pie chart at the right describes the distribution of favorite school subject for 300 high school students. Which of the following can we conclude from this paragraph?
a. Math was the favorite subject for 26 students.
b. English was the favorite subject of 96 students.
c. Taken together, history, English, and the arts were the favorite subjects of less than half the students.
d. No student said that Spanish was his or her favorite subject.
e. Most of the English students were female.
d
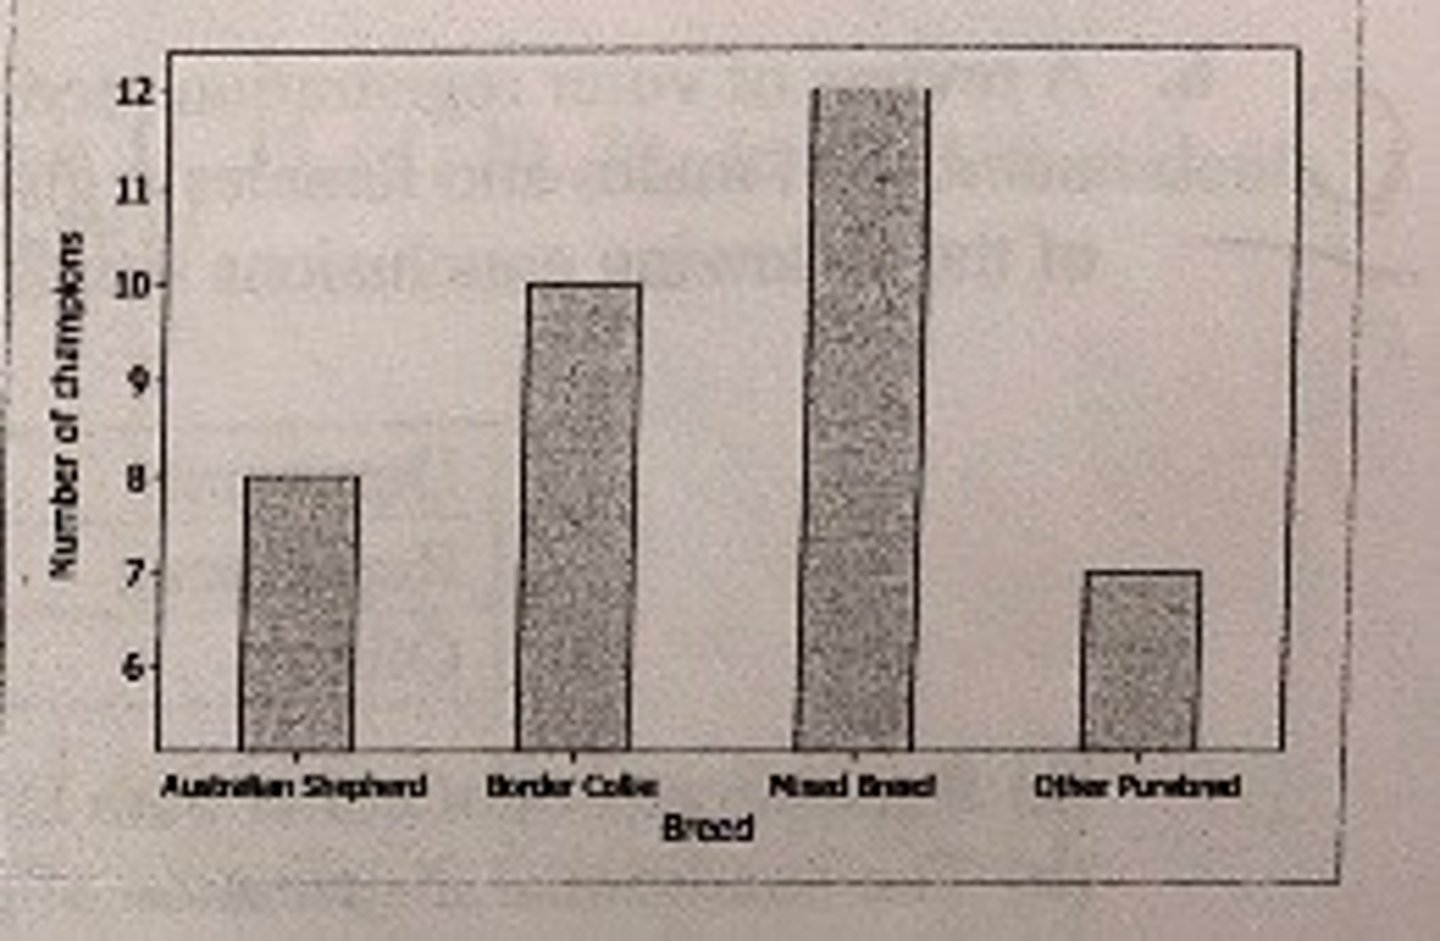
The bar graph at the right shows the distribution of breeds for all the champions of the annual World Canine Disc Championships from 1975 to 2009. Which of the following statements can be made on the basis of this graph?
a. Mixed breed dogs have won the championship twice as often as Australian Shepherds.
b. Most of the mixed breed dogs were at least half Border Collie.
c. None of the champion dogs were Labrador Retrievers.
d. The graph exaggerates the difference between the number of champions in each breed.
e. Border Collies are larger dogs than Australian Shepherds.
b
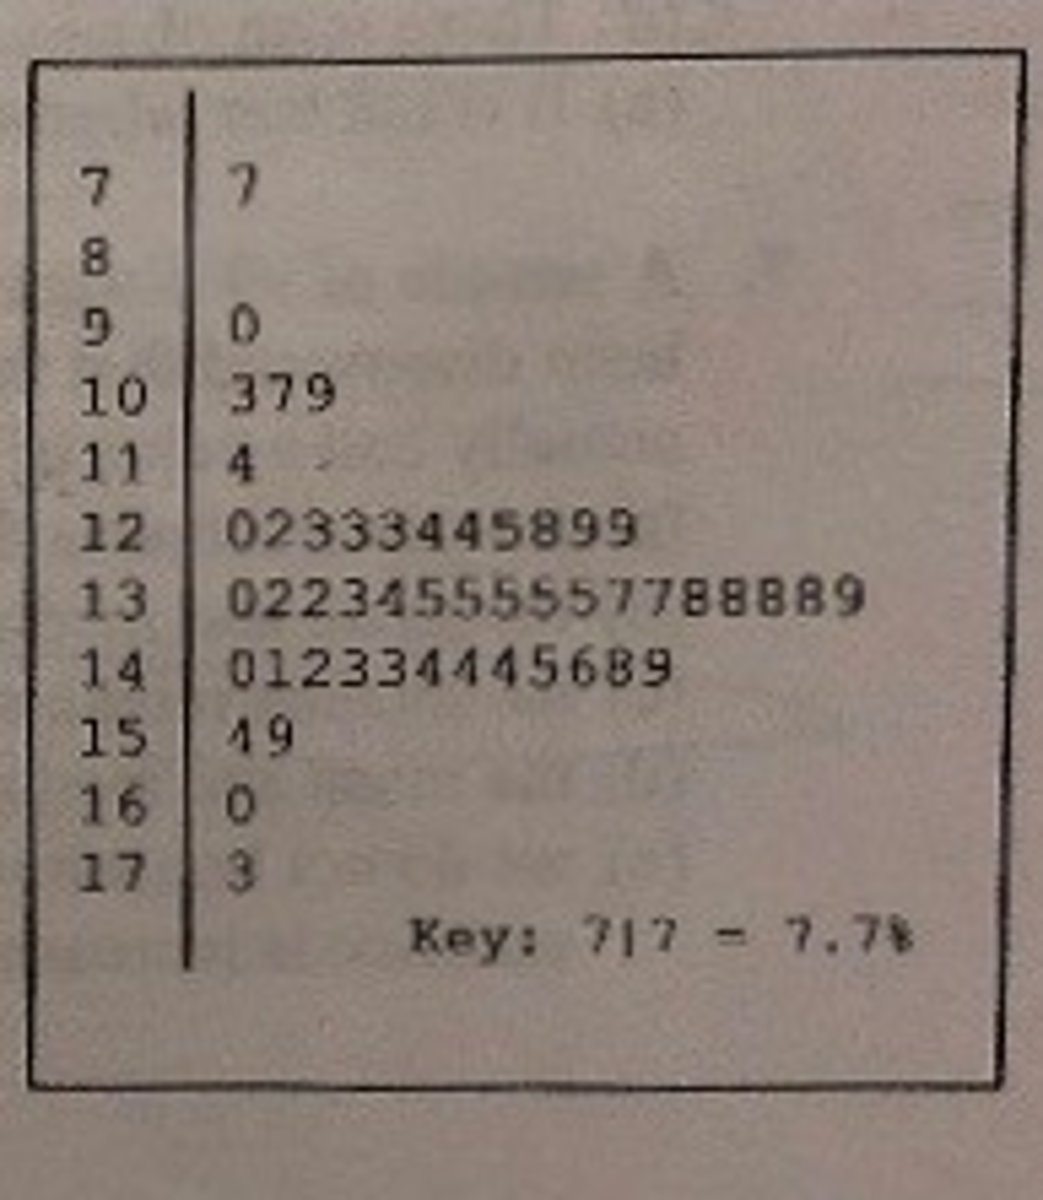
The population of the United States is aging, though less rapidly than in other developed countries. At the right is a stemplot of the percentages of residents aged 65 and older in each of the 50 states, according to the 2010 census. There are three outliers: Alaska has the lowest percentage of older residents, Utah had the second lowest, and Florida has the highest. What is the percentage for Utah?
a. 7.7%
b. 9.0%
c. 14.0%
d. 15.0%
e. 90%
d
The Interquartile range for the distribution of 50 states in the previous question is:
a. 12.4% to 14.3%
b. 12.4% to 14.5%
c. 1.8%
d. 1.9%
e. 2.1%
d
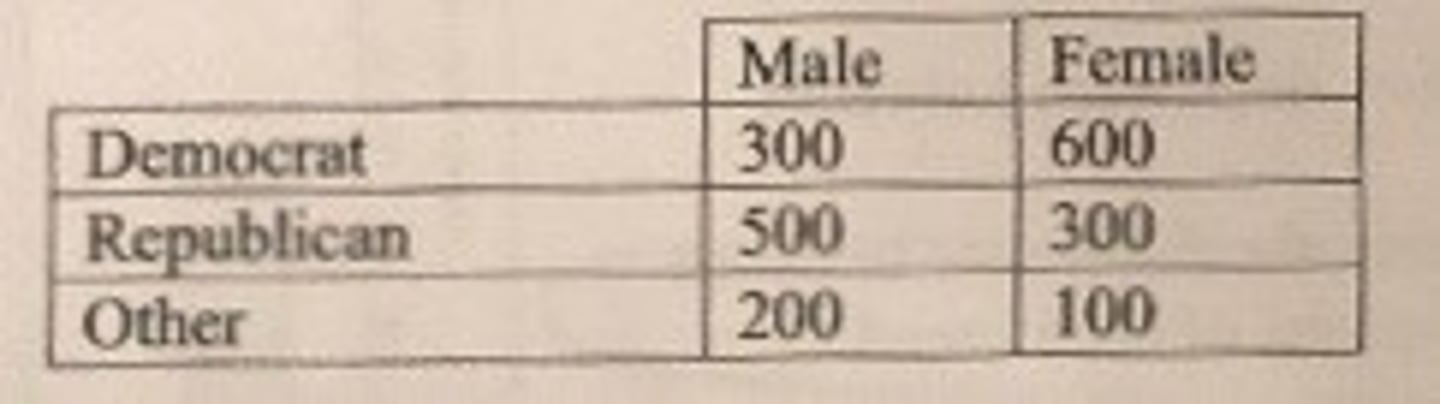
A review of voter registration records in a small town yielded the following table of the number of males and females registered as Democrat, Republican, or some other affiliation. Which of the following conclusions seems to be supported by the data?
a. Republicans outnumber both Democrats and "Other."
b. The conditional distribution of party affiliation for males is 1100.
c. The marginal distribution of party affiliation is 1000, 1000.
d. There is an obvious association between gender and political part registration.
e. It is unclear whether there is an association between gender and political party registration.
c
A sample of 99 distances has a mean of 24 feet and a median of 24.5 feet. Unfortunately, it has just been discovered that the maximum value in the distribution, which was erroneously recorded as 40, actually had a value of 50. If we make this correction to the data, then
a. the mean remains the same, but the median is increased.
b. the mean and median remain the same.
c. the median remains the same, but the mean is increased.
d. the mean and median are both increased.
e. we do not know how the mean and median are affected without further calculations, but the variance is increased.
b
`Mr. Yates picked up a dozen items in the grocery store with a mean cost of $3.25. Then he added an apple pie for $6.50. The new mean for all 13 items is
a. $3.00
b. $3.50
c. $3.75
d. $4.88
e. none of the above
d
A small company estimating its photocopying expenses finds that the mean number of copies made per day for the past 12 months is 258 copies per day with a standard deviation of 24 copies per day. Which of the following is a correct interpretation of standard deviation?
a. The number of copies made per day was always between 234 and 282.
b. About 95% of the time, the number of copies made per day was between 234 and 282.
c. The difference between the mean number of copies made per day and the median number of copies made per day was 24.
d. On average, the number of copies made each day was about 24 copies per day away from the mean, 258.
e. 1.5 times the interquartile range of copies made per day is 24.
c
The five-number summary for scores on a statistics exam is 11, 35, 61, 70, 79. In all, 380 students took the test. About how many had scores between 35 and 61?
a. 26
b. 76
c. 95
d. 190
e. None of these
b
In a study of the effects of acid rain, a random sample of 100 trees from a particular forest is examined. Forty percent of the trees show some signs of damage. Which of the following statements is correct?
a. 40% is a parameter
b. 40% is a statistic
c. 40% of all trees in the forest show some signs of damage
d. More than 40% of all the trees in the forest show some signs of damage
e. Less than 40% of all the trees in the forest show some signs of damage
c
The sampling distribution os a statistic is
a. the probability that we obtain the statistic in repeated random samples.
b. the mechanism that determines whether randomization was effective.
c. the distribution of values taken by a statistic in all possible samples of the same size from the same population.
d. the extent to which the sample results differ systematically from the truth.
e. the distribution of values in a sample of size n from the population
b
A statistic is said to be unbiased if
a. the survey used to obtain the statistic was designed to avoid even the hints of racial or sexual prejudice
b. the mean of its sampling distribution is equal to the true value of the parameter being estimated
c. both the person who calculated the statistic and the subjects who make up the statistic were truthful
d. the value of the statistic from any sample is equal to the parameter being estimated.
e. is is used for honest purposed only
b
Which of the following distributions has a mean that varies from sample to sample?
I. The population distribution
II. The distribution of sample data
III. The sampling distribution
a. I only
b. II only
c. III only
d. II and III
e. all three distributions
a
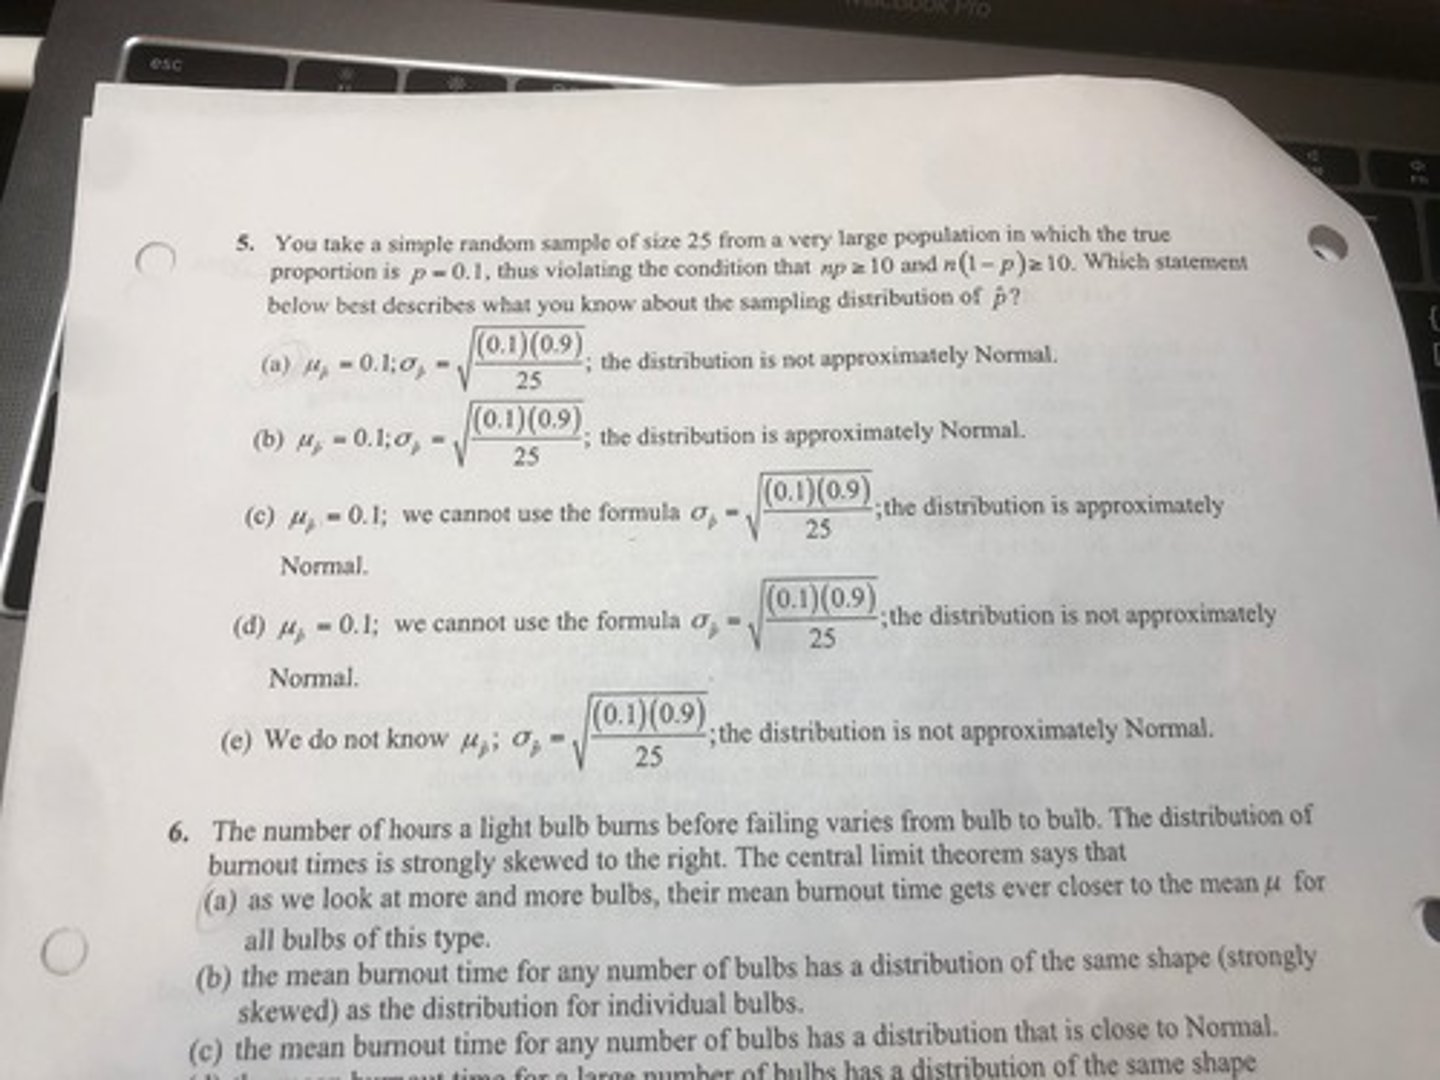
You take a simple random sample of size 25 from a very large population in which the true proportion is p = 0.1, thus violating the condition that np ≥ 10 and n(1 - p) ≥ 10. Which statement below best describes what you know about the samplings distribution of p̂?
e
The number of hours a light bulb burns before failing varies from bulb to bulb. The distribution of burnout times is strongly skewed to the right. The CLT states that
a. as we look at more and more bulbs, their mean burnout times gets even closer to the mean μ for all bulbs of this type.
b. the mean burnout time for any number of bulbs has a distribution of the same shape (strongly skewed) as the distribution for individual bulbs.
c. the mean burnout time for any number of bulbs is close to Normal.
d. the mean burnout time for a large number of bulbs has a distribution of the same shape (strongly skewed) as the distribution for individual bulbs.
e. the mean burnout time for a large number of bulbs has a distribution that is close to Normal.
a
You take an SRS of size 500 from the 37,000 students at Purdue University and measure individual's heights. You then take an SRS of size 500 from the 4,400,000 adults in the state of Indiana and measure their heights. Assuming the standard deviation of individual heights in the two populations is the same, the standard deviation of the sampling distribution of mean heights for the Indiana sample is
a. approximately the same as for the Perdue sample because both are samples of size 500.
b. smaller than for the Perdue samples because the population of Indiana is much larger.
c. larger than for the Perdue sample because the population os Indiana is much larger.
d. larger, because the Indiana sample is smaller relative to the population from which it's been taken.
e. either larger or smaller than for the Perdue sample because it varies from sample to sample.
b
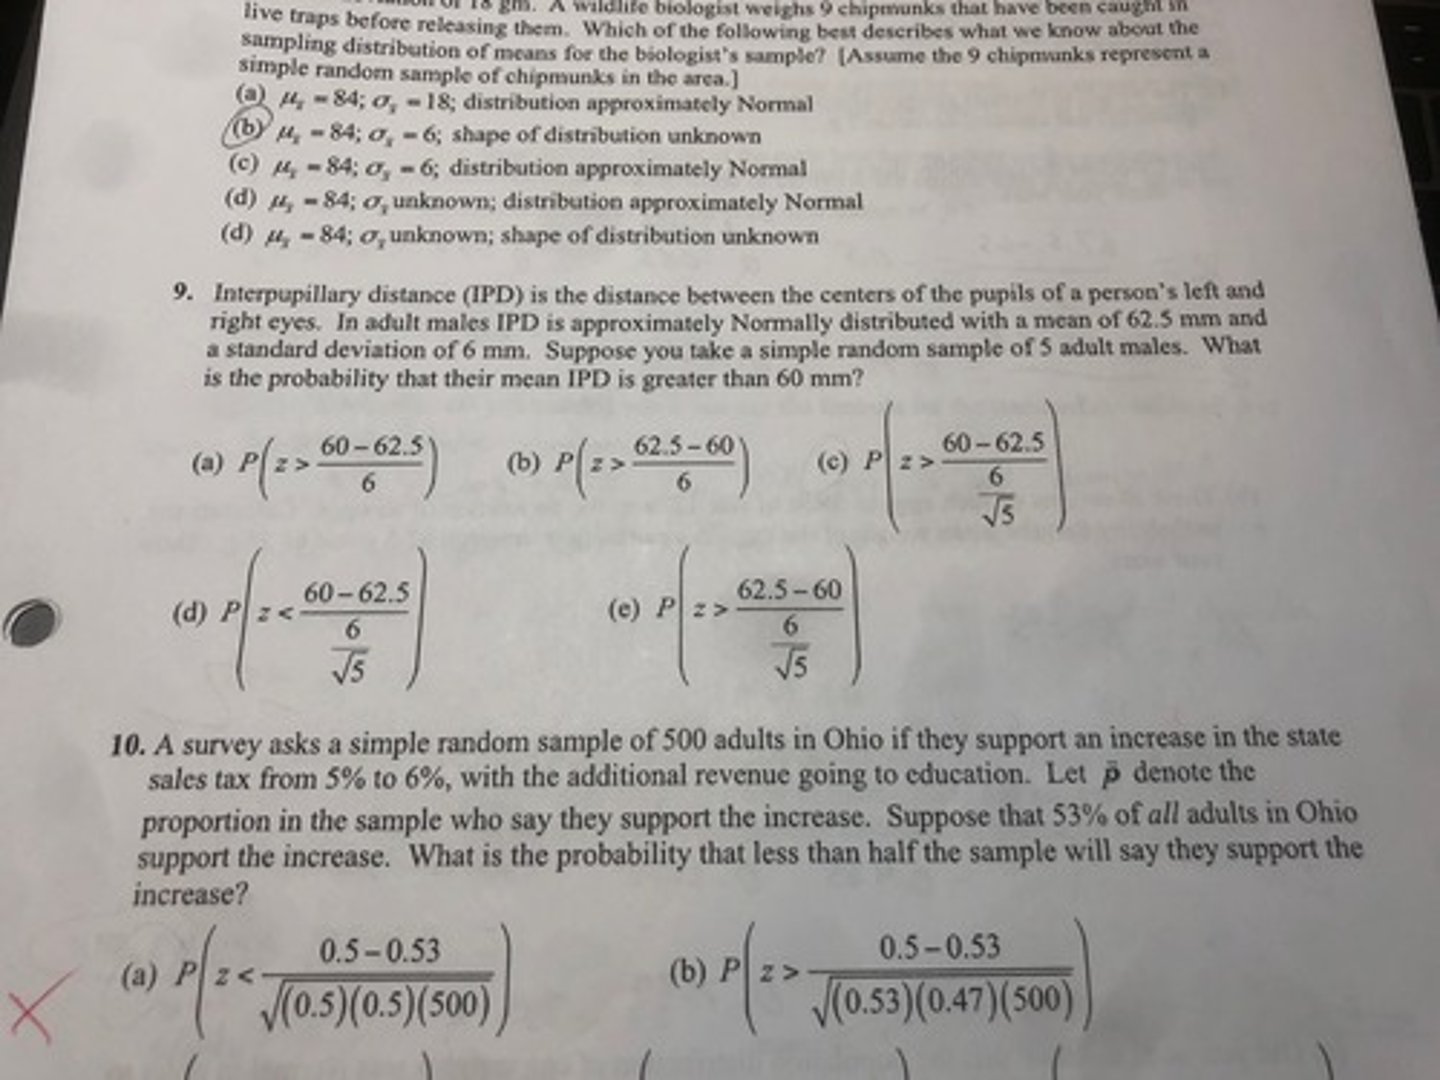
The chipmunk population in a certain area is known to have mean weight of 84 gm and a standard deviation of 18 gm. A wildlife biologist weighs 9 chipmunks that have been caught in live traps before releasing them. Which of the following best describes what we know about the sampling distribution of means for the biologist's sample? [Assume the 9 chipmunks represent a simple random sample of chipmunks in the area.]
a. μx̅ = 84; σx̅ = 18; distribution approximately Normal
b. μx̅ = 84; σx̅ = 6; shape of distribution unknown
c. μx̅ = 84; σx̅ = 6; distribution approximately Normal
d. μx̅ = 84; σx̅ = unknown; distribution approximately Normal
e. μx̅ = 84; σx̅ = unknown; shape of distribution unknown
c
Interpupillary distance (IPD) is the distance between the centers of the pupils of a person's left and right eyes. In adult males, IPD is approximately Normally distributed with a mean of 62.5 mm and a standard deviation of 6 mm. Suppose you take an SRS of 5 adult males. What is the probability that their mean IPD is greater than 60 mm?
d
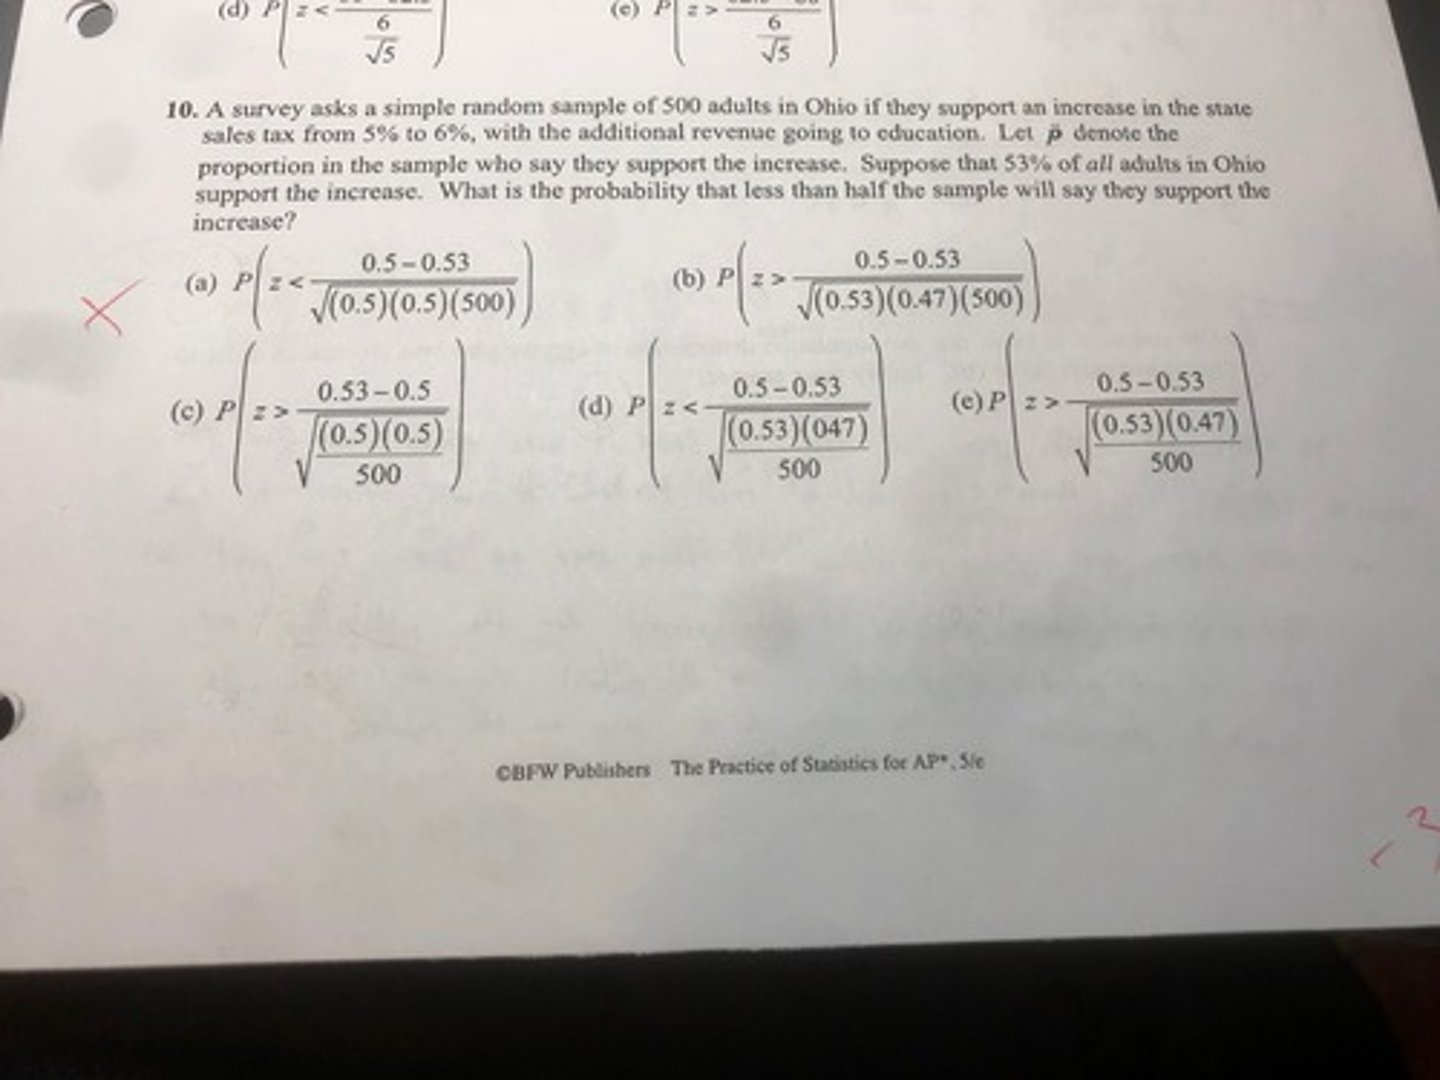
A survey asks a SRS of 500 adults in Ohio is they support an increase in the state sales tax from 5% to 6%, with the additional revenue going to education. Let p denote the proportion in the sample who say they support the increase. Suppose that 53% of all adults in Ohio support the increase. What is the probability that less than half the sample will say they support the increase?
a
Following a recent dramatic drop of 500 points in the Dow Jones Industrial Average, a poll conducted for the Associated Press found that 92% of those polled said that a year from now their family financial situation will be as good as it is today or better. Which of the following terms describes the number 92%?
a. statistic.
b. sample.
c. sample parameter.
d. population parameter.
e. population.
d
What is distribution of values taken by a statistic in all possible examples of the same size from the same population called?
a. the probability that the statistic is obtained
b. the population parameter.
c. the variance of the values.
d. the sampling distribution of the statistic.
e. the distribution of sample data.
d
If a statistic used to estimate a parameter is such that the mean of its samplings distribution is equal to the true value of the parameter being estimated, what is the statistic said to be?
a. random
b. biased
c. a proportion
d. unbiased
e. non-varying
c
Suppose you take a random sample of size 25 from a population with mean 120 and a standard deviation of 15. Your sample has a mean of 115 and a standard deviation of 13.8 which of the following has a mean of 120 and a standard deviation of 3?
a. the distribution of the population
b. the distribution of the sample data.
c. the sampling distribution of the sample mean.
d. the sampling distribution of the population mean.
e. No important distribution related to this situation has the given mean and standard deviation.
c
In order to use the formula σx̅ = σ/sqrt n to calculate the standard deviation of the sampling distribution of the sample mean, which of the following conditions must be met?
I. n ≥ 30
II. The population's distribution is approximately Normal.
III. The sample size is less than 10% of the population size.
a. I only
b. II only
c. III only
d. III and either I or II
e. all three conditions must be met
a
The CLT refers to which of the following characteristic of the sampling distribution fo the sample mean?
a. Regardless of the shape of the population's distribution, the sampling distribution of the sample mean from sufficiently large samples will be approximately Normally distributed.
b. Regardless of the shape of the population's distribution, the standard deviation of the sampling distribution of the sample mean from sufficiently large samples will be σx̅ = σ/sqrt n.
c. Regardless of the shape of the population's distribution, the mean of the sampling distribution of the sample mean from sufficiently large samples will be equal to the mean of the population.
d. As you take larger and larger samples from a Normally distributed population, the mean of the sampling distribution of the sample mean gets closer and closer to the population mean.
e. As you take larger and larger samples from a Normally distributed population, the mean of the sampling distribution of the sample mean gets closer and closer to the population mean.
b
A simple random sample of 1000 Americans found that 62% were satisfied with the service provided by the dealer from which they bought their car. A simple random sample of 1000 Canadians found that 59% were satisfied with the service provided by the dealer from which they bought their car. The sampling variability with these statistics is
a. exactly the same
b. not exactly the same, but very close
c. much smaller for the sample of Canadians because the population of Canada is much smaller than that of the United States, hence the sample is a larger proportion of the population.
d. smaller for the sample of Canadians because the percent satisfied was smaller than that for Americans.
e. larger for the Canadians because Canadian citizens are more widely dispersed throughout the country than are citizens in the United States, hence they have more views.
a
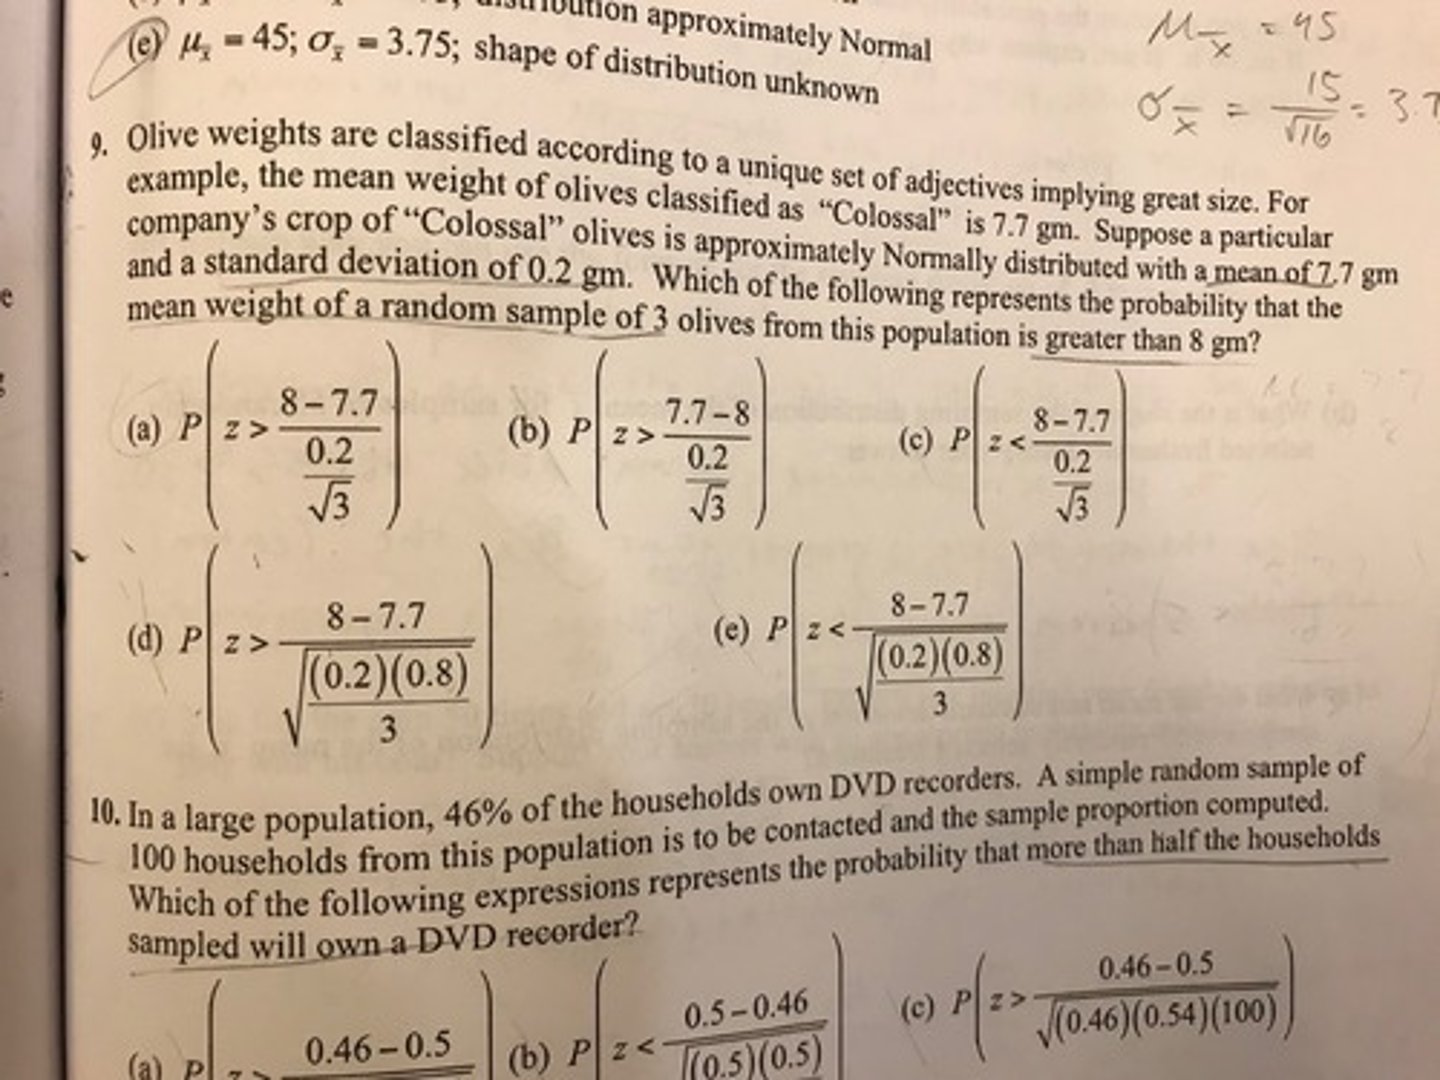
Olive wights are classified according to a unique set of adjectives implying great size. For example, the mean weight of olives classified as "Colossal" is 7.7 gm. Suppose a particular company's crop of "Colosal" olives is approximately Normally distributed with a mean of 7.7 gm and a standard deviations off 0.2 gm. Which of the following represents the probability that the mean weight off a random sample of 3 olives from this population is greater than gm?
e
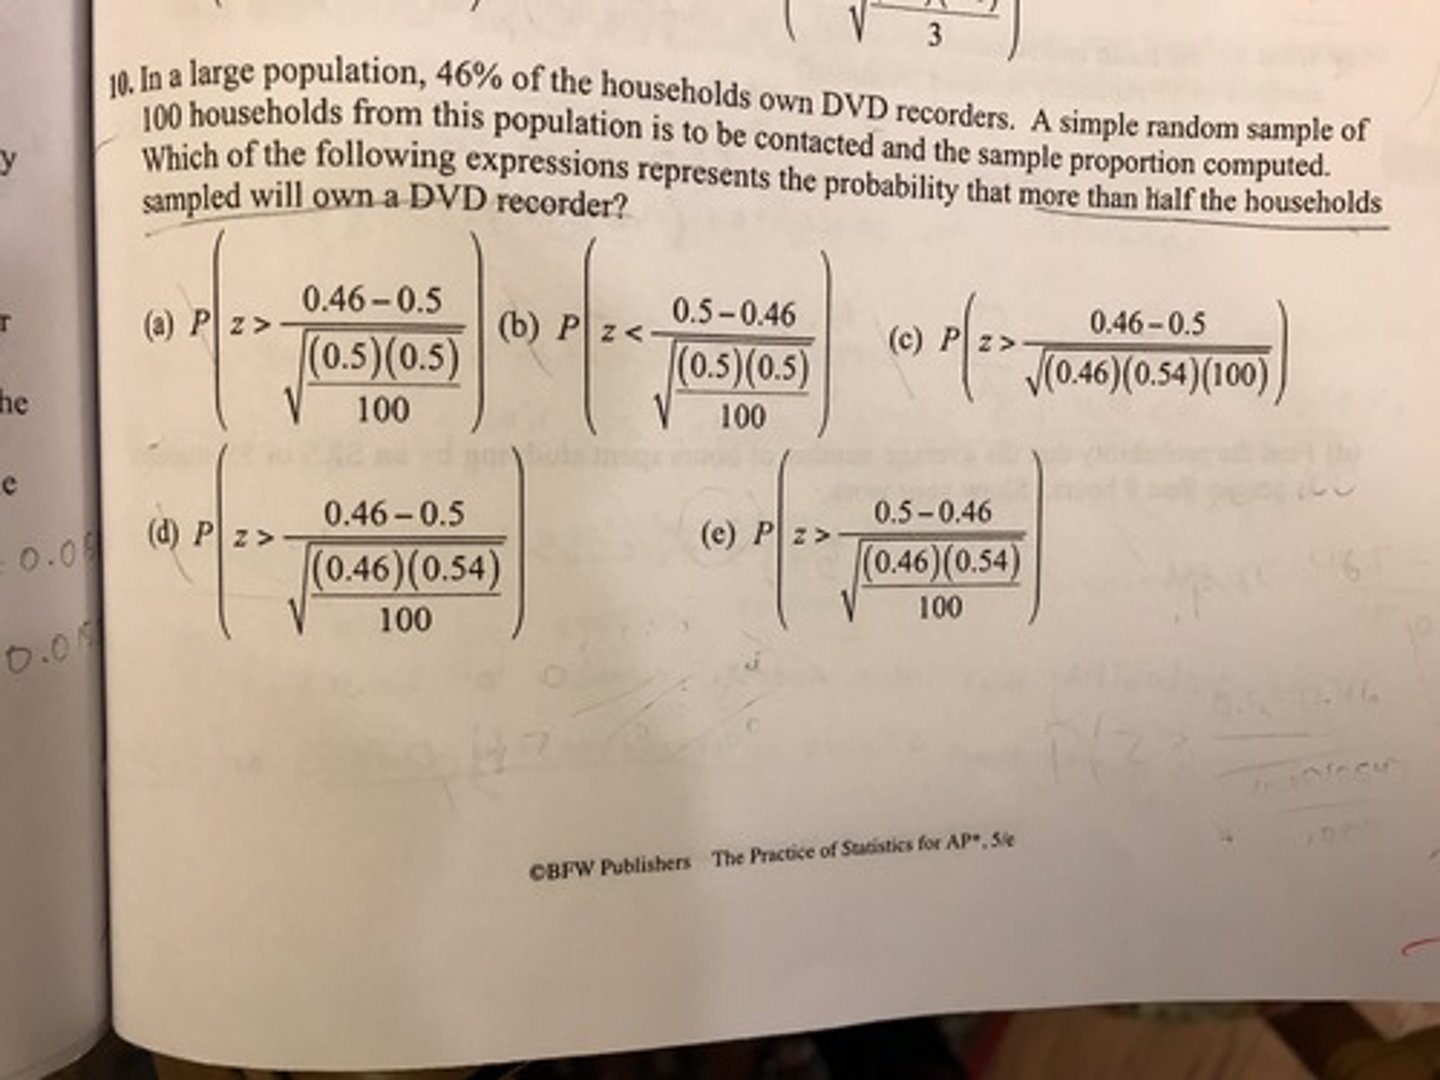
In a large population, 46% of the households own DVD recorders. A simple random sample of 100 households from this population is to be contacted and the sample proportion computed. Which of the following expressions represent the probability that more than half the households sampled will own a DVD recorder?
B
In an opinion poll, 25% of a random sample of 200 people said that they were strongly opposed to having a state lottery. The standard error of the sample proportion is approximately:
a) 0.0094
b) 0.0306
c) 0.0353
d) 0.2500
e) 6.1237
D
A marketing consultant wants to estimate the proportion of all shoppers at a certain mall who make at least one purchase. He stands at a mall exit for two hours on a weekday afternoon and flips a coin each time a shopper leaves. If the coin comes up heads, he asks them if they have made any purchases during this visit. After two hours, he has 132 responses, 104 whom made a purchase. Which condition for constructing a confidence interval for a proportion has the consultant failed to satisfy?
a) np̂ ≥ 10
b) n(1-p̂ ) ≥ 10
c) n ≥ 30
d) The data is a random sample from the population of interest.
e) The sample is less than 10% of the population.
D
The report of a sample survey of 1,014 adults says, "With 95% confidence, between 9% and 15% of all Americans expect to spend more money on gifts this year than last year." What does the phrase "95% confidence" mean?
a) 95% of all Americans will spend between 9% and 15% more than what they spent last year.
b) 9% to 15% of all Americans will spend 95% of what they spent last year.
c) There is a 95% chance that the percent who expect to spend more is between 9% and 15%.
d) The method used to get the interval from 9% to 15%, when used over and over, produces intervals which include the true population percentage about 95% of the time.
e) We can be 95% confident that the method used to get the interval always gives the right answer.
E
PREVIOUS QUESTION: **The report of a sample survey of 1,014 adults says, "With 95% confidence, between 9% and 15% of all Americans expect to spend more money on gifts this year than last year." What does the phrase "95% confidence" mean?**
The survey in the previous question was conducted by calling land-line telephones, and those conducting the survey are concerned about the possibility of undercoverage, since some people do not own a phone or own only a cell phone. Which of the following is the best way for them to correct for this source of bias?
a) Use a lower confidence level, such as 80%.
b) Use a higher confidence level, such as 99%.
c) Take a larger sample.
d) Use a t-interval instead of a z-interval.
e) Throw this sample out and start over again with a better sampling method.
B
Some scientists believe that a new drug would benefit about half of all people with a certain blood disorder. To estimate the proportion of patients who would benefit from taking the drug, the scientists will administer it to a random sample of patients who have the blood disorder. What sample size is needed so that the 95% confidence interval will have a margin of error of no more than 3%?
a) 748
b) 1068
c) 1503
d) 2056
e) 2401
d
Which of the following has the highest probability?
a) Randomly selecting a value greater than 3 from a standard Normal distribution.
b) Randomly selecting a value greater than 3 from a t-distribution with 4 degrees of freedom.
c) Randomly selecting a value greater than 3 from a t-distribution with 20 degrees of freedom.
d) Randomly selecting a value less than 3 from a standard Normal distribution.
e) Randomly selecting a value less than 3 from a t-distribution with 20 degrees of freedom.
C
A nationwide poll of 2.525 adults estimated with a 95% confidence that the proportion of Americans that support health care reform is 0.78 ± 0.0162. A member of Congress thinks that 95% confidence isn't enough. He wants to be 99% confident. How would the margin of error of a 99% confidence interval based on the same sample compare with the 95% interval?
a) It would be smaller, because it omits only 1% of the possible samples instead of 5% percent.
b) It would be the same, because the sample is the same.
c) It would be larger, because higher confidence requires a larger margin of error.
d) Can't tell, because the margin of error varies from sample to sample.
e) Can't tell, because it depends on the size of the population.
E
You want to calculate a 98% confidence interval for a population mean from a sample of n = 18. What is the appropriate t*?
a) 2.110
b) 2.326
c) 2.539
d) 2.552
e) 2.567
C
The height (in inches) of males in the United States are believed to be approximately Normally distributed with mean μ. The mean height of a random sample of 25 American adult males is found to be x̅ = 69.72 inches and the standard deviation s = 4.15. What is the standard error of x̅?
a) 0.17
b) 0.69
c) 0.83
d) 1.856
e) 2.04
B
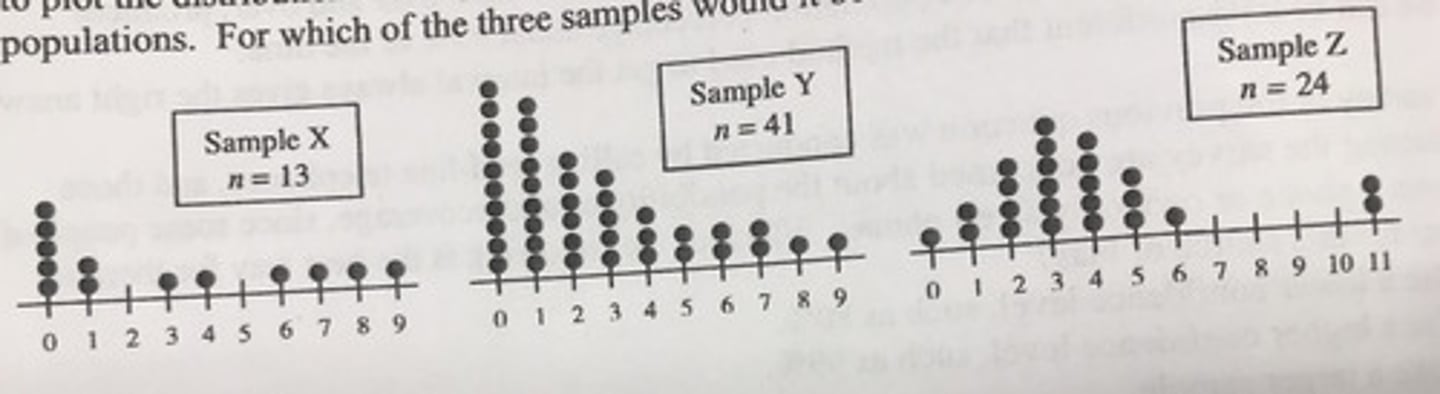
In checking conditions for constructing confidence intervals for a population mean, it's important to plot the distribution of sample data. Below are dot plots describing samples from three different populations. For which of the three samples would it be safe to construct a t-interval?
Sample X: n = 13
Sample Y: n = 41
Sample Z: n = 24
a) Sample X only.
b) Sample Y only.
c) Sample Z only.
d) Samples Y and Z.
e) None of the samples.
D
A random sample of 900 individuals has been selected from a large population. It was found that 180 are regular users of vitamins. Thus, the proportion of the regular users of vitamins in the population is estimated to be 0.20. The standard error of this estimate is approximately:
a) 0.1600
b) 0.0002
c) 0.4000
d) 0.0133
e) 0.0267
E
A traffic consultant wants to estimate the proportion of cars on a certain street that have more than two occupants. She stands at the side of the road for two hours on a weekday afternoon and flips a coin each time a car approaches. If the coin comes up heads, she counts the number of occupants in the car. After two hours, she has counted 103 cars, 15 of which had more than two occupants. Which condition for constructing a confidence interval for a proportion has she failed to satisfy?
a) n ≥ 30
b) np ≥ 10
c) n(1-p) ≥ 10
d) The sample is less than 10% of the population.
e) The data is an SRS from the population of interest.
E
A polling organization announces that the proportion of American voters who favor congressional term limits is 64%, with a 95% confidence margin of error of 3%. Which of the following statements is a correct interpretation of 95% confidence?
a) If the poll were conducted again in the same way, there is a 95% chance that the fraction of voters favoring term limits in the second poll would be between 61% and 67%.
b) There is a 95% probability that the true percent of voters favoring term limits is between 61% and 67%.
c) If the poll were conducted again in the same way, there is a 95% probability that the percent of voters favoring term limits in the second poll would be within 3% of the percent favoring term limits in the first poll.
d) Among 95% of the voters, between 61% and 67% favor term limits.
e) None of the above.
A
PREVIOUS QUESTION:
(**A polling organization announces that the proportion of American voters who favor congressional term limits is 64%, with a 95% confidence margin of error of 3%. Which of the following statements is a correct interpretation of 95% confidence?**)
Suppose the poll in the previous question was conducted by email, and those conducting the survey are concerned about the possibility of undercoverage, since some people do not use email or have filters that block mass emails. Which of the following is the best way for them to correct for this source of bias?
a) Throw this sample out and start over again with a better sampling method.
b) Use a higher confidence level, such as 99%.
c) Use a lower confidence interval, such as 80%.
d) Use a t-interval instead of a z-interval.
e) Take a larger sample.
E
To assess the accuracy of a laboratory scale, a standard weight that is known to weigh 1 gram is repeatedly weighed a total of n times and the mean x̅ of the weightings is computed. Suppose the scale readings are Normally distributed with unknown mean μ and standard deviation σ = 0.01 g. How large should n be so that a 95% confidence interval for μ has a margin of error of ± 0.0001?
a) 100
b) 196
c) 27,061
d) 10,000
e) 38,416
A
Which of the following has the highest probability?
a) Randomly selecting a value between -2 and 2 from a standard Normal distribution.
b) Randomly selecting a value between -2 and 2 from a t-distribution with 4 degrees of freedom.
c) Randomly selecting a value between -2 and 2 from a t-distribution with 20 degrees of freedom.
d) Randomly selecting a value less than -2 or greater than 2 from a standard Normal distribution.
e) Randomly selecting a value less than -2 or greater than 2 from a t-distribution with 20 degrees of freedom.
C
A 95% confidence interval for the mean reading achievement score for a population of third-grader students is (44.2, 54.2). Suppose you compute a 99% confidence interval using the same data. Which of the following statements is correct?
a) The intervals have the same width.
b) The 99% interval is narrower.
c) The 99% interval is wider.
d) The 99% interval could be wider or narrower - it depends on the sample.
e) The answer can't be determined from the information given.
C
What is the critical value t* that satisfies the condition that the t-distribution with 8 degrees of freedom has probability 0.10 to the right of t*?
a) 0.90
b) 1.282
c) 1.397
d) 1.415
e) 1.860
C
The weights of 9 men have mean x̅ = 175 pounds and standard deviation s = 15 pounds. What is the standard error of the mean?
a) 58.3
b) 15
c) 5
d) 1.67
e) 1.29
C
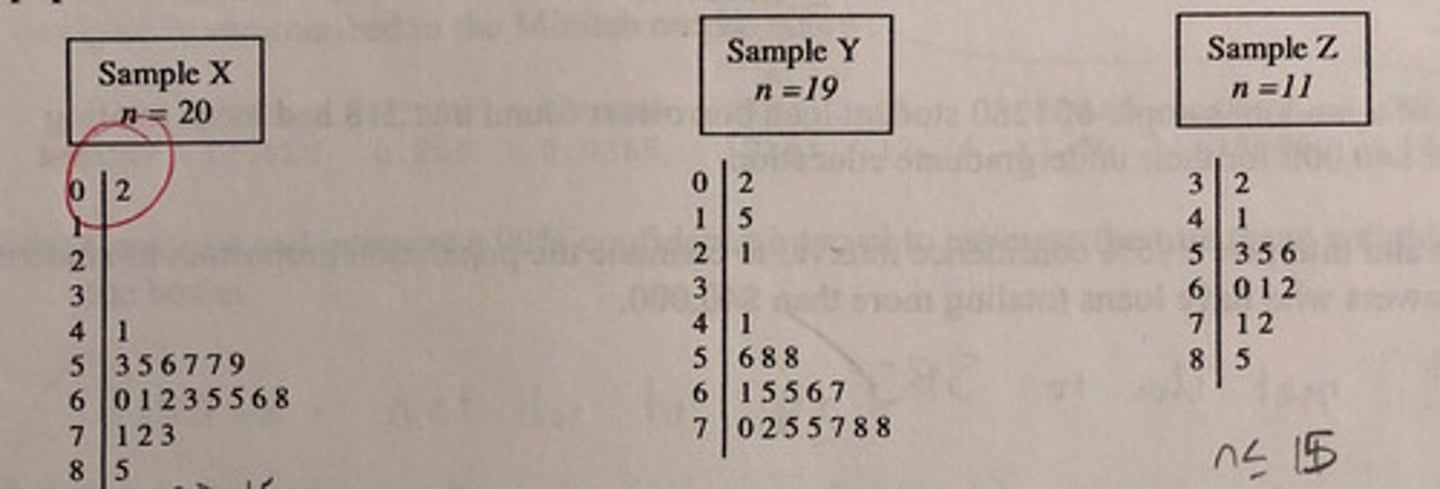
In preparation for constructing a confidence interval for a population mean, it's important to plot the distribution of sample data. Below are stem plots describing samples from three different populations. For which of the three samples would it be safe to construct a t-interval?
Sample X: n = 20
Sample Y: n = 19
Sample Z: n = 11
a) Sample X only.
b) Sample Y only.
c) Sample Z only.
d) Sample X and Z.
e) None of the plots.
A
Which of these variables is least likely to have a Normal distribution?
A) Annual income for all 150 employees at a local high school
B) Lengths of 50 newly hatched pythons
C) Heights of 100 white pine trees in a forest
D) Amount of soda in 60 cups filled by an automated machine at a fast-food restaurant
E) Weights of 200 of the same candy bar in a shipment to a local supermarket
C
The proportion of observations from a standard Normal distribution that take values larger than -0.75 is about
A) 0.2266
B) 0.7704
C) 0.7734
D) 0.7764
E) 0.8023
B
The distribution of the heights of students in a large class is roughly Normal. Moreover, the average height is 68 inches, and approximately 95% of the heights are between 62 and 74 inches. Thus, the standard deviation of the height distribution is approximately equal to
A) 2
B) 3
C) 6
D) 9
E) 12
d
If a store runs out of advertised material during a sale, customers become upset, and the store loses not only the sale but also goodwill. From past experience, a music store finds that the mean number of CDs sold in a sale is 845, the variance is 15, and a histogram of the demand is approximately Normal. The manager is willing to accept a 2.5% chance that a CD will be sold out. About how many CDs should the manager order for an upcoming sale?
A) 1295
B) 1070
C) 935
D) 875
E) 860
B
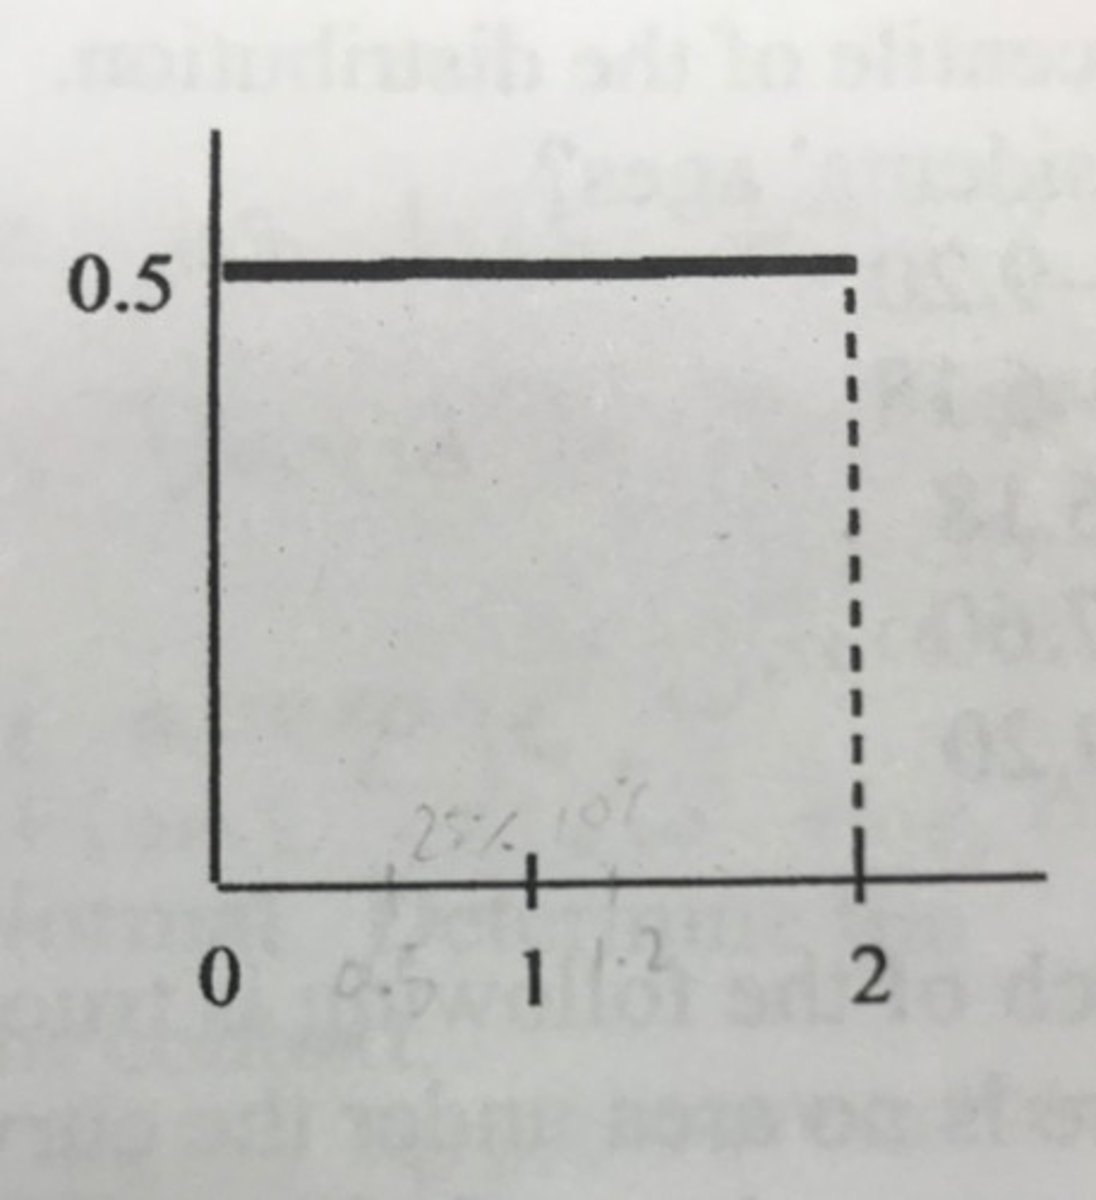
The density curve shown to the right takes the value 0.5 on the interval 0 ≤ x ≤ 2 and takes the value 0 everywhere else. What percent of the observations lie between 0.5 and 1.2?
(a) 25%
(b) 35%
(c) 50%
(d) 68%
(e) 70%
C
If your score on a test is at the 60th percentile, you know that your score lies
A) below the first quartile
B)between the first quartile and the median
C)between the median and the third quartile
D) above the third quartile
E)There is not enough information to say where it lies relative to the quartiles
c
In some courses (but certainly not in an intro stats course!), students are graded on a "Normal curve." For example, students within ± 0.5 standard deviations of the mean receive a C; between 0.5 and 1.0 standard deviations above the mean receive a C+; between 1.0 and 1.5 standard deviations above the mean receive a B; between 1.5 and 2.0 standard deviations above the mean receive a B+, etc. The class average on an exam was 60 with a standard deviation of 10. The bounds for a B grade and the percent of students who will receive a B grade if the marks are actually Normally distributed are
(a) (65, 75), 24.17%
(b) (70, 75), 18.38%
(c) (70, 75), 9.19%
(d) (65, 75), 12.08%
(e) (70, 75), 6.68%
C
The mean age (at inauguration) of all U.S. Presidents is approximately Normally distributed with a mean of 54.6. Barack Obama was 47 when he was inaugurated, which is the 11th percentile of the distribution. Which of the following is closest to the standard deviation of presidents' ages?
A) -9.2
B) -6.18
C) 6.18
D) 7.6
E) 9.20
B
Which of the following is true about all Normal distributions?
A) There is no area under the curve for z-scores greater than 3.49
B) The area underneath the curve is equal to 1
C) The points at which the curvature changes from up to down (inflection points) are at the 1st and 3rd quartiles of the distribution
D) About 68% of the values of the variable are more than one standard deviation away from the mean.
E) At the mean, the height of the curve is 0.5
E
The 16th percentile of a Normally distributed variable has a value of 25 and the 97.5th percentile has a value of 40. Which of the following is the best estimate of the mean and standard deviation of the variable.
A) Mean= 32.5 SD=2.5
B) Mean=32.5 SD=5
C) Mean=32.5 SD=10
D) Mean=30 SD=2.5
E) Mean=30 SD =5
The equal sign should be approximately equal to but I don't think thats a computer key
A
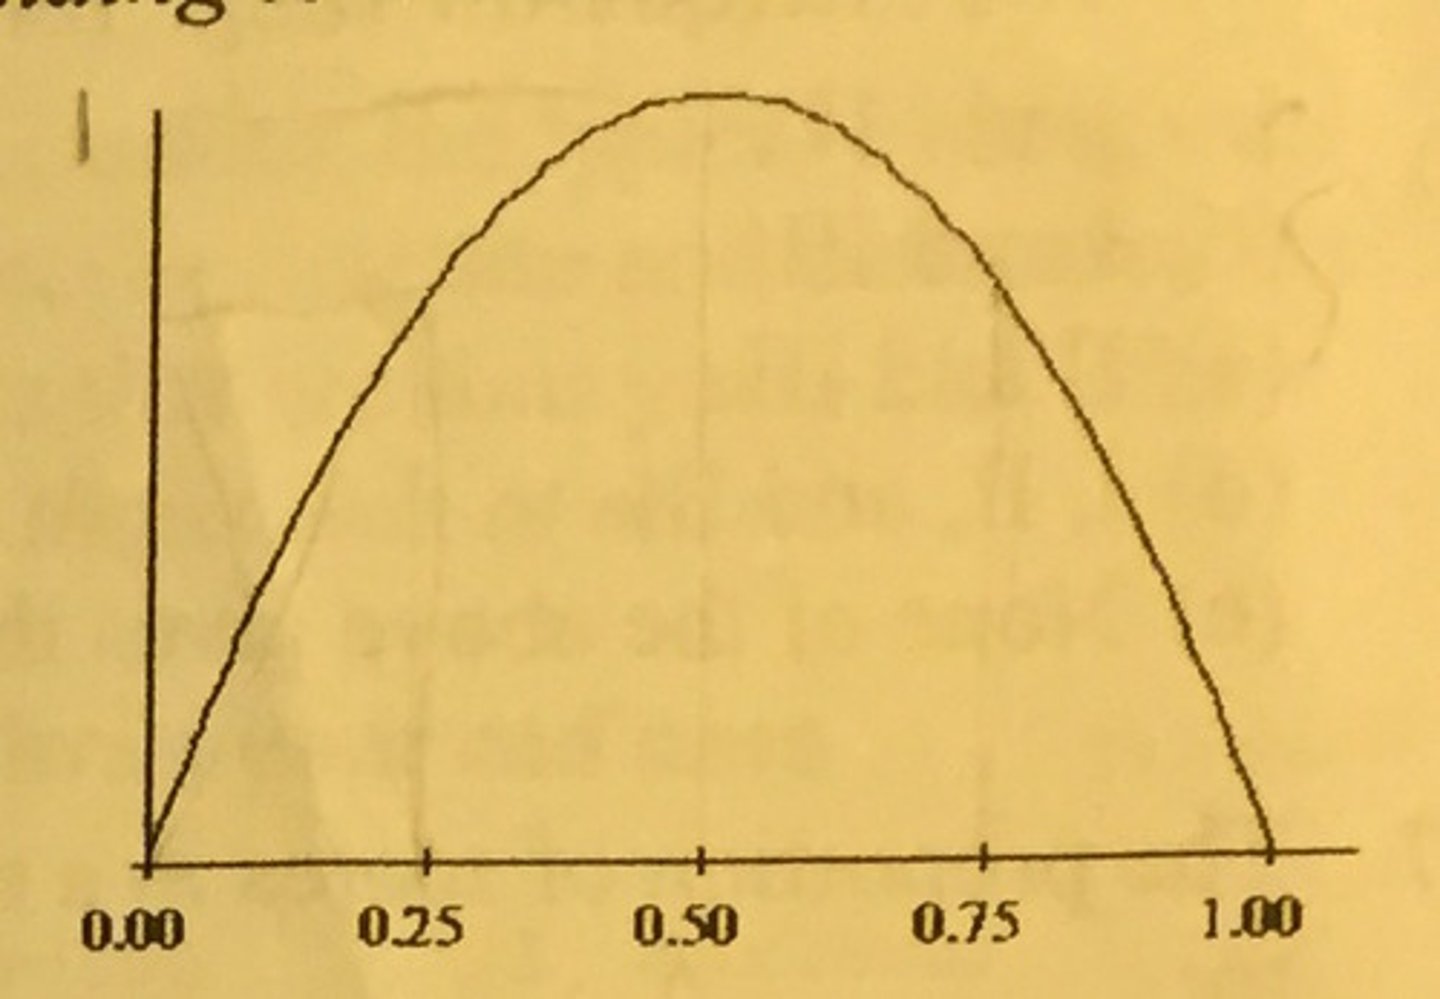
For the density curve shown, which statement is true?
(a) The density curve is symmetric.
(b) The density curve is skewed right.
(c) the area under the curve between 1 and 0 is 1.
(d) The density curve is normal.
(e) None of the above is correct.
A
For the density curve shown in question 3, which statement is true?
(a) The mean and median are equal.
(b) The mean is greater than the median.
(c) The mean is less than the median.
(d) The mean could be either greater than or less than the median. (e) None is the above is correct.
C
Suppose that 16-ounce bags of chocolate chip cookies are produced with weights that follow a Normal Distribution with mean weight 16.1oz and standard deviation of 0.1oz. The percentage of bags that will contain between 16.0 and 16.1oz is about...
a) 10
b) 16
c) 34
d) 68
e) none of the above is correct
B
QUESTION #3: (*Suppose that 16-ounce bags of chocolate chip cookies are produced with weights that follow a Normal Distribution with mean weight 16.1oz and standard deviation of 0.1oz. The percentage of bags that will contain between 16.0 and 16.1oz is about...*)
For the distribution of cookie bags described in Question 3, approximately what percent of the bags will likely be underweight (that is, less than 16oz)?
a) 10
b) 16
c) 34
d) 68
e) none of the above is correct
D
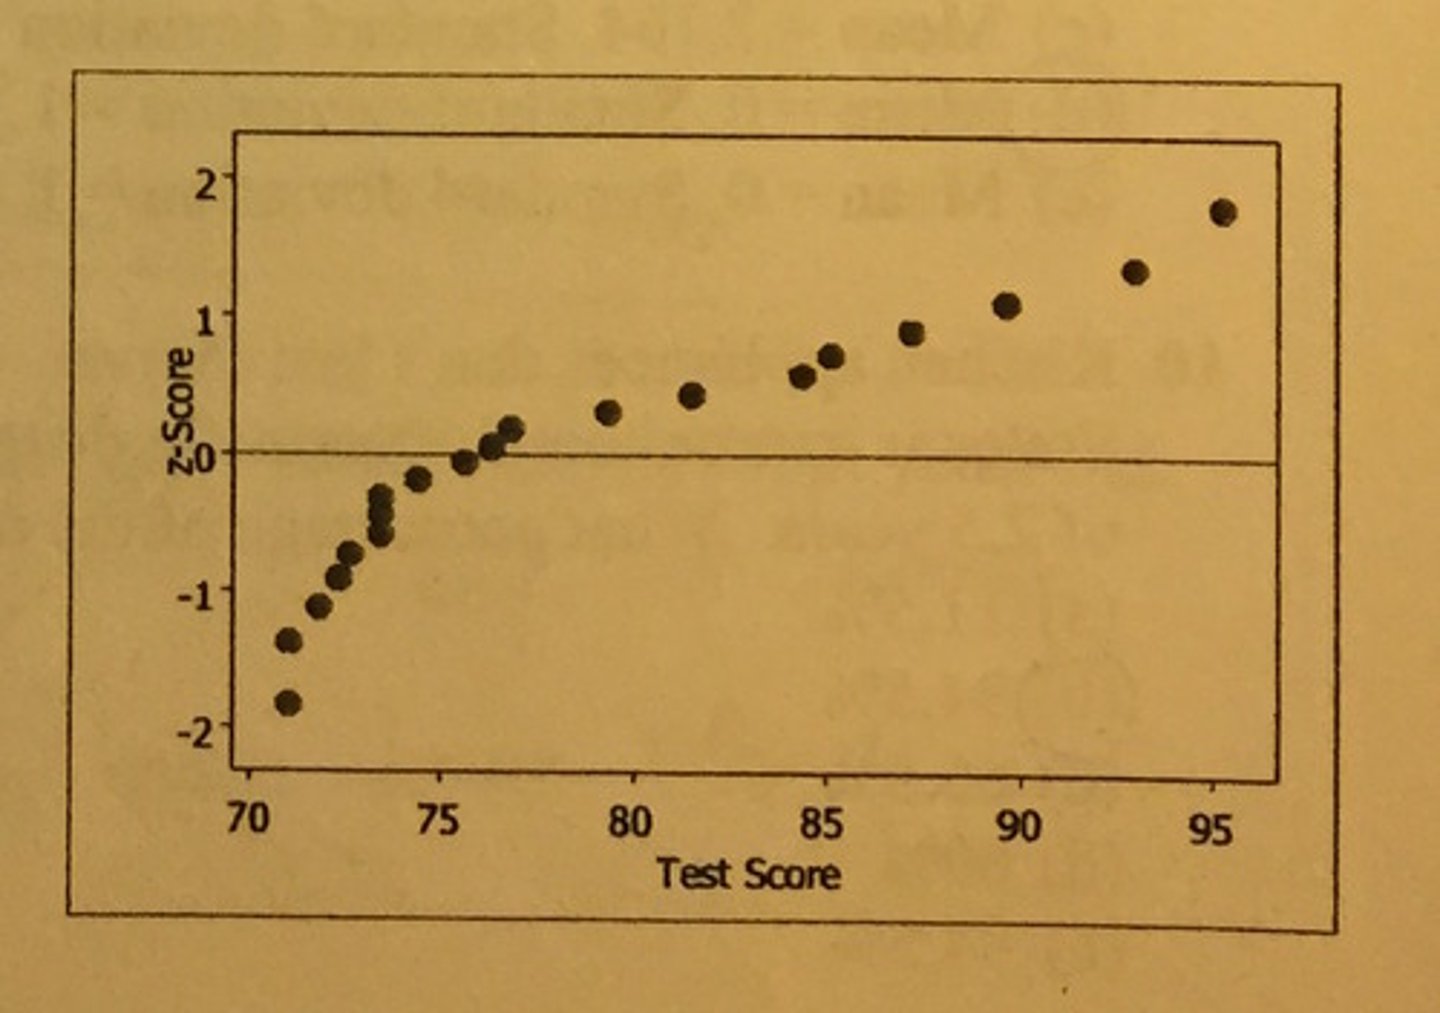
The plot shown at the right is a normal probability plot for a set of test scores. Which statement is true for these data?
a) the data are clearly normally distributed
b) the data are approximately Normally distributed
c) the data are clearly skewed to the left
d) the data are clearly skewed to the right
e) there is insufficient information to determine the shape of the distribution
A
Which of the following statements are true?
I. The area under a normal curve is always 1, regardless of the mean and std dev.
II. The mean is always equal to the median for any Normal Distribution
III. The interquartile range for any Normal curve extends from "mean - std dev." to "mean + std dev."
a) I and II
b) I and III
c) II and III
d) I, II, and III
e) none of the above gives the correct set of true statements
A
The proportion of scores in a standard Normal Distribution that are greater than 1.25 is closest to...
a) .1056
b) .1151
c) .1600
d) .8849
e) .8944
C
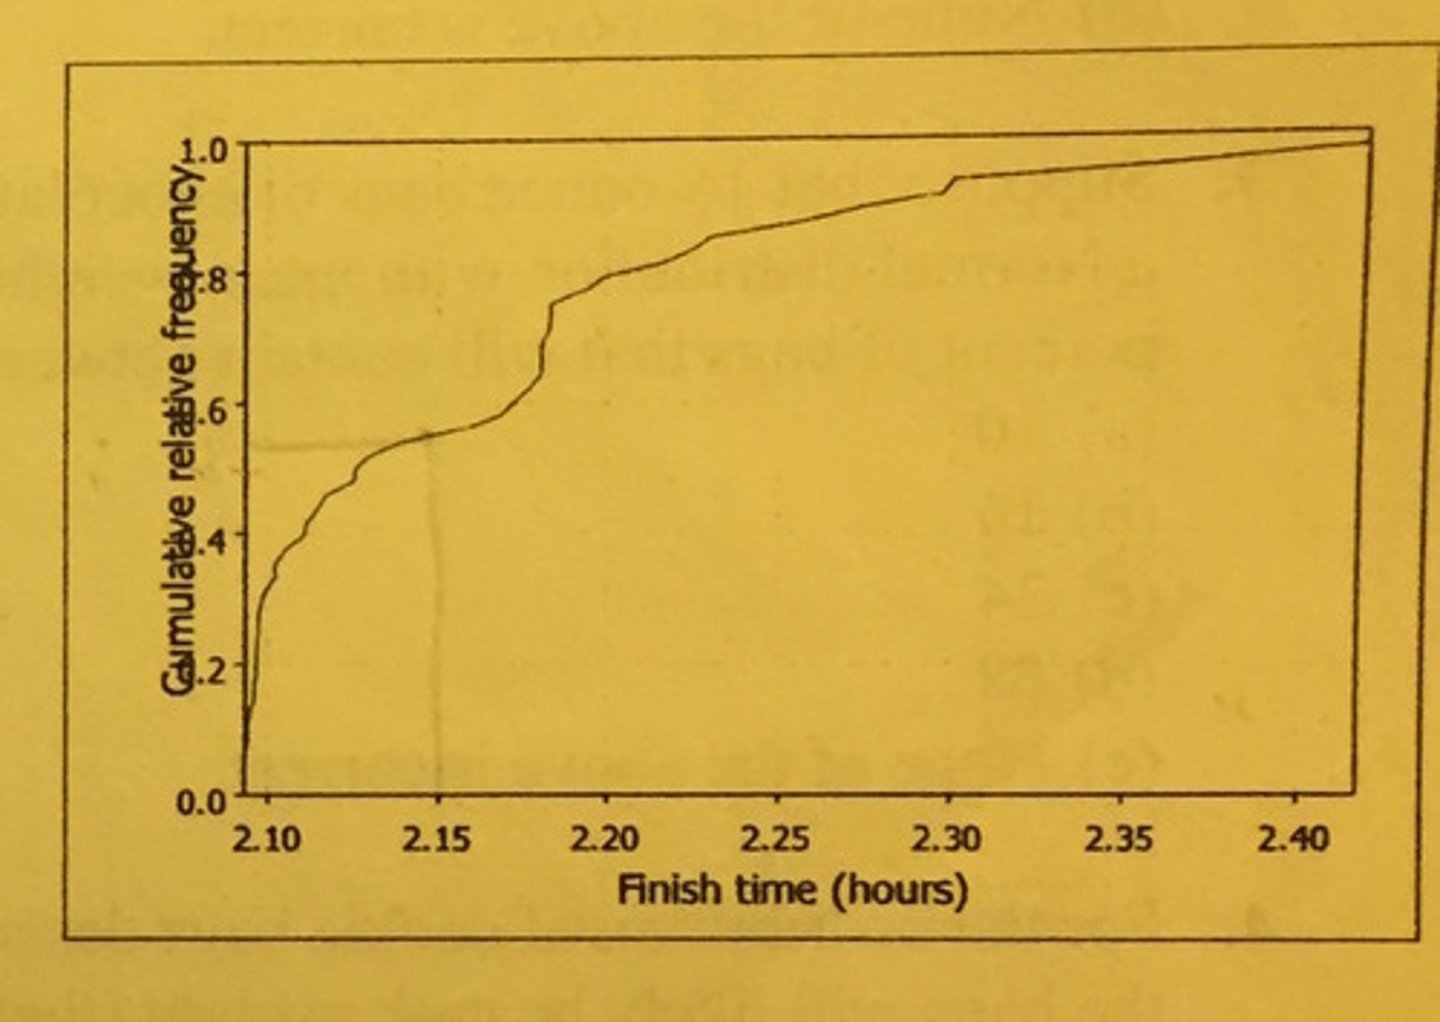
At right is a cumulative relative frequency graph for the 48 racers who finished the grueling 50km cross-country ski race at the 2010 Vancouver Olympics. Approximately what proportion of the racers finished the race in MORE than 2.15 hours?
a) .17
b) .4
c) .45
d) .5
e) .55
D
PREVIOUS QUESTION: (*At right is a cumulative relative frequency graph for the 48 racers who finished the grueling 50km cross-country ski race at the 2010 Vancouver Olympics. Approximately what proportion of the racers finished the race in MORE than 2.15 hours?*)
*see picture for graph*
In the previous question, the mean finish time is 2.164 hours and the standard deviation is 0.85 hours. The distribution is skewed right. What are the mean, standard deviation, and shape of the distribution of z-scores of the same data?
a) Mean = 2.164, Standard deviation = 0.85, skewed right
b) Mean = 2.164, Standard deviation = 0.85, skewed left
c) Mean = 2.164, Standard deviation = 0.85, approximately normal
d) Mean = 0, Standard deviation = 1, skewed right
e) Mean = 0, Standard deviation = 1, approximately normal
B
10. Kitchen appliances don't last forever. The lifespan of all microwave ovens sold in the United States is approximately Normally distributed with a mean of 9 years and a standard deviation of 2.5 years. What percentage of the ovens last more than 10 years?
a) 11.5%
b) 34.5%
c) 65.5%
d) 69%
e) 84.5%
C
In a test of Ho: p = 0.7 against Ha: p ≠ 0.7, a sample of size 80 produces z = 0.8 for the value of the test statistic. Which of the following is closest to the P-value of the test?
(a) 0.2090
(b) 0.2119
(c) 0.4238
(d) 0.4681
(e) 0.7881
A
An opinion poll asks a simple random sample of 100 college seniors how they view their job prospects. In all, 53 say "good." Does the poll give convincing evidence to conclude that more than half of all seniors think their job prospects are good? If p = the proportion of all college seniors who say their job prospects are good, what are the hypotheses for a test to answer this question?
(a) Ho: p = 0.5; Ha: p > 0.5
(b) Ho: p > 0.5; Ha: p = 0.5
(c) Ho: p = 0.5; Ha: p ≠ 0.5
(d) Ho: p = 0.5; Ha: p < 0.5
(e) Ho: p ≠ 0.5; Ha: p > 0.5
D
In a test of Ho: μ = 100 against Ha: μ ≠ 100, a sample of size 10 produces a sample mean of 103 and a P-value of 0.08. Which of the following is true at the 0.05 level of significance?
(a) There is sufficient evidence to conclude that μ ≠ 100
(b) There is sufficient evidence to conclude that μ = 100
(c) There is insufficient evidence to conclude that μ = 100
(d) There is insufficient evidence to conclude that μ ≠ 100
(e) There is sufficient evidence to conclude that μ > 103
B
Which of the following is not a required condition for performing a t-test about an unknown population mean μ?
(a) The data can be viewed as a simple random sample from the population of interest
(b) The population standard deviation σ is known
(c) The population distribution is Normal or the sample size is large (say n > 30)
(d) The data represent n independent observations
(e) All four of the above are required conditions
B
An appropriate 95% confidence interval for μ has been calculated as (-0.73, 1.92) based on n = 15 observations from a population with a Normal distribution. If we wish to use this confidence interval to test the hypothesis Ho: μ = 0 against Ha: μ ≠ 0, which of the following is a legitimate conclusion?
(a) Reject Ho at the α = 0.05 level of significance
(b) Fail to reject Ho at the α = 0.05 level of significance
(c) Reject Ho at the α = 0.10 level of significance
(d) Fail to reject Ho at the α = 0.10 level of significance
(e) We cannot perform the required test since we do not know the value of the test statistic
D
Which of the following increases the power of a significance test?
(a) Using a two-tailed test instead of a one-tailed test
(b) Decreasing the size of your sample
(c) Finding a way to increase the population standard deviation
(d) Increasing the significance level
(e) Decrease the effect size
D
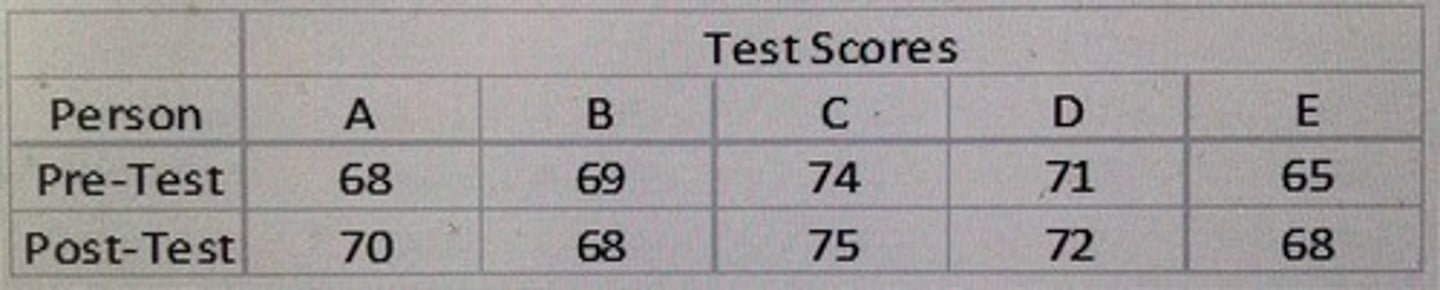
The infamous psychologist, Dr. Visegrips, claims that his secret sleep tapes cause people to become better at basic algebra. "All you have to do," the doctor explains, "is listen to my tapes while you sleep at night, and you'll be better at algebra in two months." A math teacher at a local high school has expressed interest but demands evidence. Five people are randomly selected from students at the school. They take an algebra skills test, listen to Dr. Visegrips' tape for two months while they sleep, and then take a second test. The test scores are as follows:
*SEE PICTURE*
Which of the following conditions must be met in order to use a t-procedure on these paired data?
(a) The distribution of both pre-test scores and post-test scores must be approximately Normal
(b) The distribution of pre-test scores and the distribution of differences (after - before) must be approximately Normal
(c) Only the distribution of pre-test scores must be approximately Normal
(d) Only the distribution of differences (after - before) must be approximately Normal
(e) All three distributions - before, after, and the difference - must be approximately Normal
A
Bags of a certain brand of tortilla chips claim to have a net weight of 14 ounces. Net weights actually vary slightly from bag to bag and are Normally distributed with mean μ. A representative of a consumer advocacy group wishes to see if there is any evidence that the mean net weight is less than advertised and so intends to test the hypotheses
Ho: μ = 14 Ha: μ < 14
A Type Ⅰerror in this situation would mean
(a) concluding that the bags are being under filled when they actually aren't
(b) concluding that the bags are being under filled when they actually are
(c) concluding that the bags are not being under filled when they actually are
(d) concluding that the bags are not being under filled when they actually aren't
(e) none of these
E
A medical researcher is working on a new treatment for a certain type of cancer. After diagnosis, the average survival time on the standard treatment is two years. In an early trial, she tries the new treatment on five subjects and finds that they have an average survival time of four years after diagnosis. Although the survival time has doubled, the results of a t-test for mean survival time are not statistically significant even at the 0.10 significance level. Which of the following is the best course of action for the researcher?
(a) Since the test was not statistically significant, she should abandon study of this treatment and move on to more promising ones
(b) She should reexamine her computations - it is likely that she made an error
(c) She should increase the significance level of her test so that she rejects the null hypothesis, since the treatment clearly has a positive impact
(d) She should use a z-test instead of a t-test
(e) She should expand her research program to include more subjects - this was a very small sample
E
You are testing the hypothesis that a new method for freezing green beans preserves more vitamin C in the beans than the conventional freezing method. Beans frozen by the conventional methods are known to have a mean Vitamin C level of 12 mg per serving, so you are testing beans frozen using the new method. You calculate that the power of the test against the alternative Ha: μ = 13.5 is 0.75. Which of the following is the best interpretation of this value?
(a) The complement of the probability of making a Type Ⅰerror
(b) The probability of concluding that the true mean is 12 mg/serving when it is actually 13.5 mg/serving
(c) The probability of concluding that the true mean is higher than 12 mg/serving when it is actually 12 mg/serving
(d) The probability of concluding that the true mean is 13.5 mg/serving when it is actually 12 mg/serving
(e) The probability of concluding that the true mean is higher than 12 mg/serving when it is actually 13.5 mg/serving
A
A significance test was performed to test the null hypothesis Ho: p = 0.5 versus the alternative Ha: p > 0.5. The test statistic is z = 1.40. Which of the following is closest to the P-value for this test?
(a) 0.0808
(b) 0.1492
(c) 0.1616
(d) 0.2984
(e) 0.9192