topic 3
0.0(0)
Studied by 0 peopleCard Sorting
1/35
Earn XP
Description and Tags
Last updated 3:51 AM on 10/5/22
Name | Mastery | Learn | Test | Matching | Spaced | Call with Kai |
|---|
No analytics yet
Send a link to your students to track their progress
36 Terms
1
New cards
production function
relates the amount of inputs you use to the maximum amount of output you could make with those inputs
- example that can change the shape of this function: Technological process, innovation that would increase the production of workers retrieving more inventory
- example that can change the shape of this function: Technological process, innovation that would increase the production of workers retrieving more inventory
2
New cards
production function model
Y=f(K,L): amount of output as a function of capital and labor
3
New cards
diminishing return to labor
amount of extra sandwiches you'd get when extra units of labor would be smaller when you have more labor
4
New cards
constant return to scale
if you scaled up both inputs, labor to bread, by the same factor you'd get exactly that factor more sandwiches in extra output
5
New cards
product maximizing
marginal revenue (MR) = marginal cost (MC)
6
New cards
Marginal Revenue
price (P)
- the additional revenue the firm makes by selling one more unit of output
- the additional revenue the firm makes by selling one more unit of output
7
New cards
short run
doesn't take into account fixed costs
- can't say if profitable
- when at least one output must be used in a fixed amount
- can't say if profitable
- when at least one output must be used in a fixed amount
8
New cards
average cost (AC)
C(Q)/ Q or total cost i incur(includes fixed costs)/ the total amount of output i produce (quantity)
9
New cards
profit (max) formula
π= Revenue (R) - Cost (C)
10
New cards
variable cost
depends on what is produced
11
New cards
fixed cost
does not change
- constant costs that must be paid by the producer regardless of how much output is produced
- constant costs that must be paid by the producer regardless of how much output is produced
12
New cards
cost function
C(Q)
13
New cards
Quantity
Q
14
New cards
returns to scale
a long-run concept about what happens when we scale up all input in the same proportion
15
New cards
Marginal Cost (MC)
the additional cost the firm faces by producing one more unit of output
- DOESN"T INCLUDE FIXED COSTS
- DOESN"T INCLUDE FIXED COSTS
16
New cards
long run
defined as the time when all inputs can be varied
- number of firms may VARY
- number of firms may VARY
17
New cards
price taking:
each player in the market is sufficiently small that its quantity choices don't influence the market price
18
New cards
identical firms, homogenous goods
firm sells identical goods
19
New cards
perfect information
all players in the market know what the good is and its price
20
New cards
free entry and exit in the long run
firms are allowed to enter and leave the industry at will, given enough time to start up and wind down
21
New cards
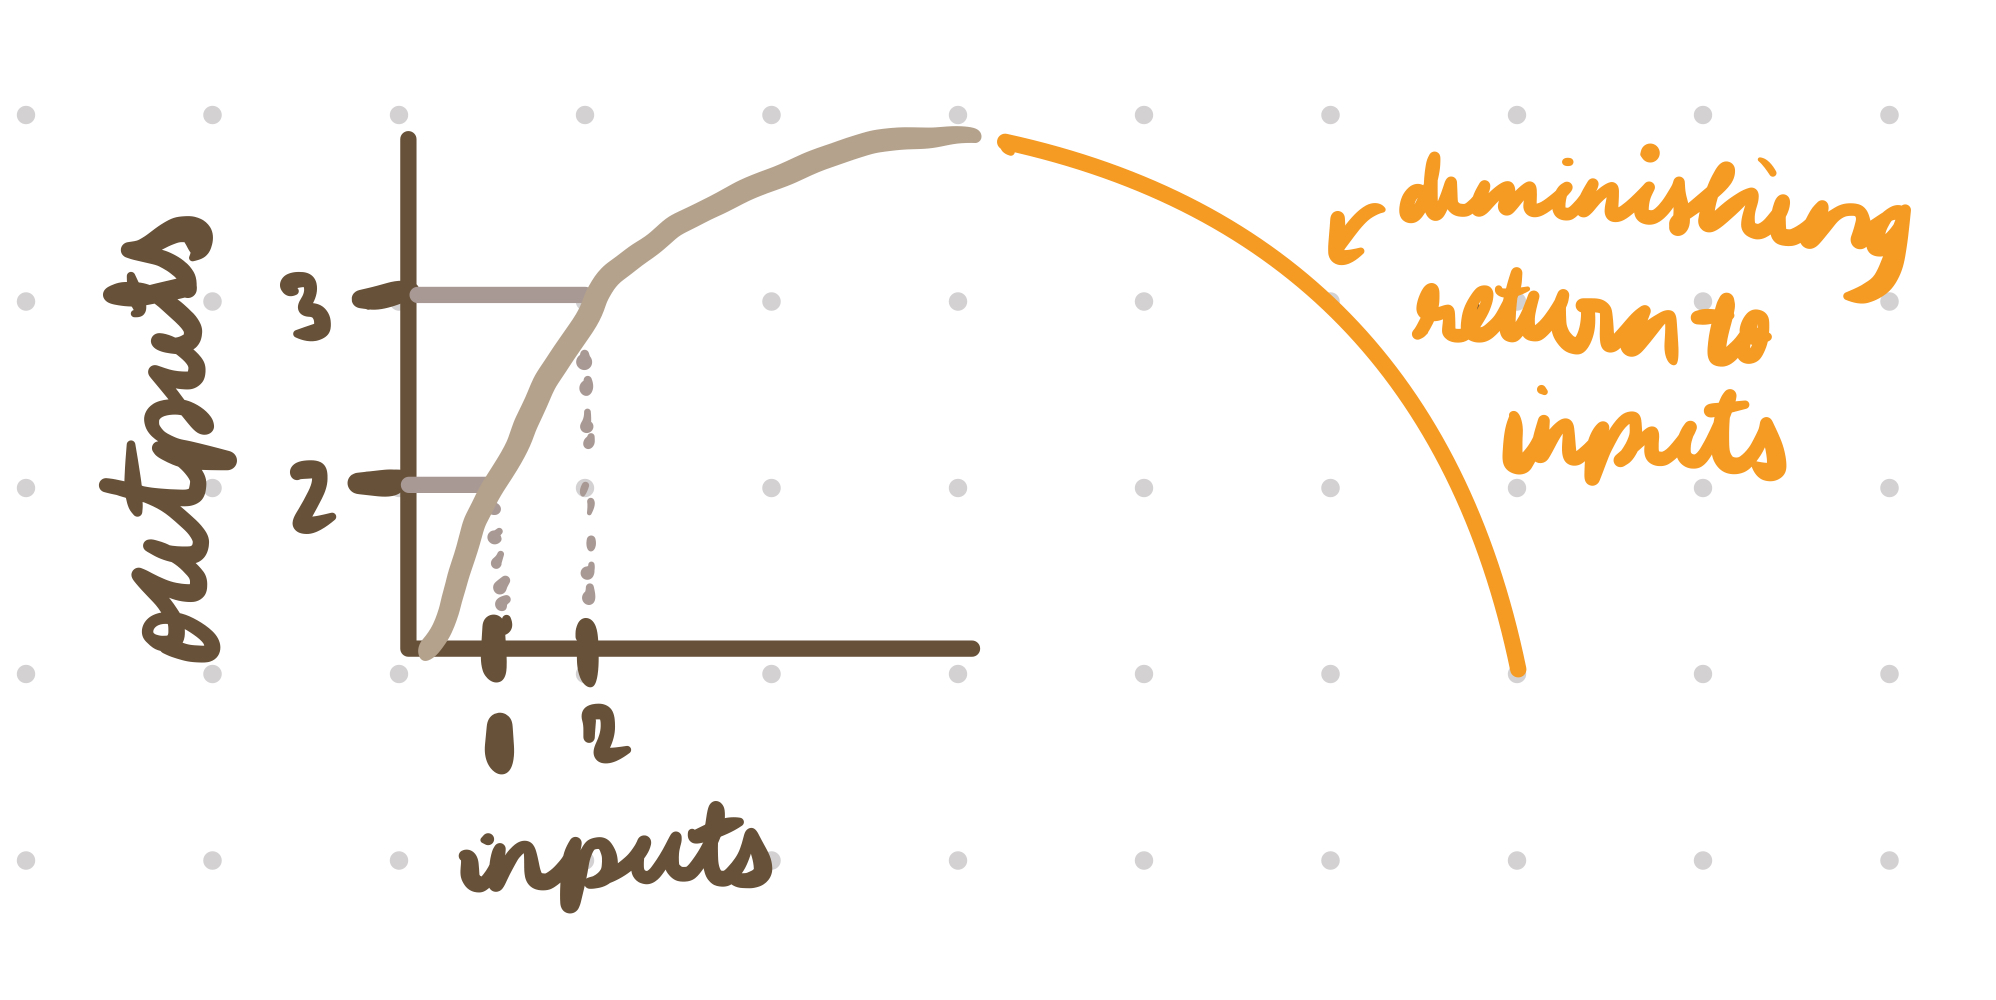
production function graph
see graph
22
New cards
the profit maximizing firm should produce up to the point where the extra cost to produce the next unit is more than the price it can be sold for, since them they'd lose money on that unit.
OR
they should keep producing more only as long as the extra revenue they'd get from producing the next unit exceeds the cost of producing it
OR
they should keep producing more only as long as the extra revenue they'd get from producing the next unit exceeds the cost of producing it
for a profit- maximizing firm, what idea does it capture?
23
New cards
there's no other production quantity that would be more profitable than a positive Q or less profitable than a negative Q
by finding quantity produced (Q), what do we find?
24
New cards
1. x-axis: Quantity y-axis price/cost
2. plot your given points (if MC= (ex: 5+3Q), plot like y=mx+b (making y-int = 5 & 3q positive )
3. plot Q straight
4. plot price floor
5. graph the Average Cost curve that intersects MC at the lowest point of AC and that at the optimal quantity p >AC, consistent with the statement that the firm makes positive economic profit
sketch a diagram for marginal cost and price (MR)
25
New cards
price>Average cost
- in long run, expect new firms to enter this industry due to free entry from positive economic profit
- price would have to fall because of the new firms that would result in the aggregate supply curve to shift right which would lead to the equilibrium price to fall until each firm that remains is making 0 economic profit
positive economic profit (what would that look like)
long run?
long run?
26
New cards
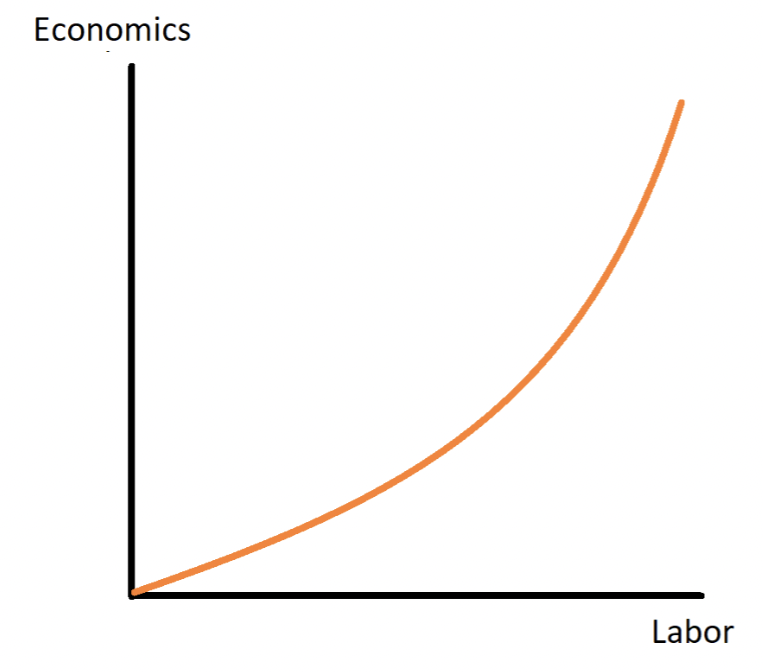
firms produces the output economics' using a single input "labor" and the production function for his operation has increasing returns to labor
rate at which output increases as we add more labor is accelerating. each subsequent unit of labor brings a larger marginal increase in output than the last
27
New cards
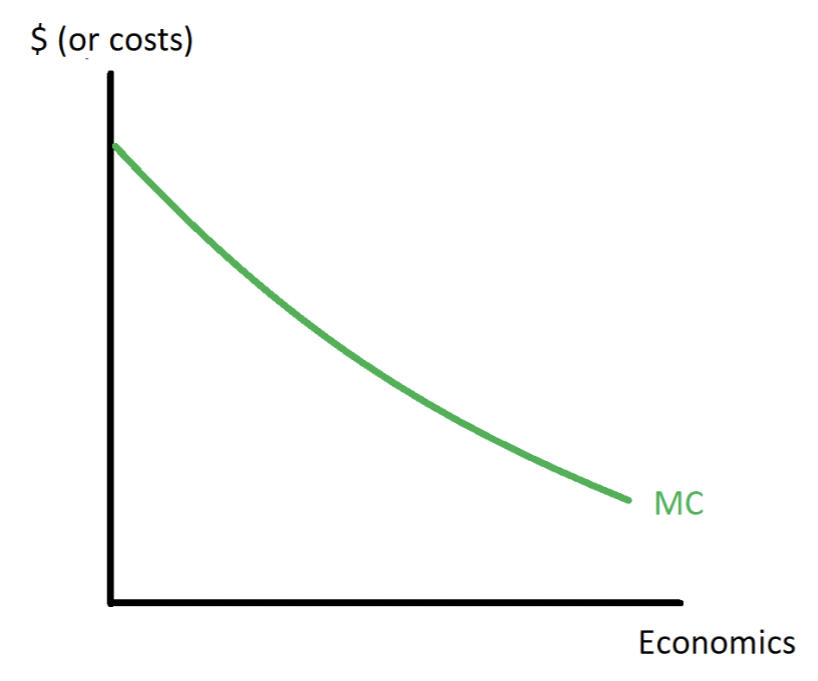
the price per unit of labor is constant for the firm
- each extra unit of economics takes less labor to produce that the one before, since the returns to labor are increasing.
- each extra unit of economics takes less labor to produce that the one before, since the returns to labor are increasing.
see graph
28
New cards
the extra cost to hire the extra inputs to produce each subsequent unit of economics is getting lower and lower
what does it mean for the price of labor to be constant?
29
New cards
100 because the fixed cost isn't affected by quantity
what is the fixed cost from the total cost:C = 100+5Q
30
New cards
average variable cost
the non fixed part of cost, divided by Q
31
New cards
Total Cost
total amount that the producer has to spend to produce a Q units of output
32
New cards
1. MR=MC
2. remember P = MR
3. solve for Q for the optimal choice
4. find average cost (C/Q)
5. find average variable cost (non-fixed part of cost)/Q)
6. compare the Price (P) to Average variable cost and average cost... what does that tell you
7. what is the final consensus (negative or positive profit)
8. optimal choice for short run? long run??
how do you find the producer's profit maximizing choice of output in the short run and in the long run?
33
New cards
price taker
their actions alone have no influence on the market price, so they take the price as fixed and given
34
New cards
revenue
price (p) - quantity (Q*)
35
New cards
exit reduced the number of producers in the industry, which causes the price in the industry to rise, making the remaining producers more profitable.
- rise in prices= exit pushes the supply curve left, raising the equilibrium
- rise in prices= exit pushes the supply curve left, raising the equilibrium
how does exit affect the supply and demand curve
36
New cards
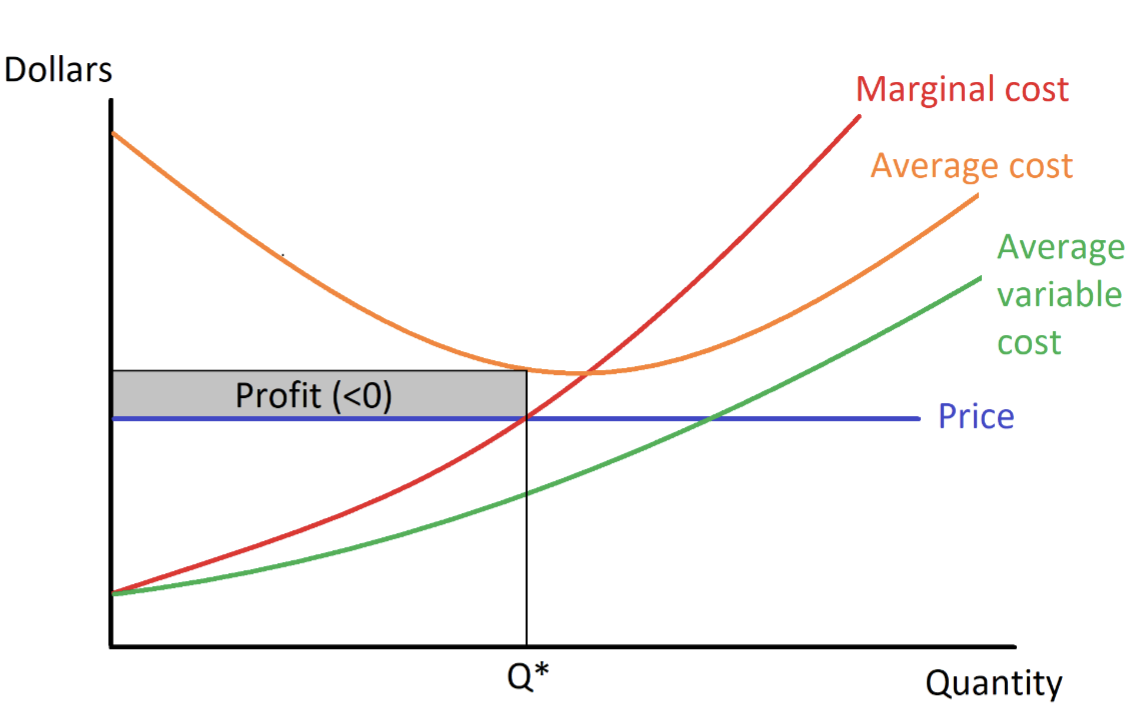
- optimal choice of output= p=MC
- area between, price and average cost
- negative because at the optimal choice of output, cost per unit produced (average cost) exceeds the price received per unit produced
- area between, price and average cost
- negative because at the optimal choice of output, cost per unit produced (average cost) exceeds the price received per unit produced
explain this graph
- where is the optimal choice of output
- where is the area that represents profit
- positive or negative profit?
- where is the optimal choice of output
- where is the area that represents profit
- positive or negative profit?