PSYCHSTATS REVIEWER FOR CVSU QUALIFYING
0.0(0)
Studied by 7 peopleCard Sorting
1/113
There's no tags or description
Looks like no tags are added yet.
Last updated 7:19 AM on 7/1/25
Name | Mastery | Learn | Test | Matching | Spaced | Call with Kai |
|---|
No analytics yet
Send a link to your students to track their progress
114 Terms
1
New cards
STATISTICS
A branch of mathematics which deals with the collection, organization, presentation, analysis and interpretation of numerical data for the purpose of assisting in making a more effective decision
2
New cards
data
STATISTICS Synonymous with the word _____?
3
New cards
DESCRIPTIVE STATISTICS
Includes the methods of collecting, classifying, graphing, and averaging the data.
The objective is simply describing and summarizing the important features, properties or characteristics of the data on hand without attempting to give inference
The objective is simply describing and summarizing the important features, properties or characteristics of the data on hand without attempting to give inference
4
New cards
INFERENTIAL STATISTICS
Demands a higher order of critical judgment and mathematical methods.
The main concern is to analyze the organize data leading to prediction of inferences.
The area of _________ called hypothesis testing is a decision-making process for evaluating the statements about a population, based on the information gathered from the samples
The main concern is to analyze the organize data leading to prediction of inferences.
The area of _________ called hypothesis testing is a decision-making process for evaluating the statements about a population, based on the information gathered from the samples
5
New cards
VARIABLES
A characteristic or attribute of persons or objects which assume different values for different objects under consideration. Factors that can be manipulated and measured.
6
New cards
MEASUREMENT
The process of determining the value or label of a particular variable for a particular individual or object on which variable is measured.
7
New cards
DISCRETE
Can assume finite or at most, countable infinite number of values; usually measured by counting or enumeration.
Eg. students, professors, psychologists, parents.
Eg. students, professors, psychologists, parents.
8
New cards
CONTINUOUS
Those that cannot be counted because of their distinct division.
“abstract variables”
Can assume values corresponding to a line of interval.
Eg. intelligence, beauty, effectiveness, cleanliness
“abstract variables”
Can assume values corresponding to a line of interval.
Eg. intelligence, beauty, effectiveness, cleanliness
9
New cards
QUALITATIVE
Can give categorical responses.
Eg. occupation, gender, civil status, religious.
Eg. occupation, gender, civil status, religious.
10
New cards
QUANTITATIVE
Takes on numerical values representing an amount or quantity.
Eg. height, salary, number of children, weight
Eg. height, salary, number of children, weight
11
New cards
DEPENDENT
Measures based on the effect of the independent variables.
“outcome variable”
“outcome variable”
12
New cards
INDEPENDENT
Variables that the researcher controls or manipulate in accordance with the purpose of the investigation.
13
New cards
UNIVARIABLE
There is only one variable involved.
Eg. Age of Grade 7 pupils.
Eg. Age of Grade 7 pupils.
14
New cards
BIVARIABLE
Data are classified on the basis of two variables.
Eg. An ice cream shop keeps track of how much ice cream they sell versus the temperature of the day.
Eg. An ice cream shop keeps track of how much ice cream they sell versus the temperature of the day.
15
New cards
MULTIVARIABLE
Each datum belongs to three or more variables.
Eg. The teacher would like to keep track the enrolment in the College in terms of program, year level and gender.
Eg. The teacher would like to keep track the enrolment in the College in terms of program, year level and gender.
16
New cards
Discrete and Continuous Variables, Qualitative and Quantitative Variables, Dependent and Independent Variables, Univariable, Bivariable and Multivariable Distribution
CLASSIFICATION OF VARIABLES
17
New cards
NOMINAL SCALE, ORDINAL SCALE, INTERVAL SCALE, RATIO SCALE
LEVELS OF MEASUREMENT
18
New cards
NOMINAL SCALE
Has no numerical value. “categorical scales”
19
New cards
ORDINAL SCALE
Not only **classifies subjects** but also **ranks** them in terms of the degree to which they posses a characteristics of interest.
20
New cards
INTERVAL SCALE
Has all the characteristics of a nominal and an ordinal scale but it is based upon predetermined equal intervals.
**Does not have true zero point.**
**Does not have true zero point.**
21
New cards
RATIO SCALE
Represents the highest, most precise level of measurement.
**Has a meaningful true zero point.**
**Has a meaningful true zero point.**
22
New cards
POPULATION
The total or entire group of individuals, events, objects, observations, reactions to certain stimuli that have unique patterns of qualities and from which information is desired by the researcher.
“the universe”
“the universe”
23
New cards
SAMPLE
A portion or subset of the population used to gather information from the population.
Truly represents the unique qualities or characteristics of the population.
Truly represents the unique qualities or characteristics of the population.
24
New cards
Identify data source (population), Select sample type, Choose sample size.
ESSENTIAL STEPS IN DETERMINING THE SAMPLE SIZE
25
New cards
Reliable studies connect, assess treatment success, guide data collection, aid understanding, draw conclusions, predict outcomes, statistics everywhere.
IMPORTANCE OF STATISTICS IN PSYCHOLOGY
26
New cards
n = N / (1+Ne^2)
Slovin’s Formula
27
New cards
n
sample size
28
New cards
N
population
29
New cards
e
estimated margin of error (acceptable error)
30
New cards
PARAMETERS
Measures of the population or numerical characteristics of the population.
“μ”
“μ”
31
New cards
PROBABILITY SAMPLING
A sampling process where each unit in the population has known nonzero probability of being included in the sample.
Most unbiased but difficult method.
Most unbiased but difficult method.
32
New cards
SIMPLE RANDOM SAMPLING
The sample will be chosen randomly and each member in the population will have an equal chance of being selected.
33
New cards
STRATIFIED RANDOM SAMPLING
The samples are randomly selected from the different groups or sections of the population used in the study.
34
New cards
SYSTEMATIC RANDOM SAMPLING
The method where every k th name in the list of the population members can be selected as part of the sample.
\
K = N/n
\
K = N/n
35
New cards
CLUSTER SAMPLING
The researcher identifies convenient, naturally occurring group units.
Unlike strata, it is advisable to form clusters with heterogeneous components.
Unlike strata, it is advisable to form clusters with heterogeneous components.
36
New cards
MULTI-STAGE SAMPLING
Used when the respondents of the study are scattered all over a big geographical area such as for national, regional, provincial or country level studies.
Involves several stages in drawing the samples from the population.
Involves several stages in drawing the samples from the population.
37
New cards
NON-PROBABILITY SAMPLING
A sampling process wherein probabilities of selection are not specified for the individual units in the population. When the researcher is not after generalizing the results of the study to the population or universe
38
New cards
Define the population. Cluster the population. Randomly select clusters. Randomly sample units within selected clusters.
MULTI-STAGE SAMPLING STAGES
39
New cards
NON-PROBABILITY SAMPLING
A sampling process wherein probabilities of selection are not specified for the individual units in the population. When the researcher is not after generalizing the results of the study to the population or universe
40
New cards
PURPOSIVE SAMPLING
The researcher selects those who can best help explain or give information based on his judgment.
“judgmental sampling”
“judgmental sampling”
41
New cards
CONVENIENCE SAMPLING
The researcher selects respondents who are available at the time and place the data is to be collected.
“haphazard or incidental sampling”
“haphazard or incidental sampling”
42
New cards
QUOTA SAMPLING
To come up with the desired number of samples no matter how they are selected.
43
New cards
SNOWBALL SAMPLING
Used when respondents are difficult to identify and best located through referral networks.
44
New cards
RESEARCH DESIGN
The researcher’s plan for selecting respondents, research locale and data gathering procedures to answer research questions systematically
45
New cards
ACTION RESEARCH
When the researcher is interested in finding out whether something will work or problem solving in local setting.
46
New cards
DESCRIPTIVE RESEARCH
Used when the researcher’s concern is to understand the nature, characteristics, components or aspects of a situation or phenomenon
47
New cards
EXPLANATORY RESEARCH
Used to explain and predict relationships between 2 or more variables.
Uncovering data on unknown phenomena
Uncovering data on unknown phenomena
48
New cards
CORRELATIONAL RESEARCH
When the researcher is after uncovering data on a phenomenon little is known about
49
New cards
EVALUATION RESEARCH
Appropriate when the researcher plans to assess the impact, effect, result, or outcome of operations, policies and programs.
50
New cards
POLICY RESEARCH
When the researcher is concerned about generating information relevant to the development and formulation of policy and the assessment of the effect of such policy.
51
New cards
EX-POST FACTO RESEARCH
When the researcher is after observing existing conditions and looking back through the data for plausible causal factors.
“causal comparative research”
“causal comparative research”
52
New cards
HISTORICAL RESEARCH
When the researcher is attempting to solve certain problems arising out of historical context through the gathering and examining relevant data from the past
53
New cards
ETHNOGRAPHIC RESEARCH
To come up with a holistic description of phenomenon or situation with the use of multiple data collection techniques.
54
New cards
PHENOMENOLOGICAL RESEARCH
Interprets an experience or fact, by listening to the different stories of the participants.
55
New cards
FREQUENCY DISTRIBUTION
An organized tabulation of the number of individuals located in different categories in different levels of measurements.
This is used to group scores together in order which would allow the researcher in a glance the set of scores.
This is used to group scores together in order which would allow the researcher in a glance the set of scores.
56
New cards
NORMAL CURVE
A bell-shaped, smooth, mathematically defined curve that is highest at its center.
57
New cards
SKEWNESS
The nature and extent to which symmetry is absent.
An indication of how the measurements in a distribution are distributed.
An indication of how the measurements in a distribution are distributed.
58
New cards
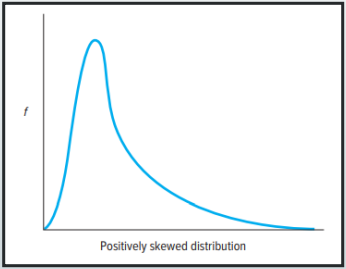
POSITIVE SKEW (LEFT)
When relatively few of the scores fall at the high end of the distribution. (LEFT)
59
New cards
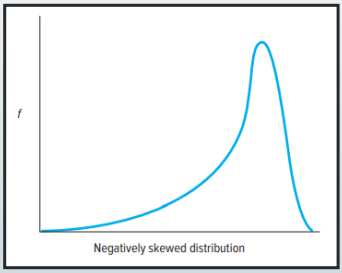
NEGATIVE SKEW (RIGHT)
When relatively few of the scores fall at the low end of the distribution. (RIGHT)
60
New cards

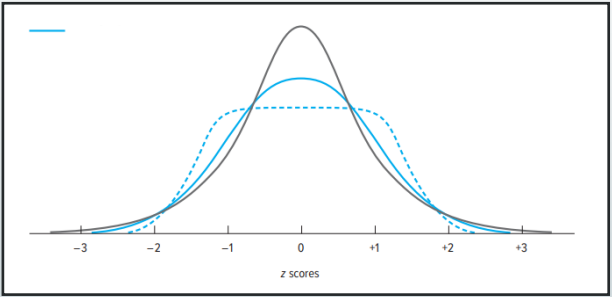
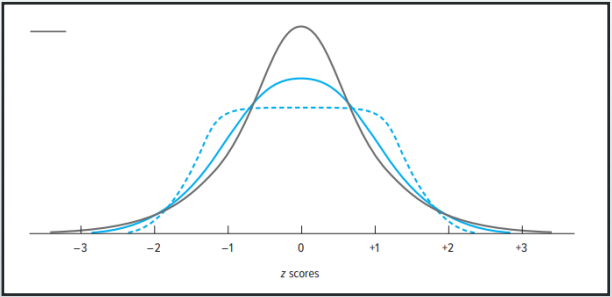
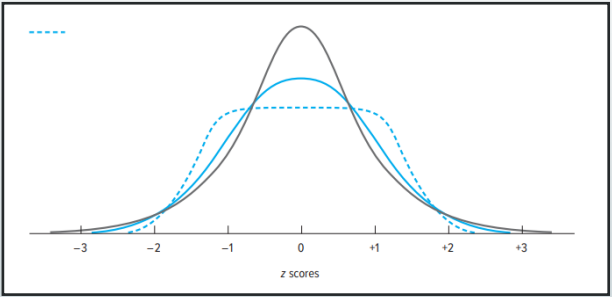
KURTOSIS
The steepness of a distribution in its center.
61
New cards
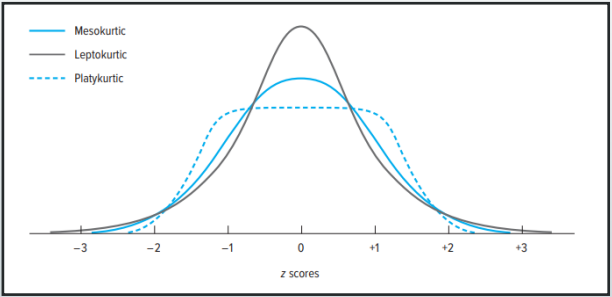
Mesokurtic
When the kurtosis is zero, the distribution has a normal or Gaussian shape, and it is called ________.
62
New cards

Leptokurtic
If the kurtosis is positive, the distribution has heavier tails and a sharper peak compared to the normal distribution, and it is called _______.
63
New cards

Platykurtic
If the kurtosis is negative, the distribution has lighter tails and a flatter peak compared to the normal distribution, and it is called _______.
64
New cards
MEASURE OF CENTRAL TENDENCY
A statistic that indicates the average or midmost score between the extreme scores in a distribution.
65
New cards
ARITHMETIC MEAN
Equal to the sum of the observations divided by the number of observations.
66
New cards
Mean = Σ(fX) / n
formula for MEAN
67
New cards
MEDIAN
The middle score in a distribution.
68
New cards
MODE
The most frequently occurring score in a distribution of scores.
69
New cards
PERCENTILES
Indicate the values below which a certain percentage of the data in a data set is found.
70
New cards
Px = (x (n+1)) / 100
percentiles formula
71
New cards
RANGE
Equal to the difference between the highest and the lowest scores.
Example:
HS – 60
LS – 40
Range = 20
Example:
HS – 60
LS – 40
Range = 20
72
New cards
VARIANCE
Equal to the arithmetic mean of the squares of the differences between the scores in a distribution and their mean.
73
New cards
STANDARD DEVIATION
Equal to the square root of the average squared deviations about the mean.
Equal to the square root of the variance.
Equal to the square root of the variance.
74
New cards
square root of the variance.
A raw score that has been converted from one scale to another scale, where the latter scale has some arbitrarily set mean and standard deviation.
75
New cards
Z SCORE
Results from the conversion of a raw score into a number indicating how many standard deviation units the raw score is below or above the mean of the distribution.
76
New cards
T SCORE
A scale with a mean set at 50 and a standard deviation set at 10.
None of the scores is negative.
None of the scores is negative.
77
New cards
T = (z x 10) + 50
T-score formula
78
New cards
HYPOTHESIS
A generally considered most important instrument in research.
An assumption or a supposition which has to be proved or disproved.
A formal question that a researcher has to resolve
An assumption or a supposition which has to be proved or disproved.
A formal question that a researcher has to resolve
79
New cards
Clear and precise, Testable, Relates to a variable, Specific and limited in scope, Simple terms, Consistent with known facts, Testable within a reasonable time, Explains crucial phenomena
CHARACTERISTICS OF A HYPOTHESIS
80
New cards
NULL HYPOTHESES and ALTERNATE HYPOTHESES
Based on their formulation
81
New cards
DIRECTIONAL HYPOTHESES and NON- DIRECTIONAL HYPOTHESES
Based on direction
82
New cards
INDUCTIVE HYPOTHESES and DEDUCTIVE HYPOTHESES
Based on their derivation
83
New cards
NULL HYPOTHESIS
States that independent variable has no effect and there will be no difference between the two groups. Similar to the notion of innocent until proven guilty
84
New cards
ALTERNATIVE HYPOTHESIS
The hypothesis that the researcher is trying to prove and states that independent variable has an effect and there will be a difference between the two groups.
85
New cards
DIRECTIONAL HYPOTHESIS
It predicts that there will be a difference between the two groups and it specifies how the two groups will differ. Using comparison terms such as “greater,” “less,” or “worse.”
86
New cards
NON-DIRECTIONAL HYPOTHESIS
If the hypothesis simply predicts that there will be a difference between the two groups.
It predicts that there will be a difference but does not specify how the groups will differ
It predicts that there will be a difference but does not specify how the groups will differ
87
New cards
DEDUCTIVE HYPOTHESIS
Aims at testing a theory, Moves from broad generalizations to specific observations.
88
New cards
Correct decision
Ho is true, Accept Ho
89
New cards
Type II Error (β)
Ho is false, Accept Ho
90
New cards
Correct decision
Ho is false, Reject Ho
91
New cards
Type I Error (α)
Ho is true, Reject Ho
92
New cards
TYPE I ERROR
Occurs when we reject the null hypothesis when it is true, designated by alpha (α). Ho is wrongly rejected. Often considered to be more serious, and therefore more important to avoid, than the other error.
93
New cards
TYPE II ERROR
Occurs when we accept the null hypothesis when it is false, designated by beta (β). Ho is not rejected when it is in fact false. Frequently due to sample sizes being too small.
94
New cards
ALPHA
Set at the beginning of the research and is the level to which the researcher wishes to limit the probability of making a Type I error. The area of the rejection region. Typical values are .05, .01, or .001.
95
New cards
P-VALUE
The probability of obtaining results at least as extreme as the observed results of a statistical hypothesis test, assuming that the null hypothesis is correct. A smaller p-value means that there is stronger evidence in favor of the alternative hypothesis.
96
New cards
No evidence against the null hypothesis.
P > 0.10
97
New cards
Weak evidence against the null hypothesis in favor of the alternative.
0\.05 < P < 0.10
98
New cards
Moderate evidence against the null hypothesis in favor of the alternative.
0\.0 < P < 0.05
99
New cards
Strong evidence against the null hypothesis in favor of the alternative
0\.001 < P < 0.01
100
New cards
Very strong evidence against the null hypothesis in favor of the alternative.
P < 0.001