MET q (MET 06) Displaying data
1/4
There's no tags or description
Looks like no tags are added yet.
Name | Mastery | Learn | Test | Matching | Spaced |
|---|
No study sessions yet.
5 Terms
Identify two things that can be displayed on a bar chart, with examples to illustrate your answer (2x2)
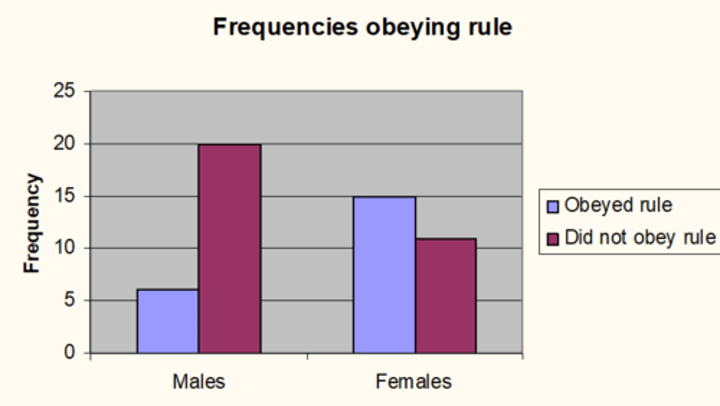
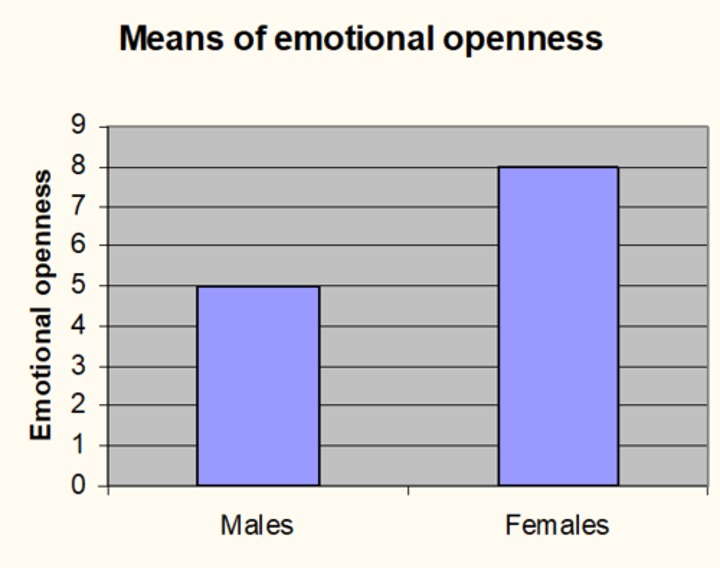
* Means of conditions / groups
* e.g., digit span capacity in young and old people
* Frequencies, in categories
* e.g., number of people in attachment categories
Identify what is on the x- axis and the y- axis on a bar chart of
(i) means
(ii) frequencies
(2x2)
(i) Means
* x = the 2 conditions / groups
* y = score
(ii) Frequencies
* x = the categories
* y = frequency
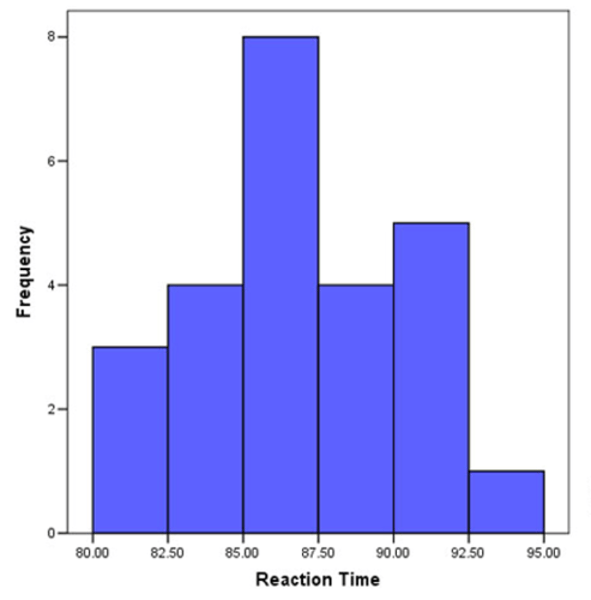
What is displayed on a histogram? (2)
* The distribution of a set of scores
* i.e., how many people got each score
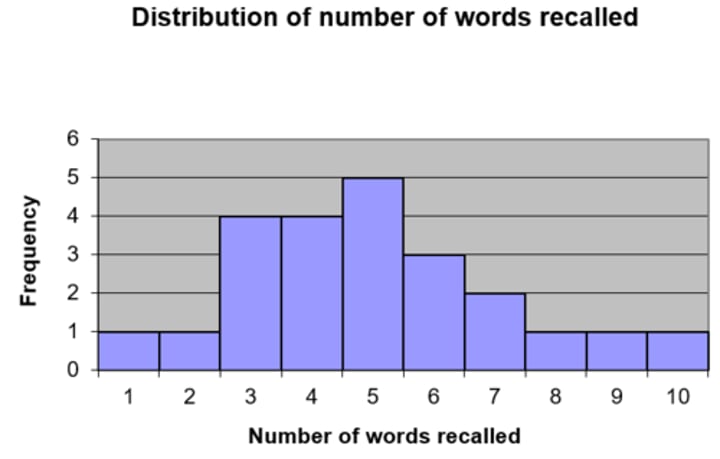
Identify what is on the x- axis and the y- axis on a histogram (2)
* x = scores
* y = frequencies
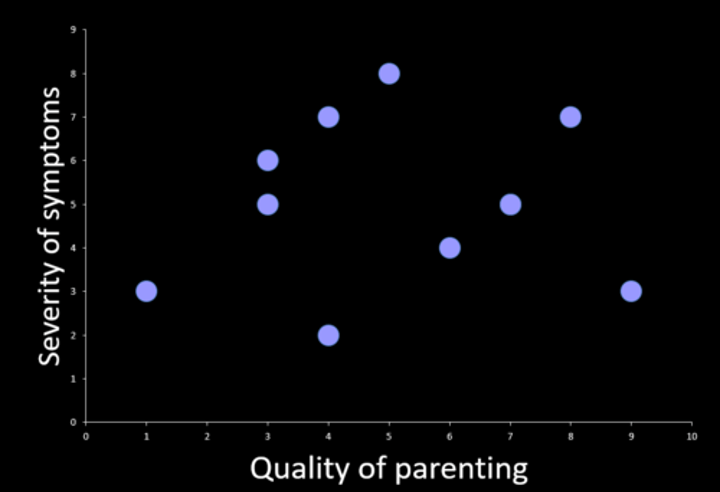
What is displayed on a scattergram and what is on each axis? (3)
* Correlation between scores
* x = covariable x
* y = covariable y