Kin 483-Ch.7 Correlation and Prediction
1/16
Earn XP
Description and Tags
Exam 2
Name | Mastery | Learn | Test | Matching | Spaced |
|---|
No study sessions yet.
17 Terms
Correlation (definition)
Numerical coefficient that indicates the relationship between 2 variables
Attributes of r
demonstrates a linear relationship
positive relationship
negative relationship
always between -1.0 and 1
value of 0 = no relationship
(±)0.3: low
(±)0.7: high
Positive relationship
as one variable increases, the other variable also increases (and vise versa)
direct relationship
ex: leg press and bench press weights both increase
Negative relationship
as one variable increases, the other variable decreases (and vise versa)
indirect relationship
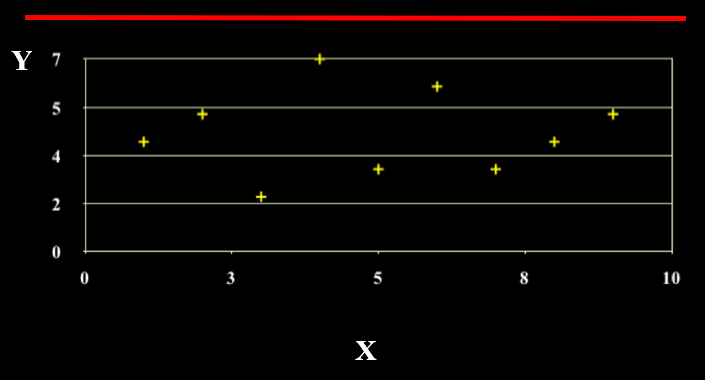
Scatterplot of zero correlation (r=0)
Correlation formula

SPSS and Correlation (Steps)
File —> Open —> Data (select data)
Analyze —> Correlate —> Bivariate
Choose variables you want to correlate
Correlation table formed!
Note:
strong correlation: >0.7
Significant two tail = p-value: statistical difference; accepted alpha in kinesiology is 0.05
Strong relationship is statistically significant
SPSS and Scatterplot (Steps)
Insert data
Graphs —> Scatter
Simple
Define
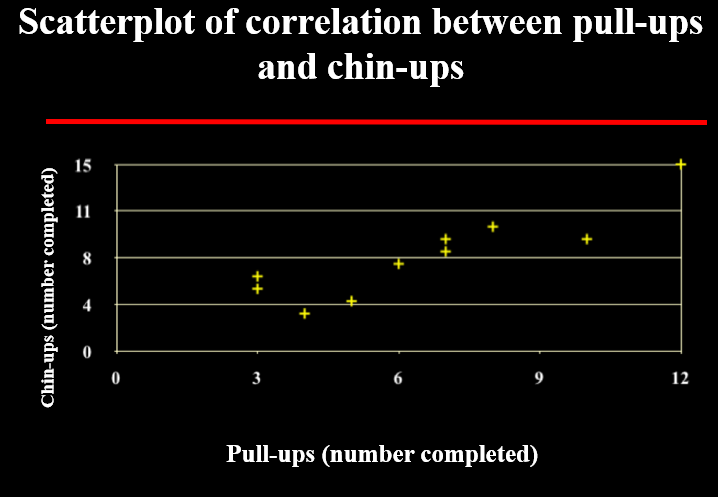
Put variable 1 (ex: body weight) in the x-axis box
Put variable 2 (ex: chin ups) in the y-axis box
click ok
Coefficient of Determination
Represents the proportion of shared variance between the 2 measures in question (r²)
Example:
Correlation between a distance run and VO2 max is r=0.9 (strong positive/direct relationship)
r² = 0.81, percentage of shared variance betw. 2 variables is 81%
performance in the distance run accounts for 81% of variation in VO2 max values
19% of the variance is unique variance in VO2 max that cannot be explained by the run test (error/residual variance)
Correlation issues
CORRELATION DOES NOT = CAUSATION!!!!
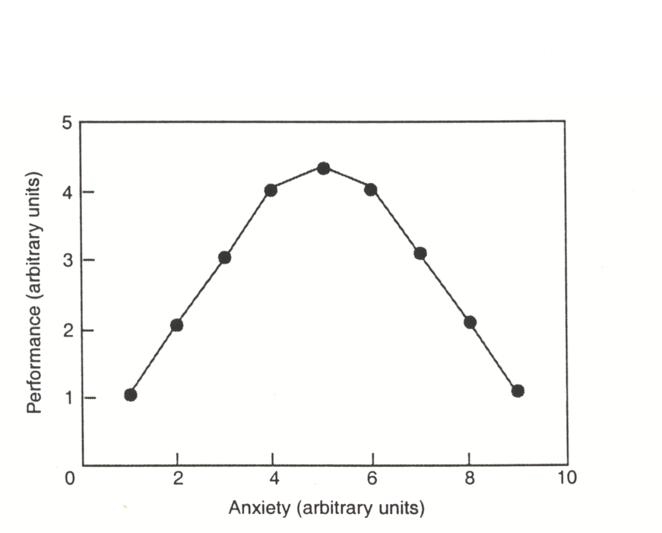
Limitations of r: Curvilinear or Linear
in this case, the Pearson Product Moment correlation would give an r close to zero (no relationship)
but isn’t there a relationship? this is where scatter plots come in
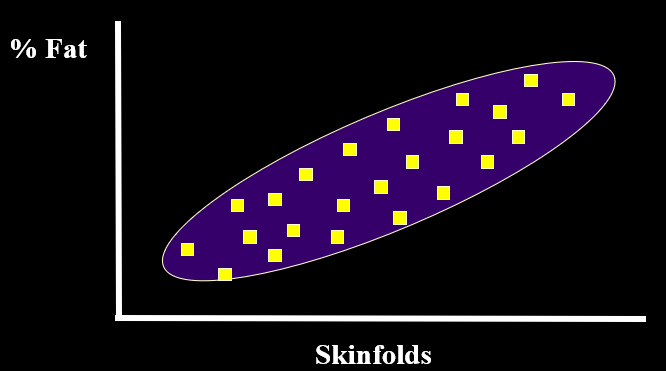
Correlation and Prediction
illustrates the positive correlation between skinfold thickness and percent fat
predict body fat % based on skin fold
Linear Regression (definition)
We can make predictions using Simple Linear Regression
An outcome variable (dependent variable can be predicted from a single predictor aka independent variable)
If both the dependent and independent variables are correlated we can compute a prediction equation
SPSS and Linear Regression (steps)
Import data
Analyze —> Regression —> Linear
Assign dependent and independent variables
Ok
Note:
First box: r value and r²
Second box: regression, degrees of freedom, SIG (p-value)
Third box: values to plug into y=mx+b
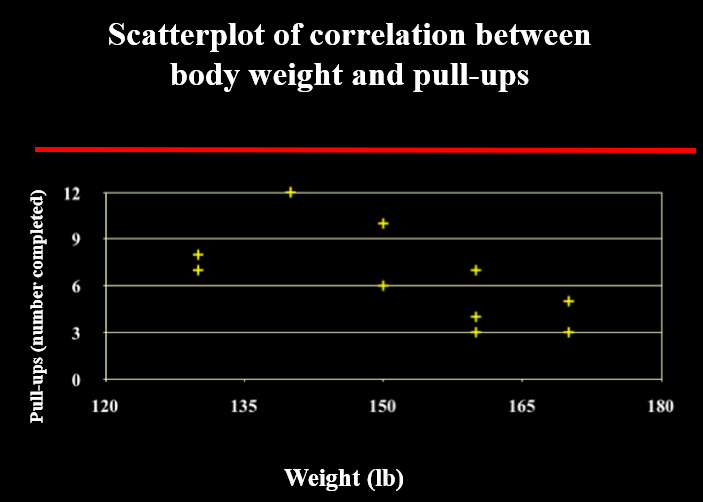
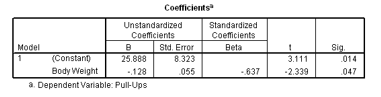
Prediction Formula
Y’=bX + c
Example: Predicted pull ups (Y’)=-0.128 * body weight (lbs) +25.88
Multiple Regression/Correlation
a single dependent variable (Y)
multiple independent variables
Y’=m1X1 + m2X2 +m3X3 + …b
an extension of simple correlation
3 Types of Multiple Regression
Standard Multiple Regression: 1 equation with all independent variables included
Hierarchical Multiple Regression: We override the computer and set up a hierarchical order for inclusion in variables; useful if some IV’s are easier to measure than others
Stepwise Multiple Regression: computer provides multiple equations with different combinations of IV’s