MCAT: Reasoning About The Design and Execution of Research
1/108
There's no tags or description
Looks like no tags are added yet.
Name | Mastery | Learn | Test | Matching | Spaced | Call with Kai |
|---|
No analytics yet
Send a link to your students to track their progress
109 Terms
Scientific Method
1. Generate a testable question
2. Gather data and resources
3. Form a hypothesis
4. Collect new data
5. Analyze the data
6. Interpret the data and existing hypothesis
7. Publish
8 Verify Results
FINER Method
1. Is the necessary research going to be feasible?
2. Do other scientists find this question interesting?
3. Is this particular question novel?
4. Would the study obey ethical principles?
5. Is the question relevant outside the scientific community?
Positive Controls
Those that ensure a change in the dependent variable when it is expected. Ex. Adding a drug to blood samples known to have HIV
Negative Controls
Ensure no change in the dependent variable when no change is expected. Ex. Adding a drug to blood samples known not to contain HIV
Vehicular Control
a study where for instance, you are studying a drug which must be administered in saline. For the vehicular control, you would treat them with the vehicle, which is the saline, while the experimental group would get the drug dissolved in the saline, to ensure the effects are not done to the vehicle alone. The group does what experimental group does but without directly desired impact
Placebo Effect
an observed change when an individual is given a sugar pill or sham intervention. For drug trials, a negative control group is used to assess for the placebo effect
Independent Variable
The variable that is manipulated
Dependent Variable
The variable measured or observed
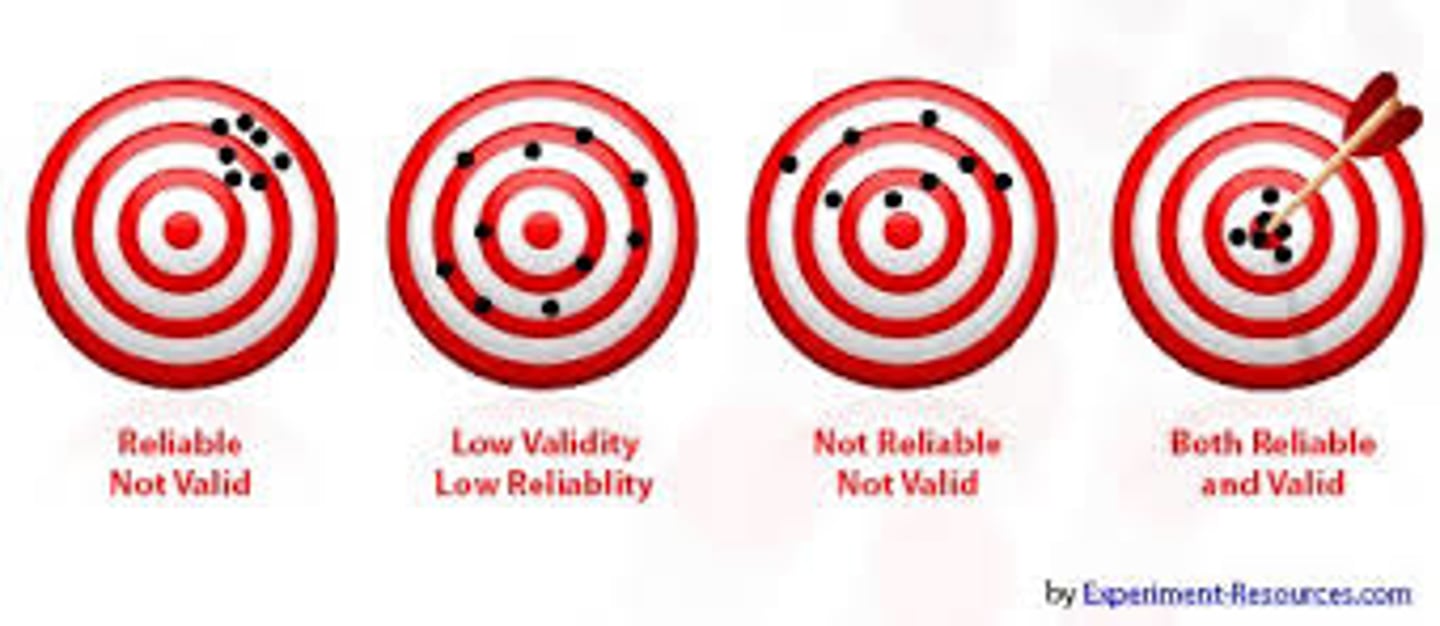
Accuracy (validity)
The ability of an instrument to measure a true value

Precise (reliability)
The ability of the instrument to read consistently
Systematic Error
error that comes from a problem with how you're doing the measuring- maybe you're misapplying the scoring formula in whatever practice book you're using
Randomization
Use of an algorithm to determine the placement of each subject in a group. Used to control for differences between subject groups in biomedical research
Researcher Bias
Subjective bias that may affect the perception of the subject or researcher if they know which experimental group the subject is in
Subject Bias
Bias that results from the subject's expectations or the subject's changing of his or her behavior.
Blinded
the subject and/or the investigators do not receive information about which group the subject is in
Single-blinded
Only the assessor or patient is blinded
Double-blinded
Both the patient and investigator is blinded
Regression Analysis
a reliable method of determining one or several independent variables' impact on a dependent variable.
Observational Studies
studies based on the examination of existing data sets in an effort to discover correlations
Cohort Studies
subjects sorted into 2 groups based on differences in risk factors and then assessed at various intervals to determine how many subjects in each group had a certain outcome. Example: 100 smokers and 100 nonsmokers followed for 20 years while counting the number of subjects who develop lung cancer in each group.
Cross-sectional studies
categorize patients into diff. groups at a single point in time. Example: a study to determine prevalence of lung cancer in smokers and nonsmokers at a given point in time.
case-control studies
Start by identifying number of subjects with or without a particular outcome, and then look backwards to asses how many subjects in each group had exposure to a particular risk factor. Example: a study in which 100 patients with lung cancer and 100 patients without lung cancer are assessed for their smoking history.
Clinical Trials
experiments that study the effectiveness of medical treatments on actual patients
Randomized Controlled Trial
Participants are randomly assigned to the experimental and control groups. Used to test efficacy/side effects of medical interventions like drugs. Best for clinical trial
Hill's Criteria
- Describe the components of an observed relationship that increase the likelihood of causality in the relationship
- Includes: Temporality, strength, dose-response relationship, consistency, plausibility, consideration of alternative explanation, experiment, specificity, coherence.
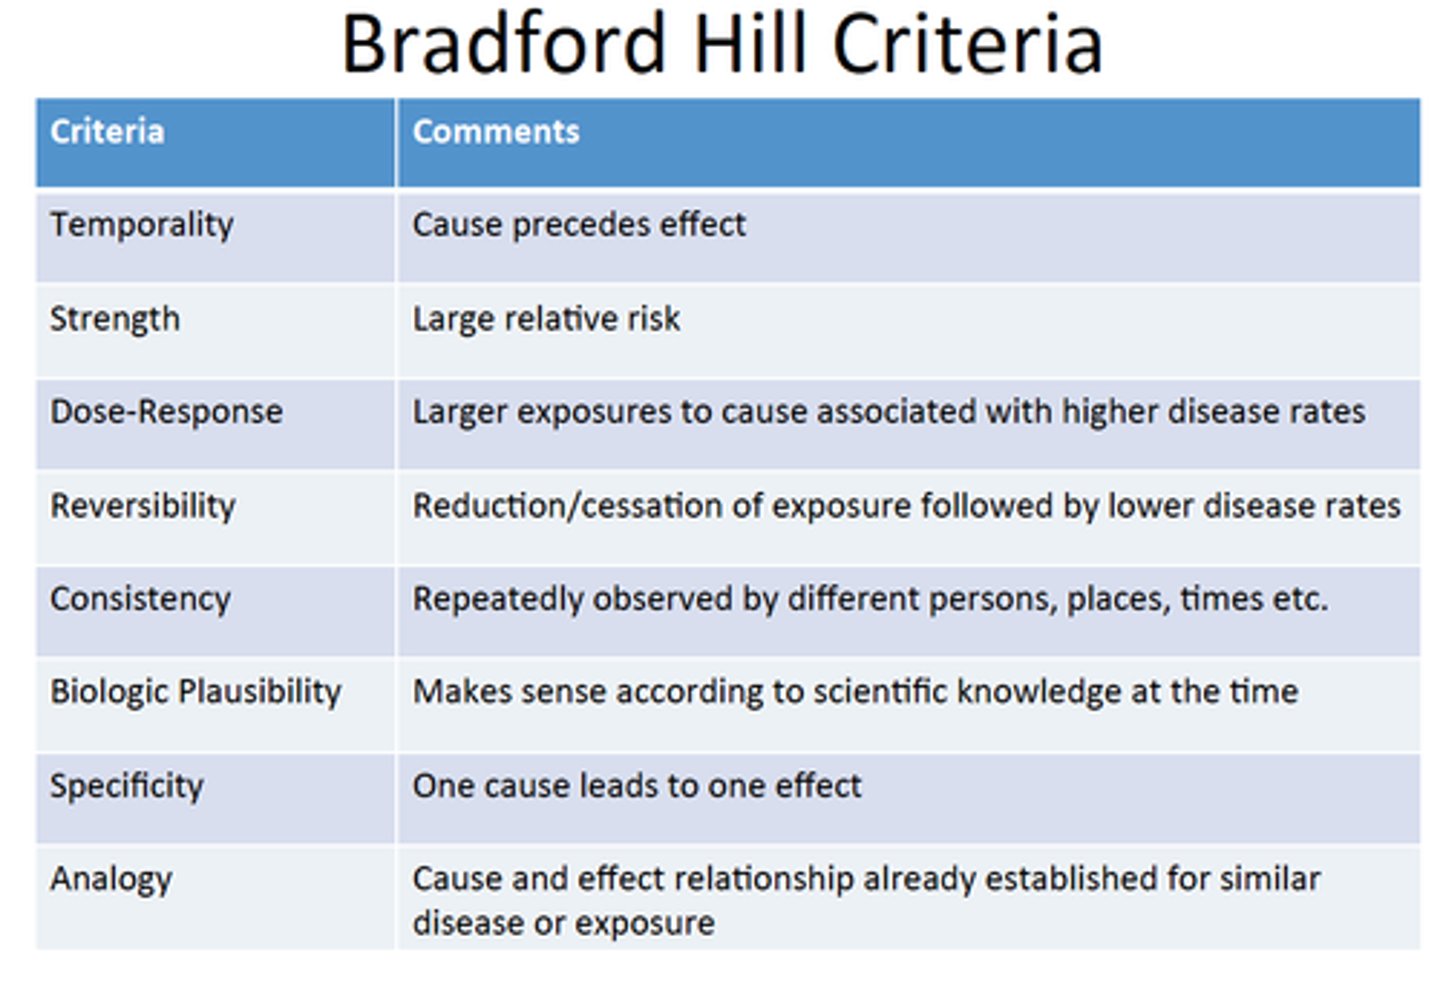
Temporality
The exposure (independent variable) must occur before the outcome (dependent variable)
Strength
As more variability in the outcome variable is explained by variability in the study variable, the relationship is more likely to be casual.
Dose-response relationship
As the study or independent variable increases, there is a proportional increase in the response. The more consistent this relationship, the more likely it is to be casual.
Consistency
The relationship is found to be similar in multiple settings.
Plausibility
There is a reasonable mechanism for the independent variable to impact the dependent variable supported by existing literature.
Consideration of alternative explanations
If all other plausible explanations have been eliminated, the remaining explanation is more likely.
Experiment
If an experiment can be performed, a casual relationship can be determined conclusively.
Specificity
The change in the outcome variable is only produced by an associated change in the independent variable.
Coherence
The new data and hypothesis are consistent with the current state of scientific knowledge.
Confound
An extraneous variable in a statistical model that correlates (directly or inversely) with both the dependent variable and the independent variable.
Moderating Variables
variables that strengthen or weaken the strength between the independent and dependent variables. An example of a moderator variable would be age because the relation between older men and testicular self exams may be stronger than younger men who may have a less strong or nonexistent relation to testicular self exam
Mediating Variables
shows what is the actual relationship between the independent variable and
the dependent variable So for this example, insurance coverage connects a patient's race (independent variable) and the amount of painkillers they received (dependent variable). Examples of mediating variables: Researchers are trying to find the relationship between social status and the frequency of testicular self-exams. Education in this study would be a mediating variable because it may explain why there is a relation between social
Construct Validity
the manner in which the terms of the study are defined: how well a given assessment actually measures what it set out to
measure
Test-Reliablity
the fact that a good test should give stable results over time
Inter-Rater Reliability
if the assessment was done by different researchers, they should generate similar results
Criterion Validity
Whether a variable is able to predict a certain outcome
Chi-Square
Incidence
describes the number of new cases of a disease (like multiple sclerosis) during a specific time interval
Prevalence
describes how common multiple sclerosis is. More specifically, prevalence tells us how many people (new cases and current cases) have multiple sclerosis within a certain amount of time
Selection Bias
Subjects used for the study are not representative of the target population
Detection Bias
Results from educated professionals using their knowledge in an inconsistent way. Because prior studies have indicated that there is a correlation between two variables, finding one of them increases the likelihood that the researcher will search for the second.
Hawthorne Effect (Observation Bias)
A type of reactivity that results in the behavior of study participants being altered simply because they recognize that they are being studied. This effect is specific for human research
Difference between Hawthorne Effect and Social Facitilitation
The biggest difference is that the Hawthorne effect refers specifically to the realm of a particular experiment or research of some kind being conducted, and a subject is behaving in the way they feel is expected of them rather than behaving naturally.
Social facilitation is not limited to a research environment and is about performing better in the presence of other people when compared to being alone
Strength of a Correlation
usually expressed as r, which can range from −1 to 1. An r value of 0 expresses no correlation whatsoever, while r values of −1 and 1 correspond to perfect negative and positive correlations, respectively.
Statistical Significance
the low likelihood of the experimental findings being due to just chance
Clinical Significance
The usefulness or importance of experimental findings to patient care or patient outcomes
Regression Value
The related value of R2 expresses how well the regression line (the line of best fit) captures the data point, with 1 indicating a perfect correspondence between the regression line and the data and 0 indicating no correspondence
Regression
All variables examined are continuous, and there is a specific finding of which variable is influencing the other
Correlation
All variables are continuous, but unlike regression, it makes no assumption about which variable is influencing the other
Four Core Ethical Tenets
Beneficence, nonmaleficence, respect for patient autonomy, and justice`
Respect for persons
Includes autonomy, informed consent, and confidentiality
Nonmaleficence
The obligation to avoid treatments or interventions in which the potential for harm outweighs the potential for benefit.
Autonomy
The responsibility to respect patients' decisions and choices about their own healthcare
Beneficence
The intent to cause a net positive change for both study population and the general population, and we must do our best to minimize any potential harms
Justice
The responsibility to treat similar patients with similar care, and to distribute healthcare resources.
Equipoise
In a study comparing two potential treatment options, one cannot approach the research for the knowledge that one treatment is superior to the other. If it becomes evident that one treatment option is clearly superior before the study is scheduled to finish, the tril must be stopped because providing an inferior treatment is a net harm.
Morally relevant
Those differences between individuals that are considered an appropriate reason to treat them differently such as age.
Internal validity
The identification of causality in a study between the independent and dependent variables.
External validity
The ability of a study to be generalized to the population that it describes.
Generalizability
in studies, it is the application of the results to either a significantly wider population or across different settings; it basically assess how well the results of a particular study applies to the general population
Skewed Distributions
reasons why outliers occur
1. a true statistical anomaly
2. A measurement error
3. A skewed distribution
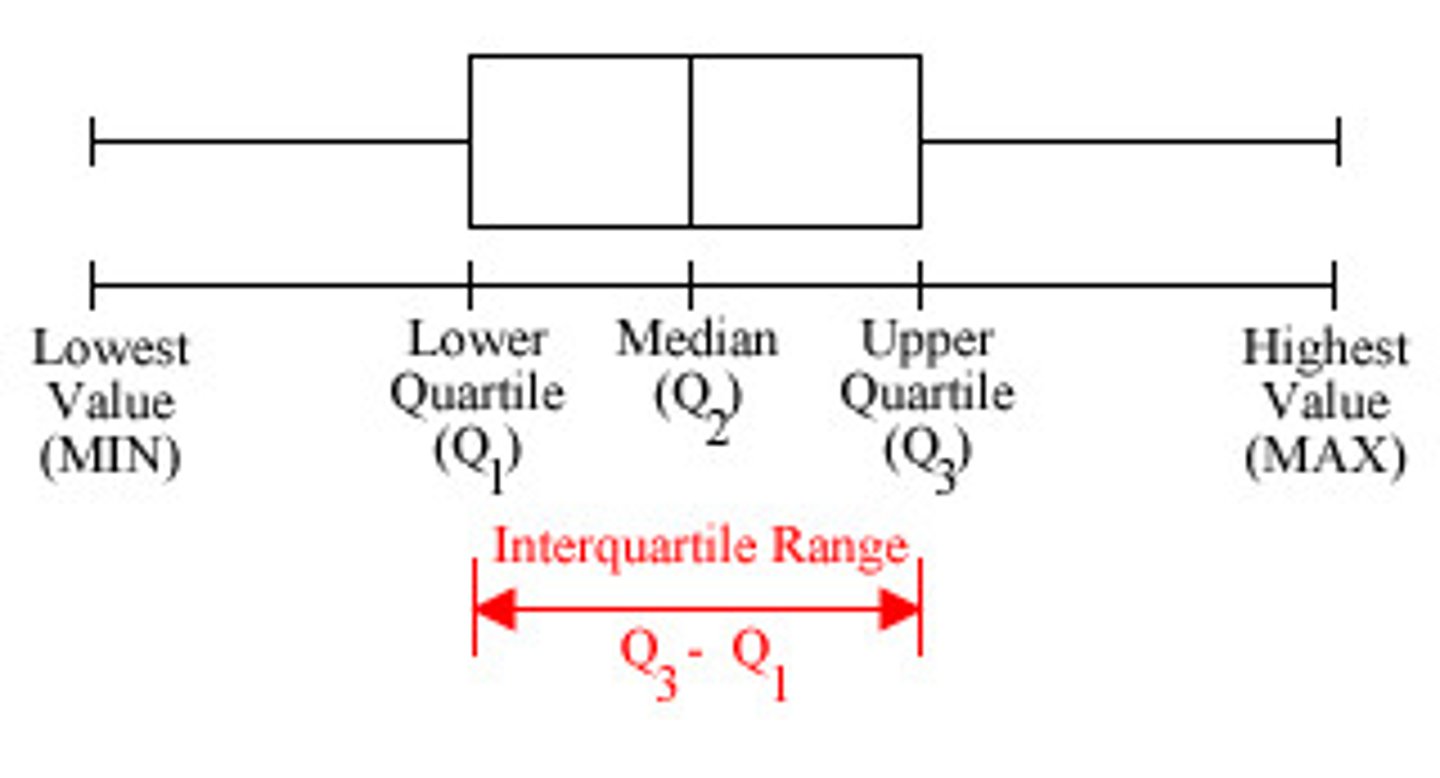
Interquartile Range
1. To calculate the position of Q1, multiply n by 1/4. If whole number Q1 is the mean of the value at this position and the next highest. If decimal round up to next whole number, and take that as Q1.
2. Repeat for Q3
IQR = Q3 - Q1
Any value lower than 1.5 x IQR below Q1 or any value high than 1.5 x IQR above Q3.
Probability of two or more events occurring at the same time is the product of their probabilities alone
P(A and B) = P(A) x P(B)
And - multiply probablities
Probability of at least one of two events occurring is equal to:
P(A or B) = P(A) + P(B) - P(A and B)
or - add the probabilities
Mutually exclusive outcomes
Cannot occur simultaneously
Exhausitive
When a set of outcomes is exhausitive, there are no other possible outcomes.
Confidence
The probability of correctly failing to reject a true null hypothesis; reporting no difference between two populations when one does not exist
Type I Error
We report a difference between two populations when one does not actually exist (alpha)

Type II Error
When we incorrectly fail to reject the null hypothesis (beta)
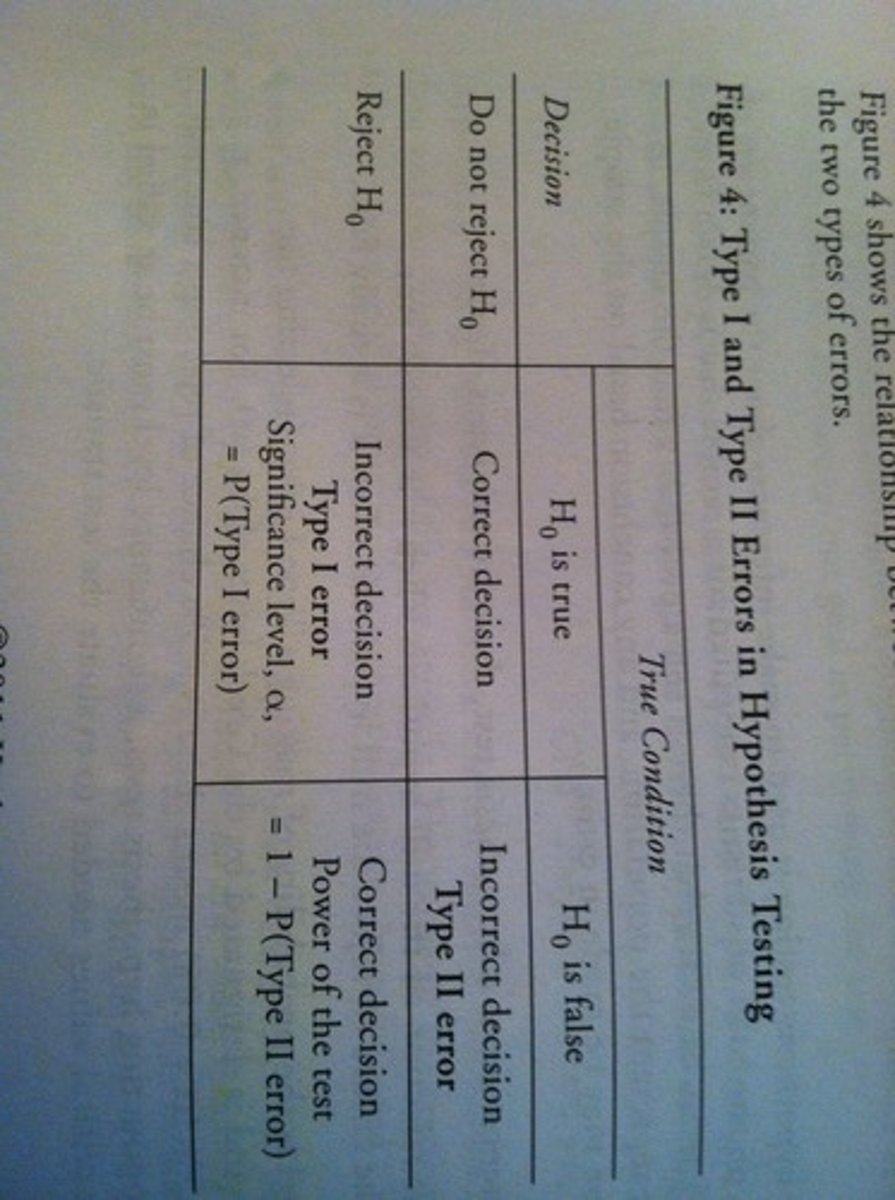
Power
1-Beta
P - value
Likelihood that the outcome of an experiment was due to chance; < 0.05 means that the result is significant
Confidence Interval
Taking a sample population and measure what we want to measure, and then we find a mean of out sample. The 95% confidence interval is constructed around our sample mean, and gives a range above and below the mean found in the sample. This means that if we were to measure another sample, its mean should fall somewhere along the range determined by the 95% confidence interval
Experimental Study
a study where we test to prove a causal relationship between the independent variable and dependent variable. Participants are randomly assigned to different groups or levels of the independent variable. Between-subjects and within-subjects designs are common experimental studies
Between-subjects design
a type of experimental study where participants are randomly assigned to to an experimental group in the study, such that a participant only participates in one group
Why do within subjects designs give you higher power than between-subjects design?
Within-Subject designs gives you higher power because you are using more "subjects" in your study by using the same person in multiple conditions, and that you decrease individual difference effects seen in between-subjects designs because the subject is compared with 1 control - themselves
Within-subjects design
a type of experimental design also known as the repeated measures design is when a participant is exposed to every level of the independent variable(different levels of shocks). Gives you higher power because you are using more "subjects" in your study by using the same person in multiple conditions, and that you decrease individual difference effects seen in between-subjects designs.
Longitudinal Study
an observational study that is conducted over a long period of time, usually uses a specific cohort of people. One example is to study incidence of heart disease in people over time, while monitoring things like their diet or smoking habits
Why are longitudinal studies always considered observational?
The thing about longitudinal studies is that the passage of time can introduce for greater potential of confounding variables
Correlational Study
a study that attempts to determine if there is simply a relationship between two variables.
Predictor Variable
for a correlation or regression study, it is the analog to an independent variable. It is a variable used in correlation or regression analysis to predict the criterion variable
Criterion Variable
for a correlation or regression study, it is an analog to a dependent variable. It is A variable that is a primary object of a research study; it is forecasted by a predictor variable
Difference between experimental and observational studies
Observational studies can only show at most correlation between two variables, but experimental studies can possibly prove causation between variables
Retrospective Study
an observational study type where we look back at information in the past to try and find a trend between events in the past and current outcomes. One example would be conducting an experiment on people who suffer from Alzheimer's disease and looking back at their medical records to set up a relation between factors in the past and the current outcome.
Importance of Retrospective Study
It helps to develop and find potential risk factors for disease
Prospective Study
an observational study where we follow groups of people and see how their behavior in that time influence future outcomes. This kind of study is looking into the future, while retrospective studies are looking into the past. One popular example of this kind of study is by following nurses to determine long term health outcomes by looking at factors like stress, smoking, and level of exercise.
Mixed-method Research Design
a study where you use both qualitative and quantitative measures to conduct your study. One example would be using quantitative measures like how would you report your like for this product on a scale of 1 through 10, and then later following up with people who answered either negatively or poorly and asking them for their qualitative opinion
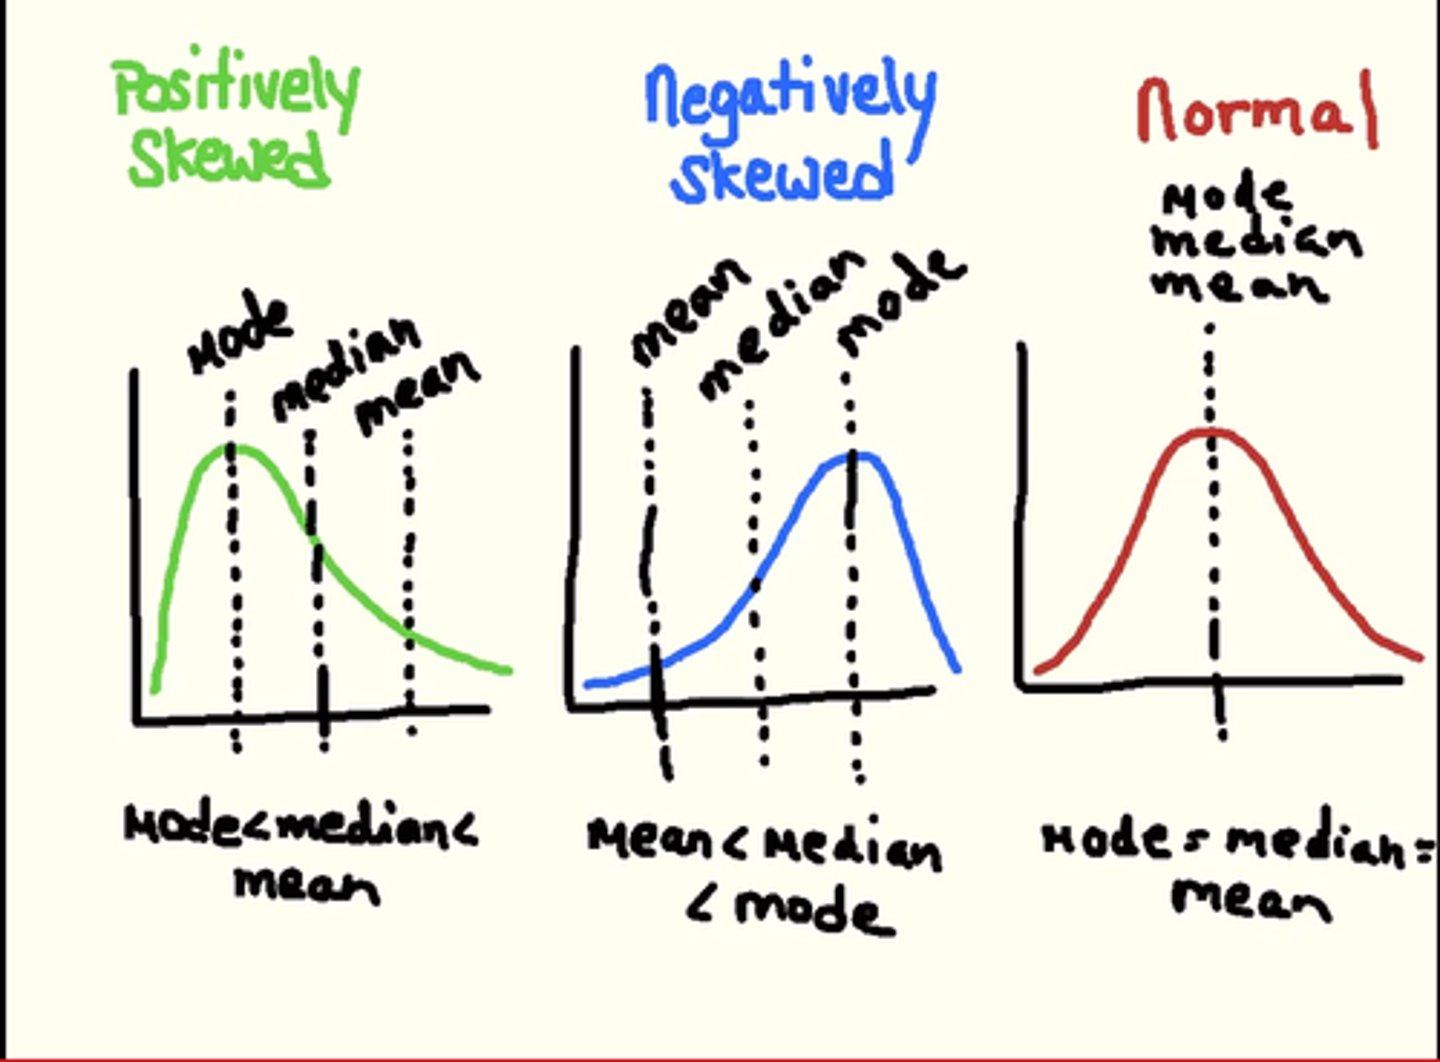
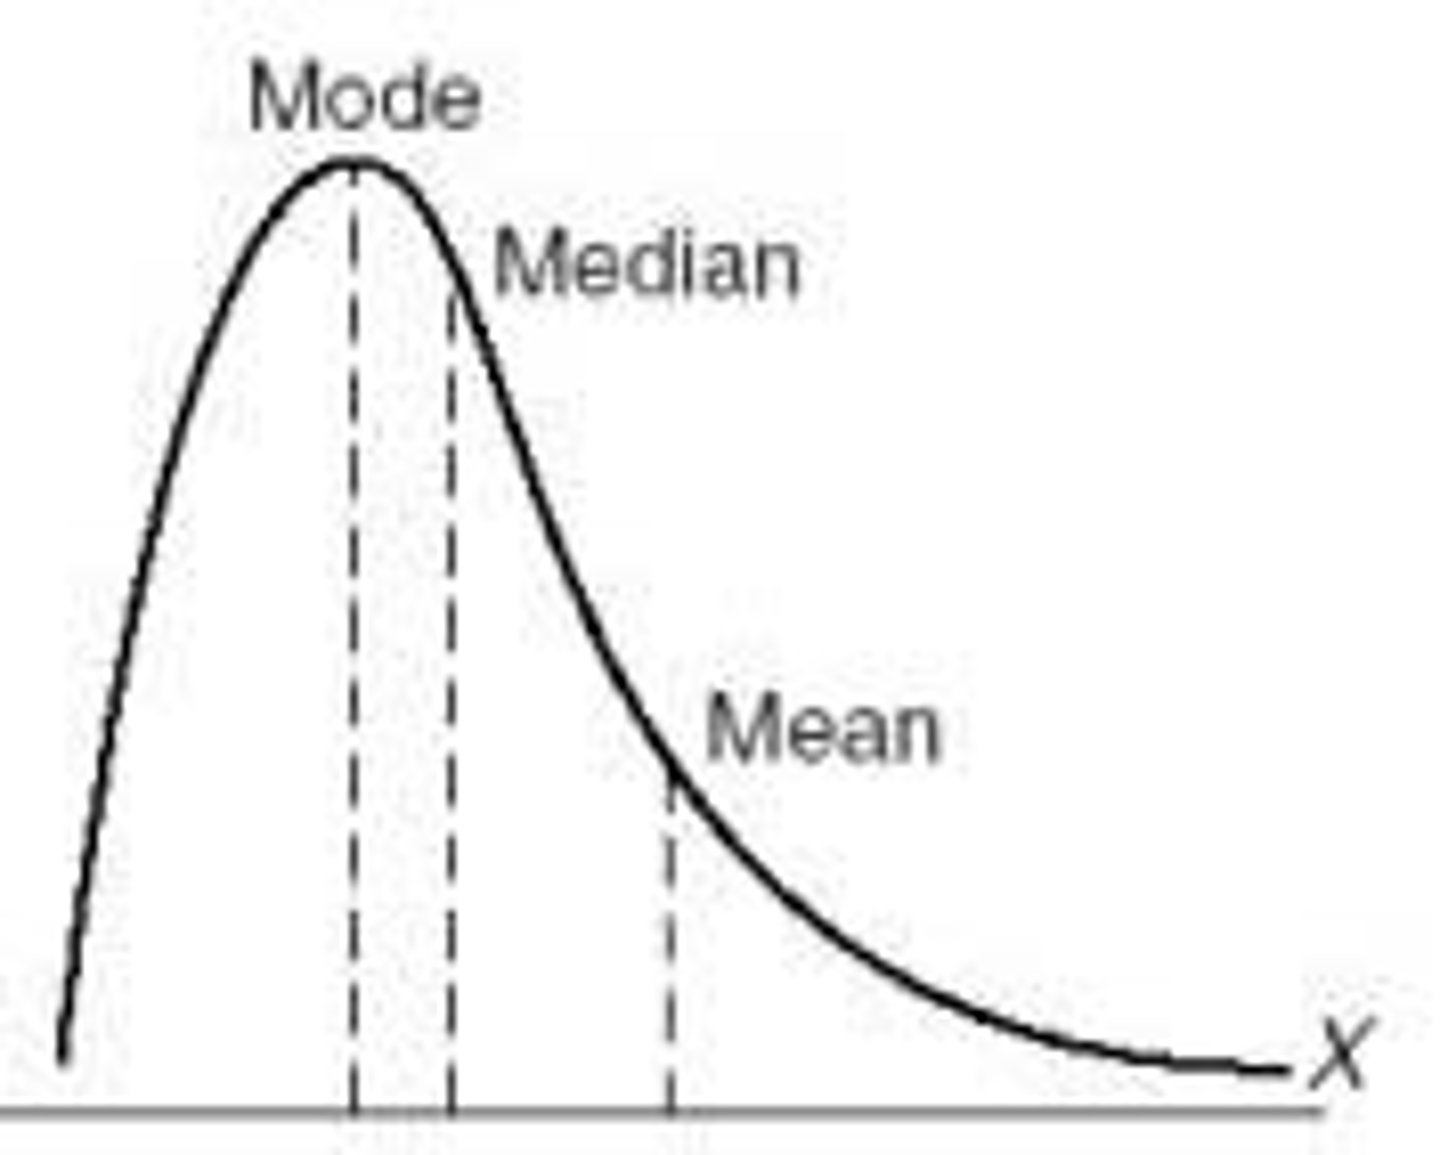
Mean
Average of all the data points; it is really sensitive to outliers and can be shifted towards certain sides of the range. So be careful to interpret the mean in context. Can be used to measure the central tendency
Median
Data point where half the points are greater and half are lower. Found (n +1)/2, where n is the number of data points. If your data points are even numbered, average the 2 middle points
Mode
The date points that show up the most frequently
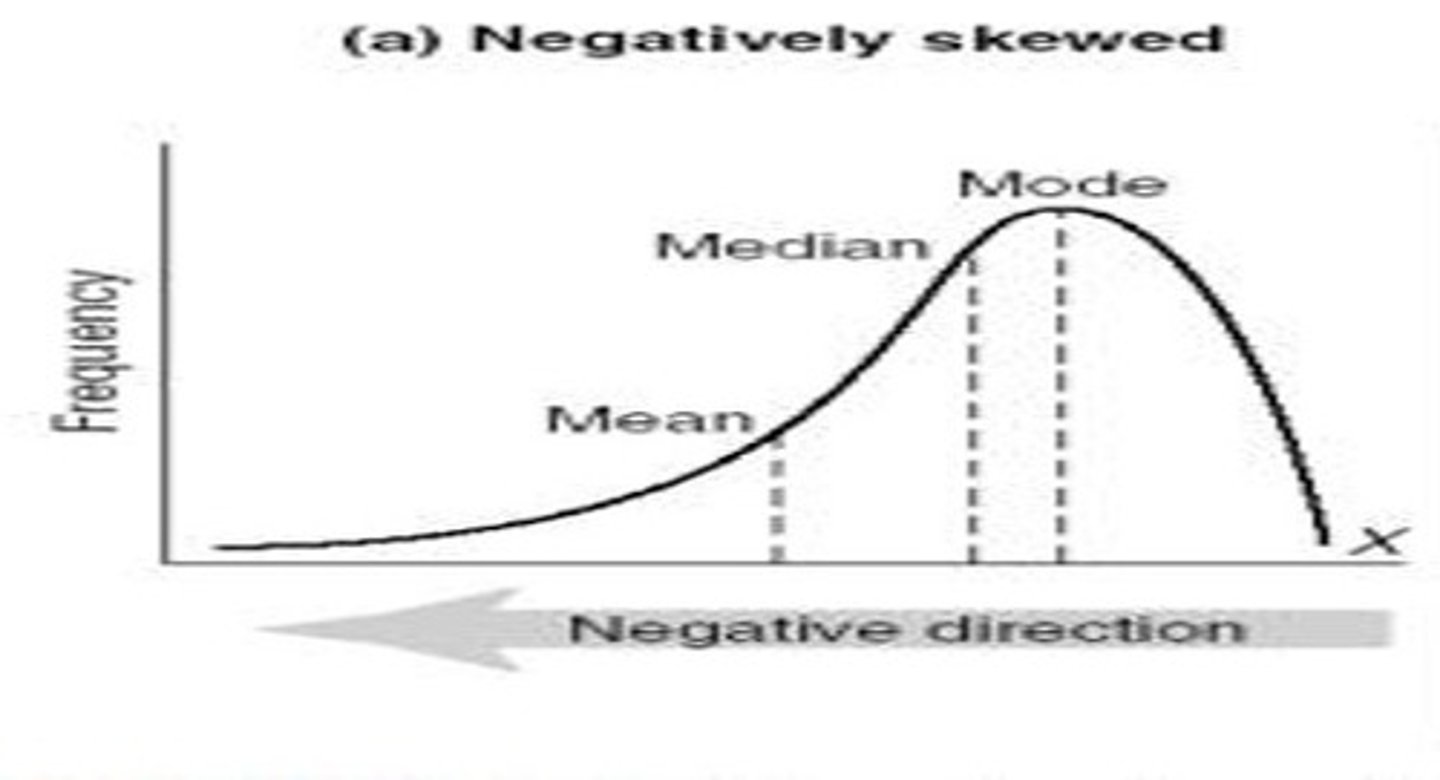
Relationship between mean and median
If they are close together, then there is a symmetrical distribution, and if they are far apart, then there is the presence of outliers or a skewed distribution
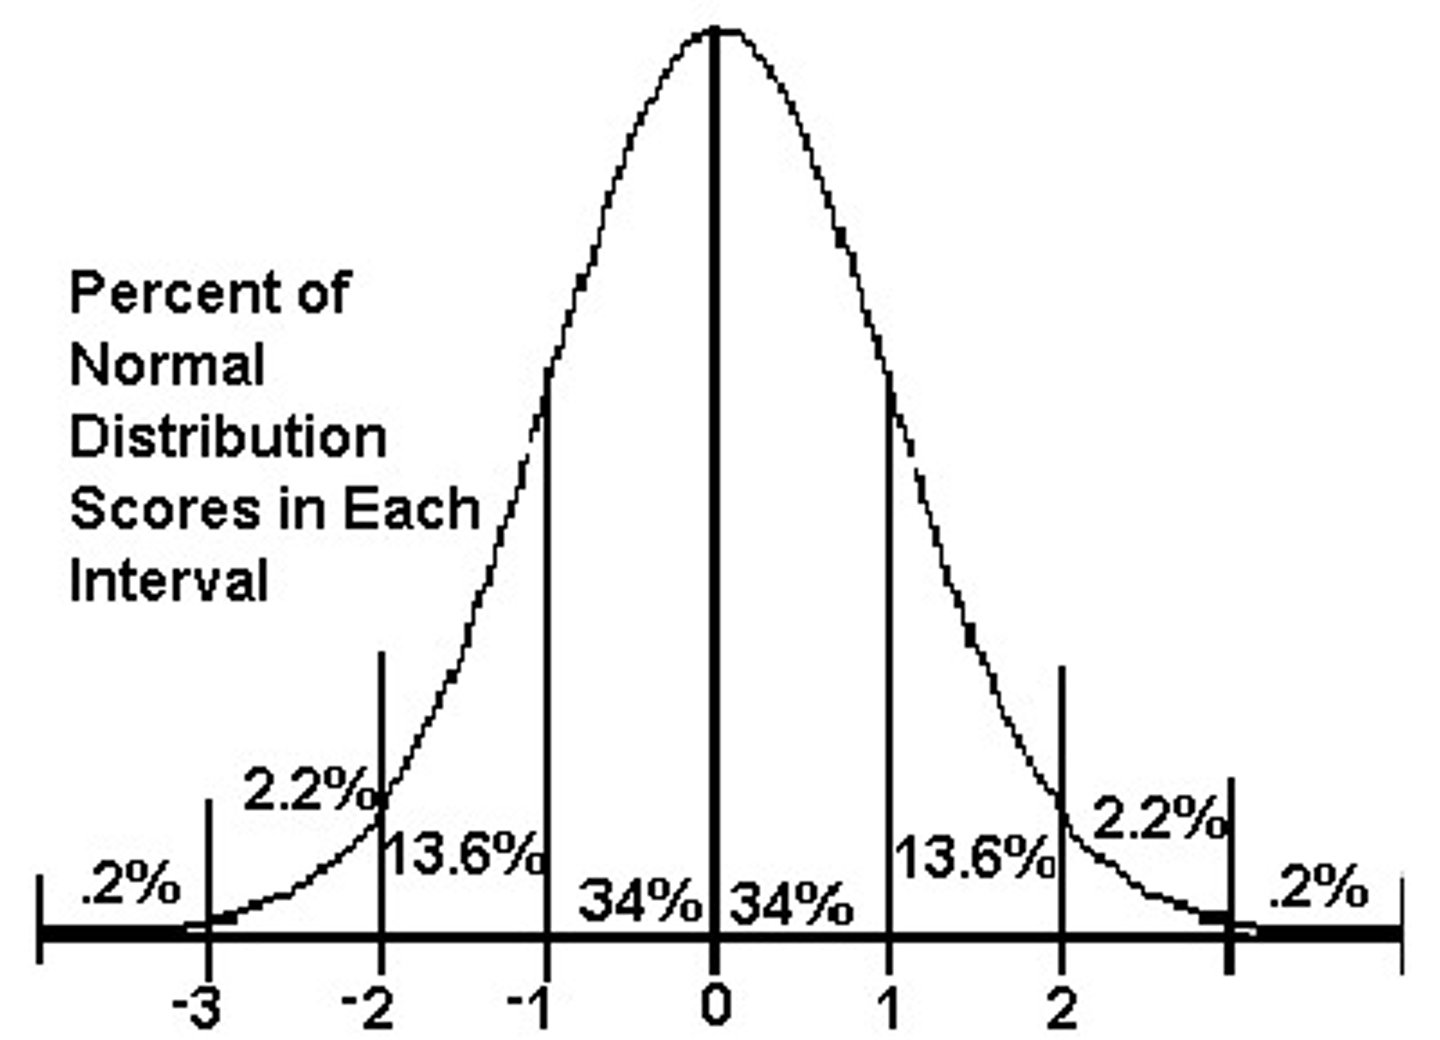
Normal Distribution
A function that represents the distribution of variables as a symmetrical bell-shaped graph.. The mean, median, and mode are at the center of the distrubtion. About 68% are within one standard deviation of the mean, 95% are within 2, and 99% are within 3.
Negatively Skewed Distribution
The graph shows that the mean is lower than the median
Positively Skewed Distribution
On the graph, the mean is higher than the median
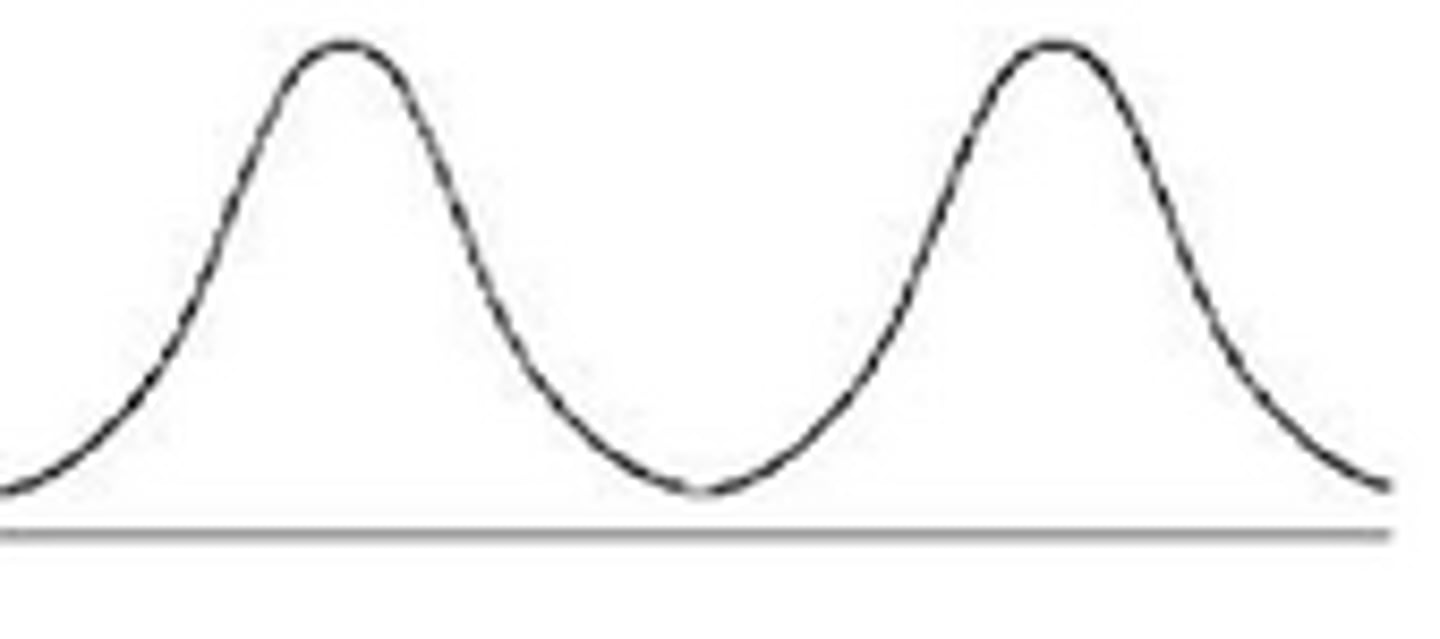
Bimodal Distribution
2 modes