Lab 01: Lab Safety
1/36
There's no tags or description
Looks like no tags are added yet.
Name | Mastery | Learn | Test | Matching | Spaced |
|---|
No study sessions yet.
37 Terms
safety officer
critical part of lab safety program
labelling all chemicals
providing supplies for the proper handling and disposal of biohazardous materials
Occupational Safety and Health Administration
OSHA stands for
Occupational Safety and Health Administration Acts and Standards
standards include provisions for warning labels or other appropriate forms of warning to alert all workers to potential hazards, suitable protective equipment, exposure control procedures, and implementation of training and education programs
Occupational Safety and Health Administration
primary purpose is to ensure safe and healthful working conditions for every US worker
1970
OSHA was created
Occupational Safety and Health Administration Acts and Standards
formal safety program
w/ specifically mandated plans
identification of various hazards
Centers for Disease Control and Prevention
CDC stands for
1991
OSHA mandated that all clinical laboratories must implement a chemical hygiene plan and exposure control plan and a copy of MSDS must be readily accessible and available to all employees at all times
September 30, 2009
OSHA published the long-awaited Proposed Rule to modify the Hazard Communication Standard (HCS) to conform with UN’s Globally Harmonized System (GHS) of Classification and Labeling of Chemicals
chemical hazard communication (HAZCOM)
it includes:
revised criteria for classification of chemical hazards
revised labelling provisions that include requirements for use of standardized signal words, pictograms, hazard statements, and precautionary statements
material safety data sheets
MSDS
Occupational Exposure to Bloodborne Pathogens
this regulation requires that laboratories develop, implement, and comply with a plan that ensures the protective safety of laboratory staff to potential infectious bloodborne pathogens, hepatitis B virus, and human immunodeficiency virus
OSHA
educate and train all healthcare workers in standard precaution and preventing bloodborne infections
provide proper equipment and supplies
monitor compliance with the protective biosafety policies
Safety Manual Policies and Practices
Standard Precautions
Handwashing
Personal
Protective Equipment
Safe Work Practices and Protective Techniques for Infection Control includes:
needlestick prevention
sharps prevention
Preventing Occupational Transmission of HBV and HIV through
1:10
dilution of bleach
hypochlorite
most widely used of the chlorine disinfectants
nonanalytical factors
analysis of quantitative data (quality control)
quality assessment system is divided into 2 major components:
test request procedures
patient identification
specimen procurement
specimen labeling
specimen transportation and processing procedures
laboratory personnel performance
laboratory instrumentation, reagents and analytical test procedures
turnaround times
accuracy of the final result
quality assessment in the hematology laboratory:
qualified personnel
laboratory policies
laboratory procedure manual
test requisitioning
patient identification and specimen procurement and labeling
specimen collection, transport, processing, and storage
preventive maintenance of equipment
appropriate methodology
accuracy in reporting results and documentation
variance
a general term that describes the factors or fluctuations that affect the measurement, in operator performance
providing a guide to the functioning of equipment, reagents, and individual technique
confirming the accuracy of testing when compared with reference values
correcting an increase in the frequency of both high and low manually acceptable value (dispersion)
detecting any progressive shift of values to one side of the average value for at least 3 days (trend)
demonstrating an abrupt shift or change from the established average value for 3 days in a row (shift)
dispersion
increase in the frequency of both high and low manually acceptable value
trend
progressive shift of values to one side of the average value for at least 3 days
shift
abrupt shift or change from the established average value for 3 days in a row
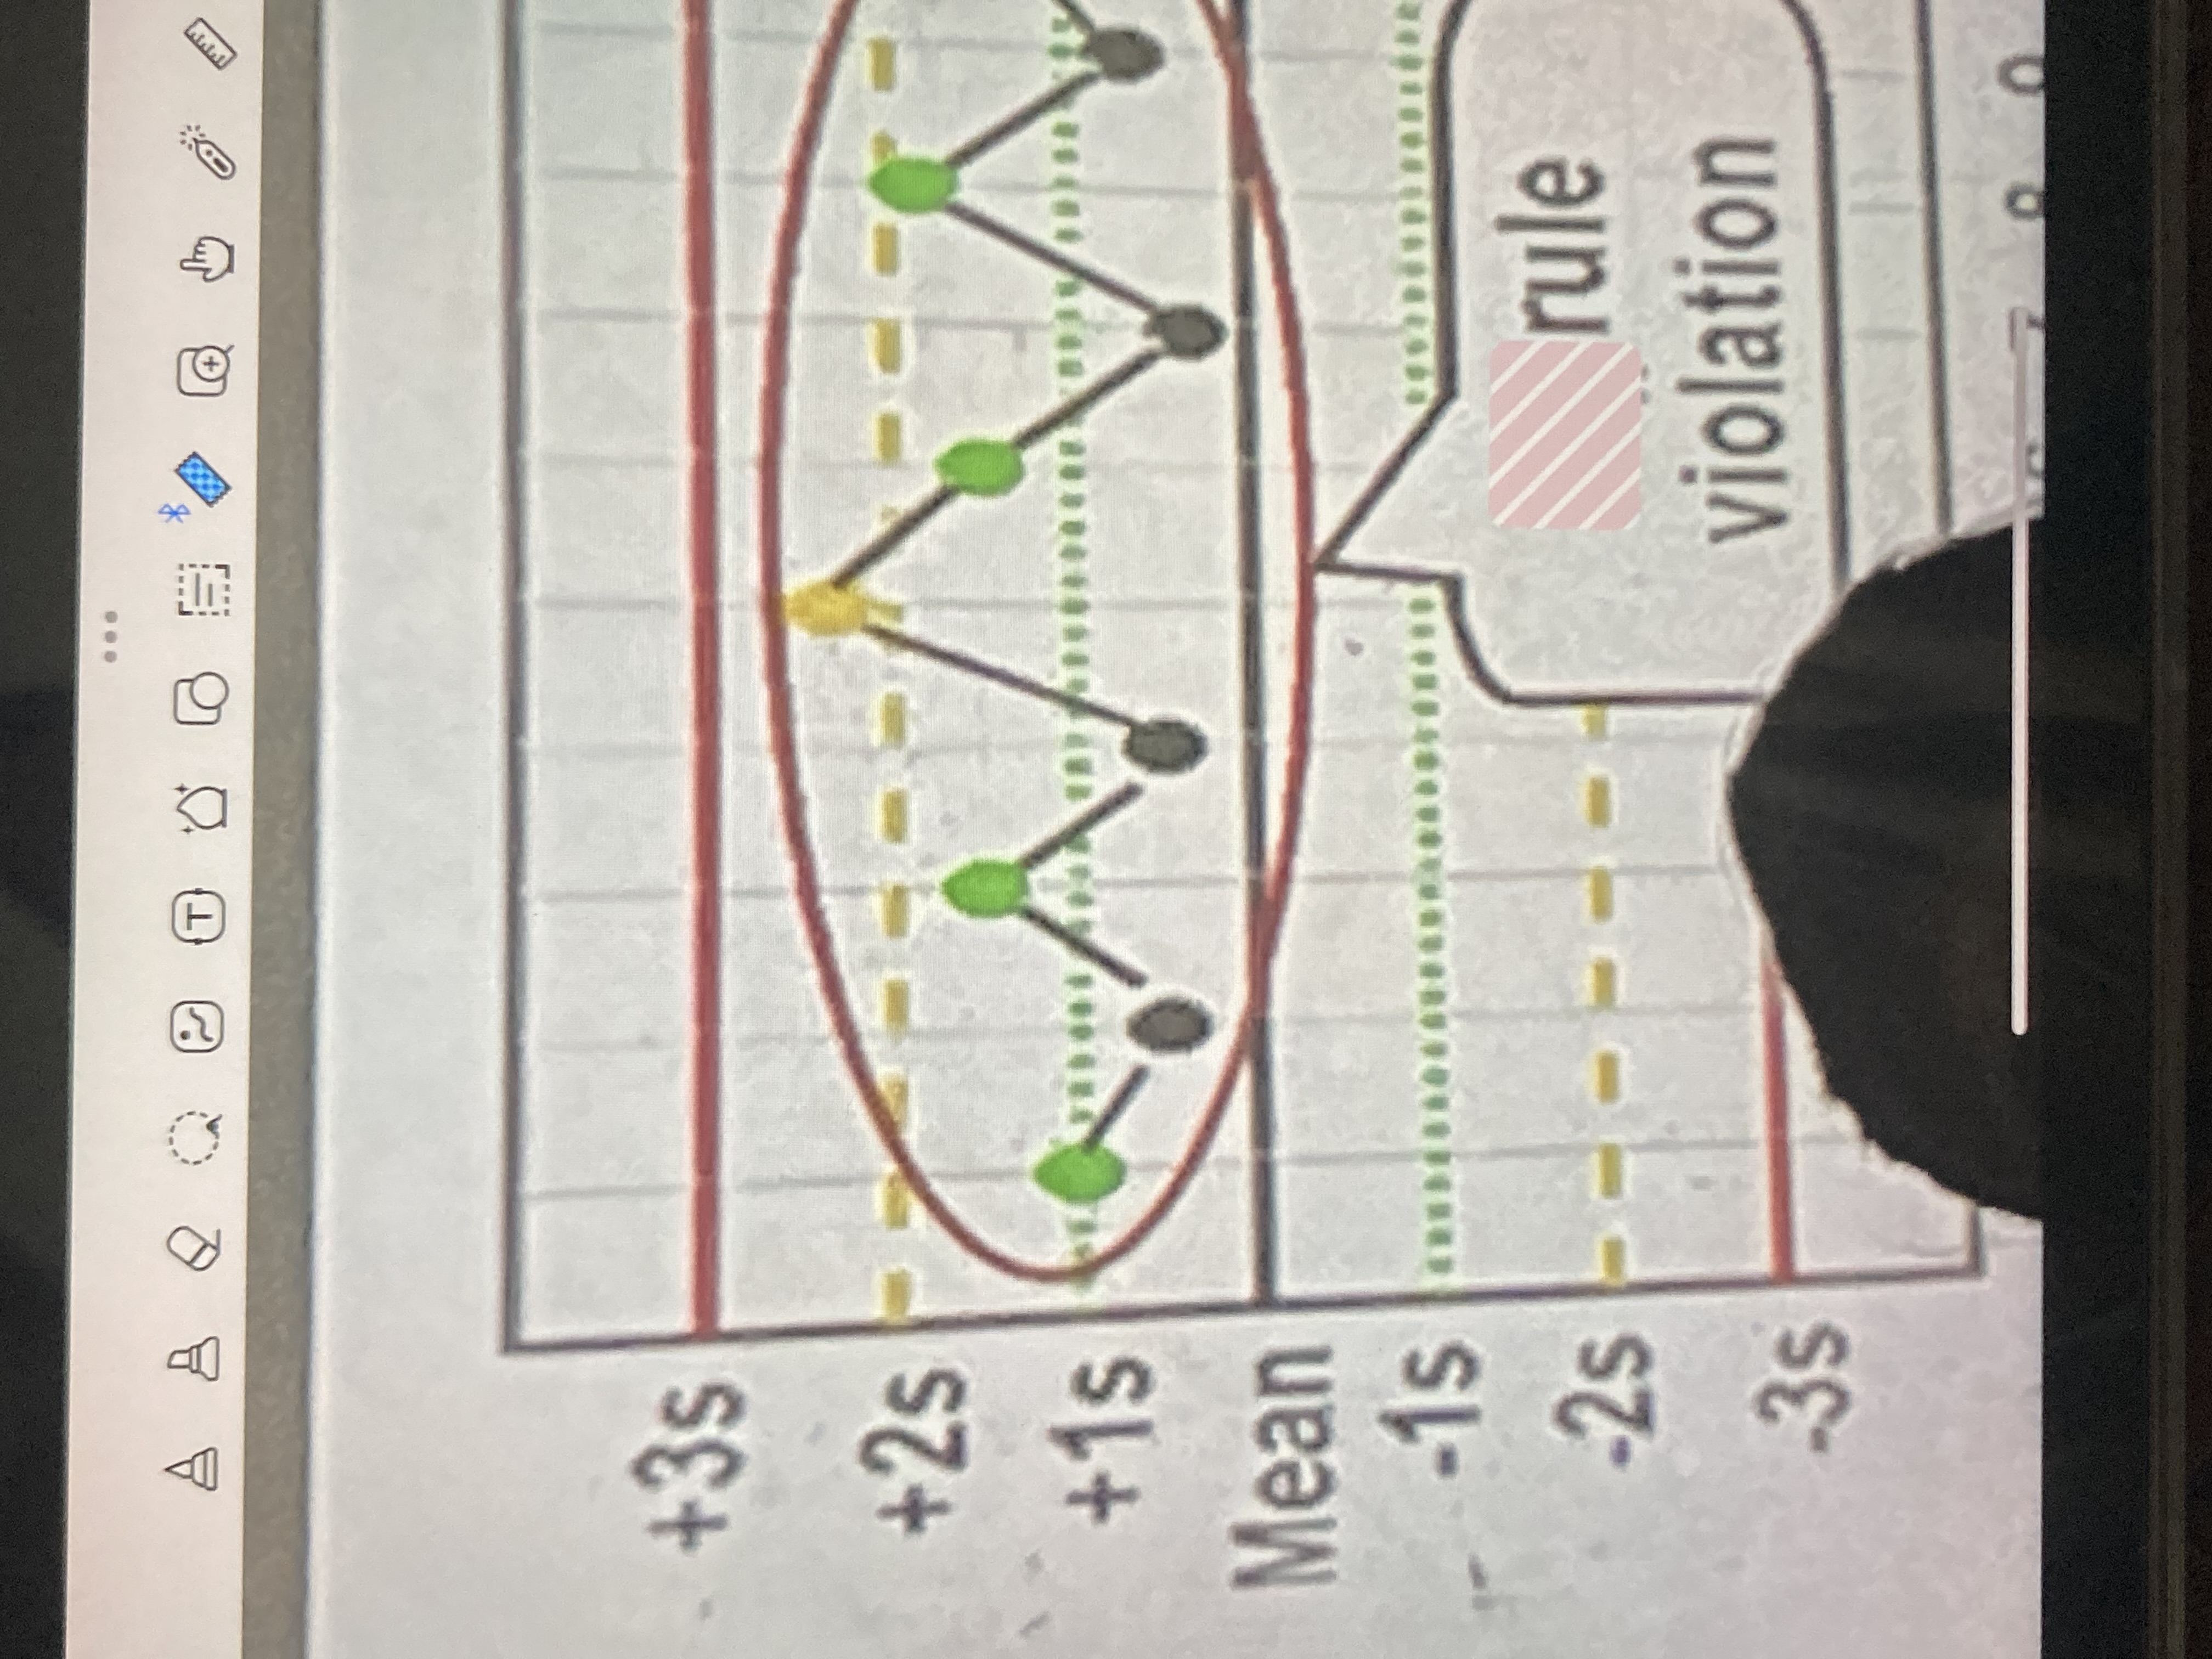
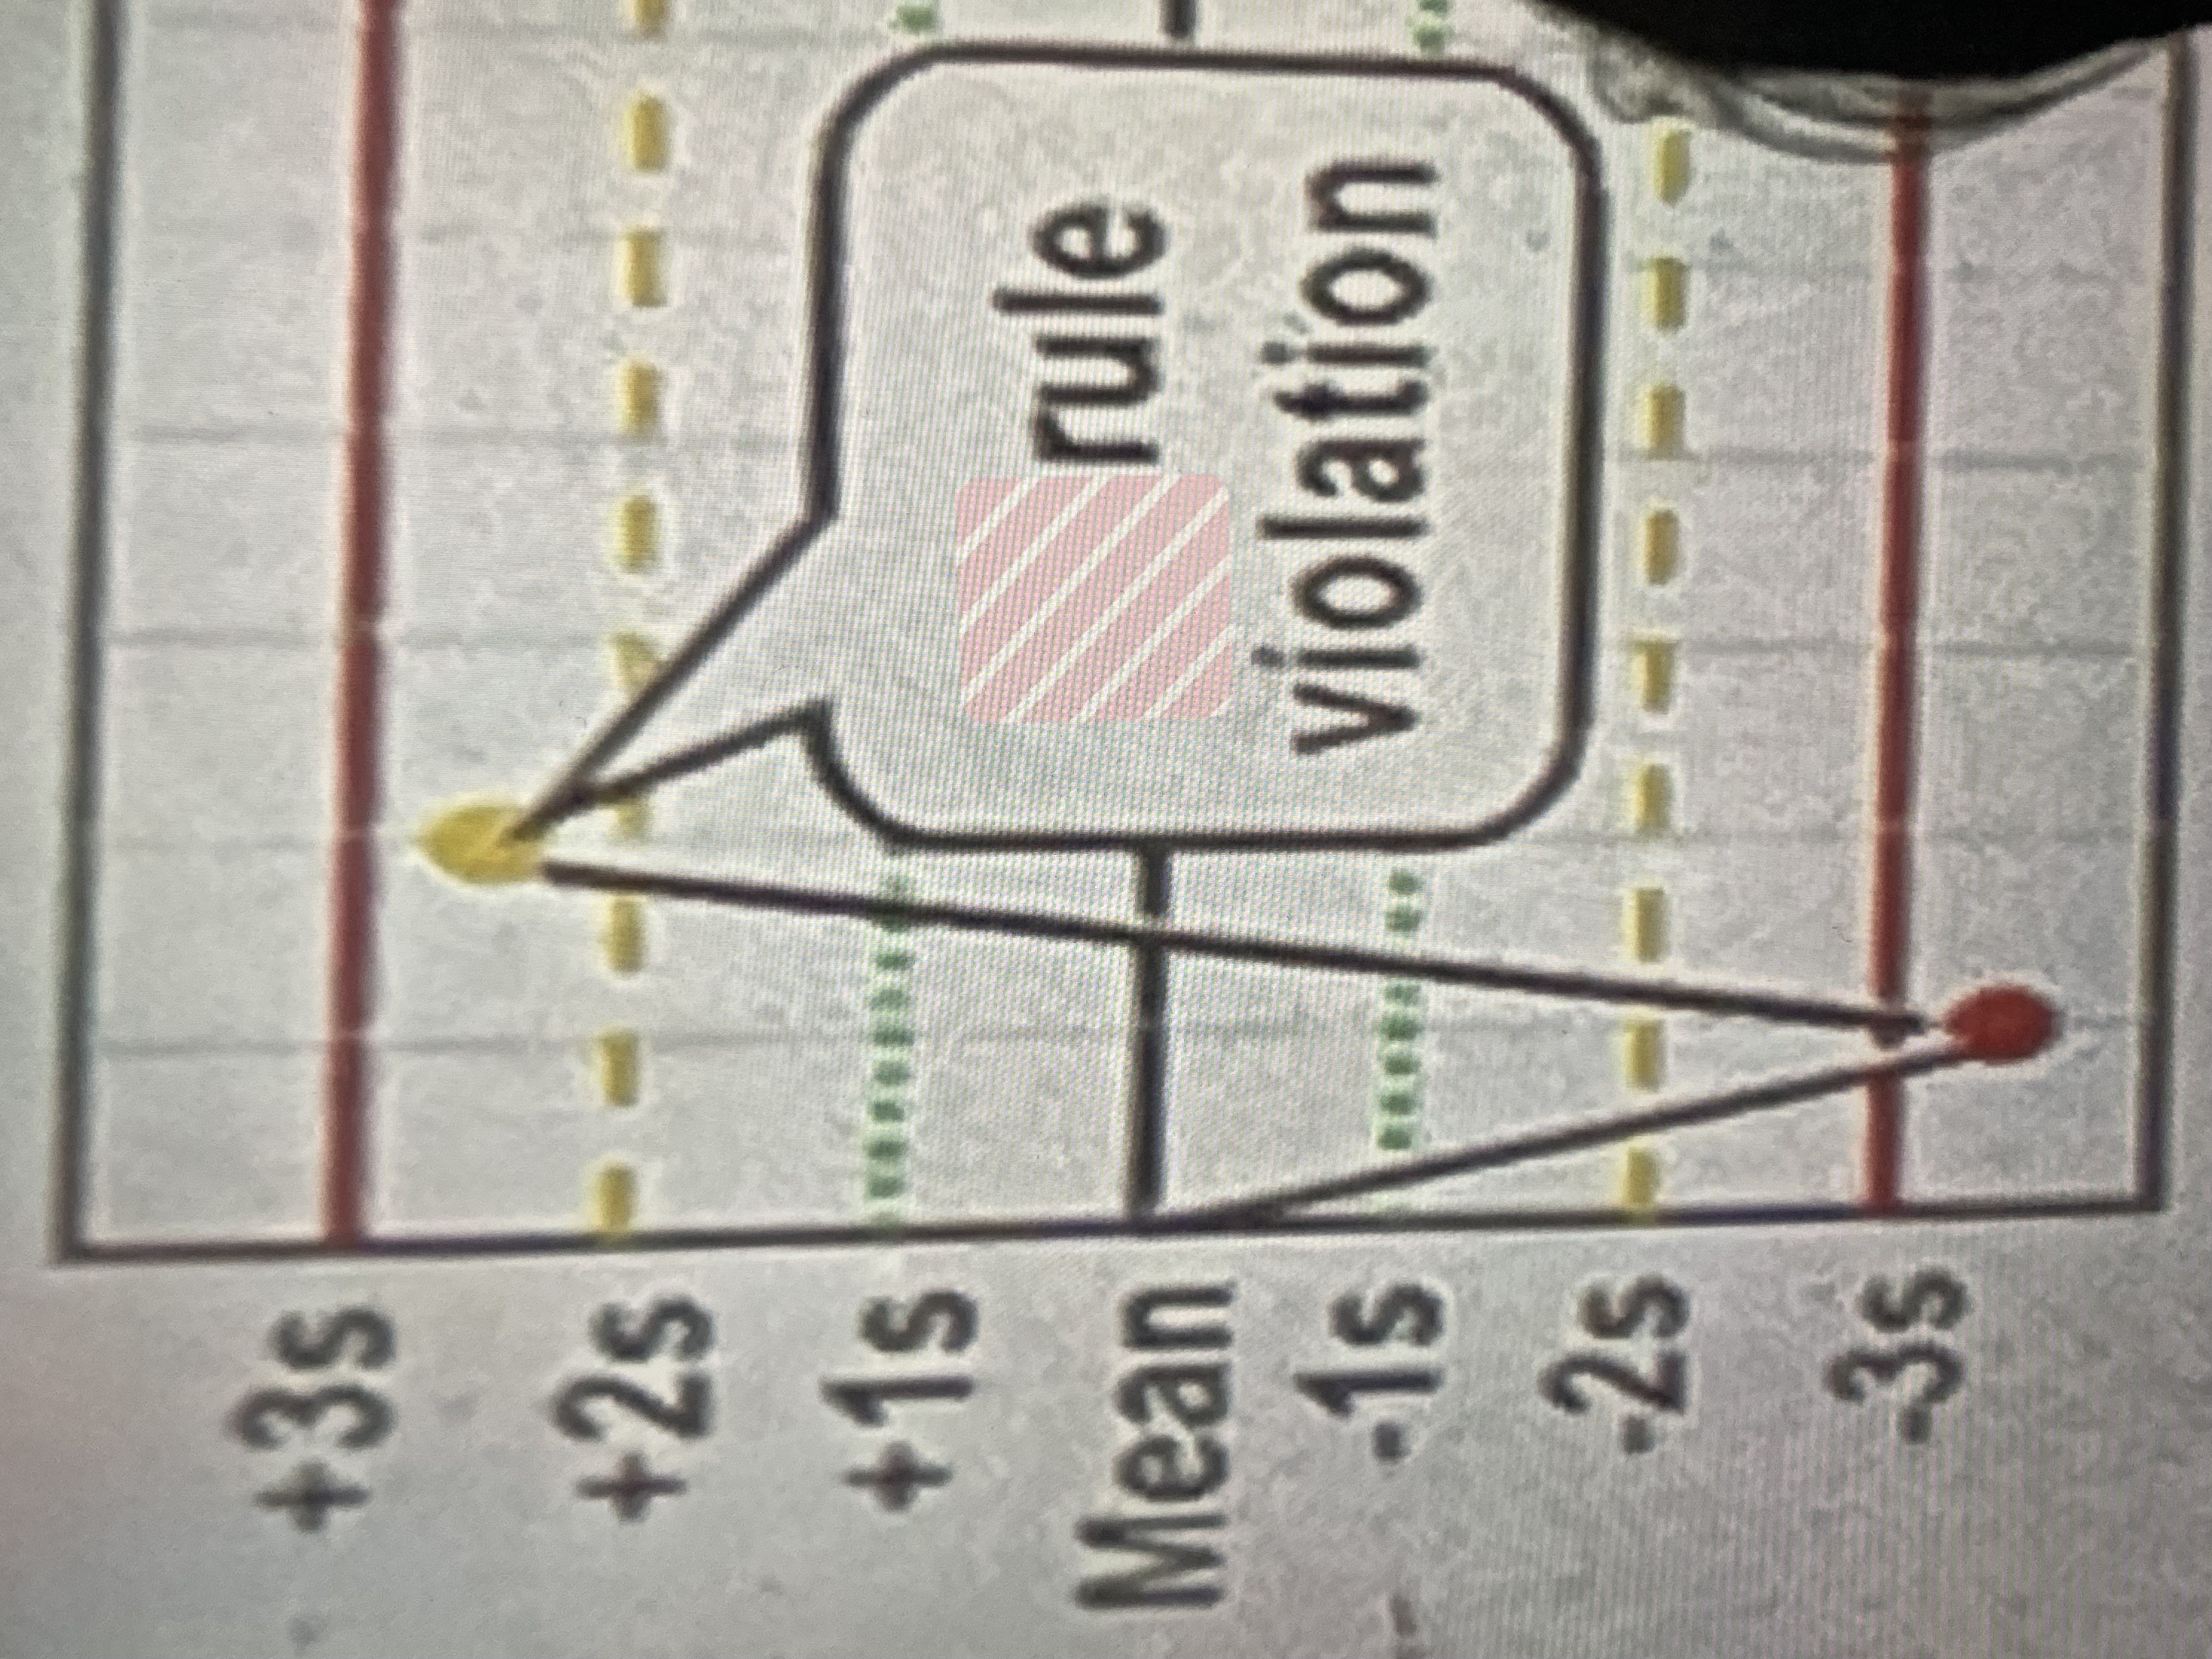
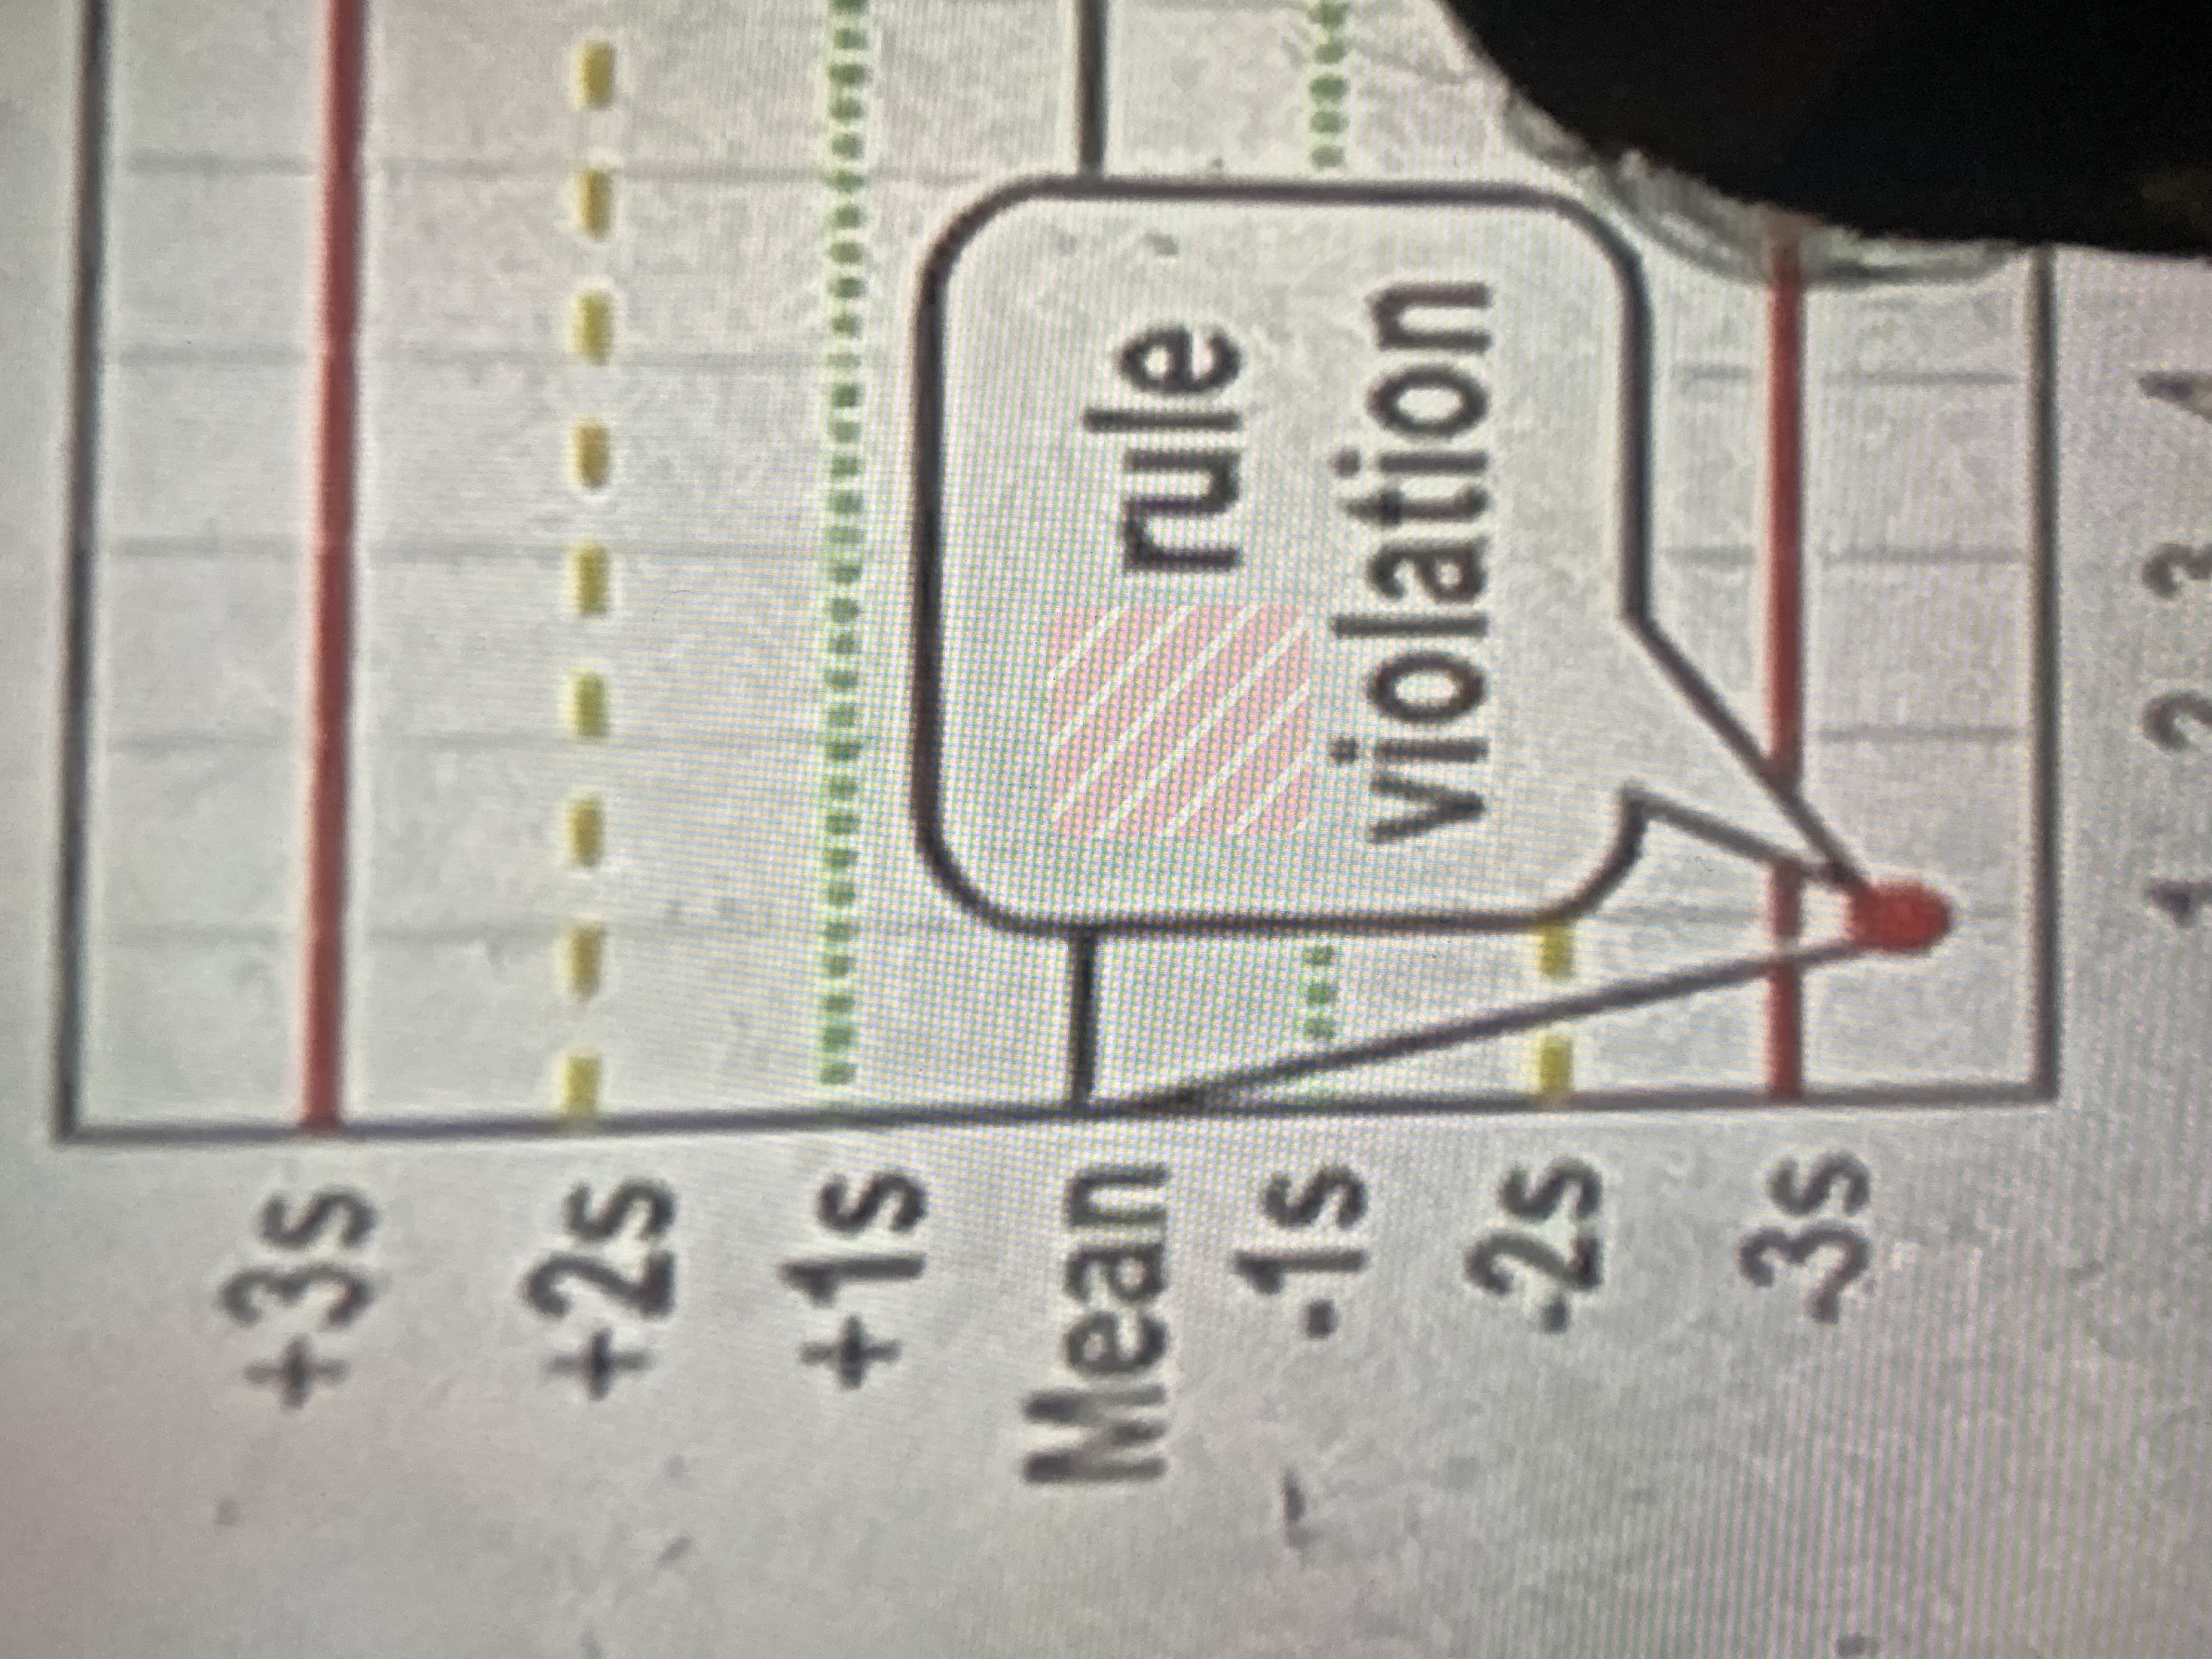
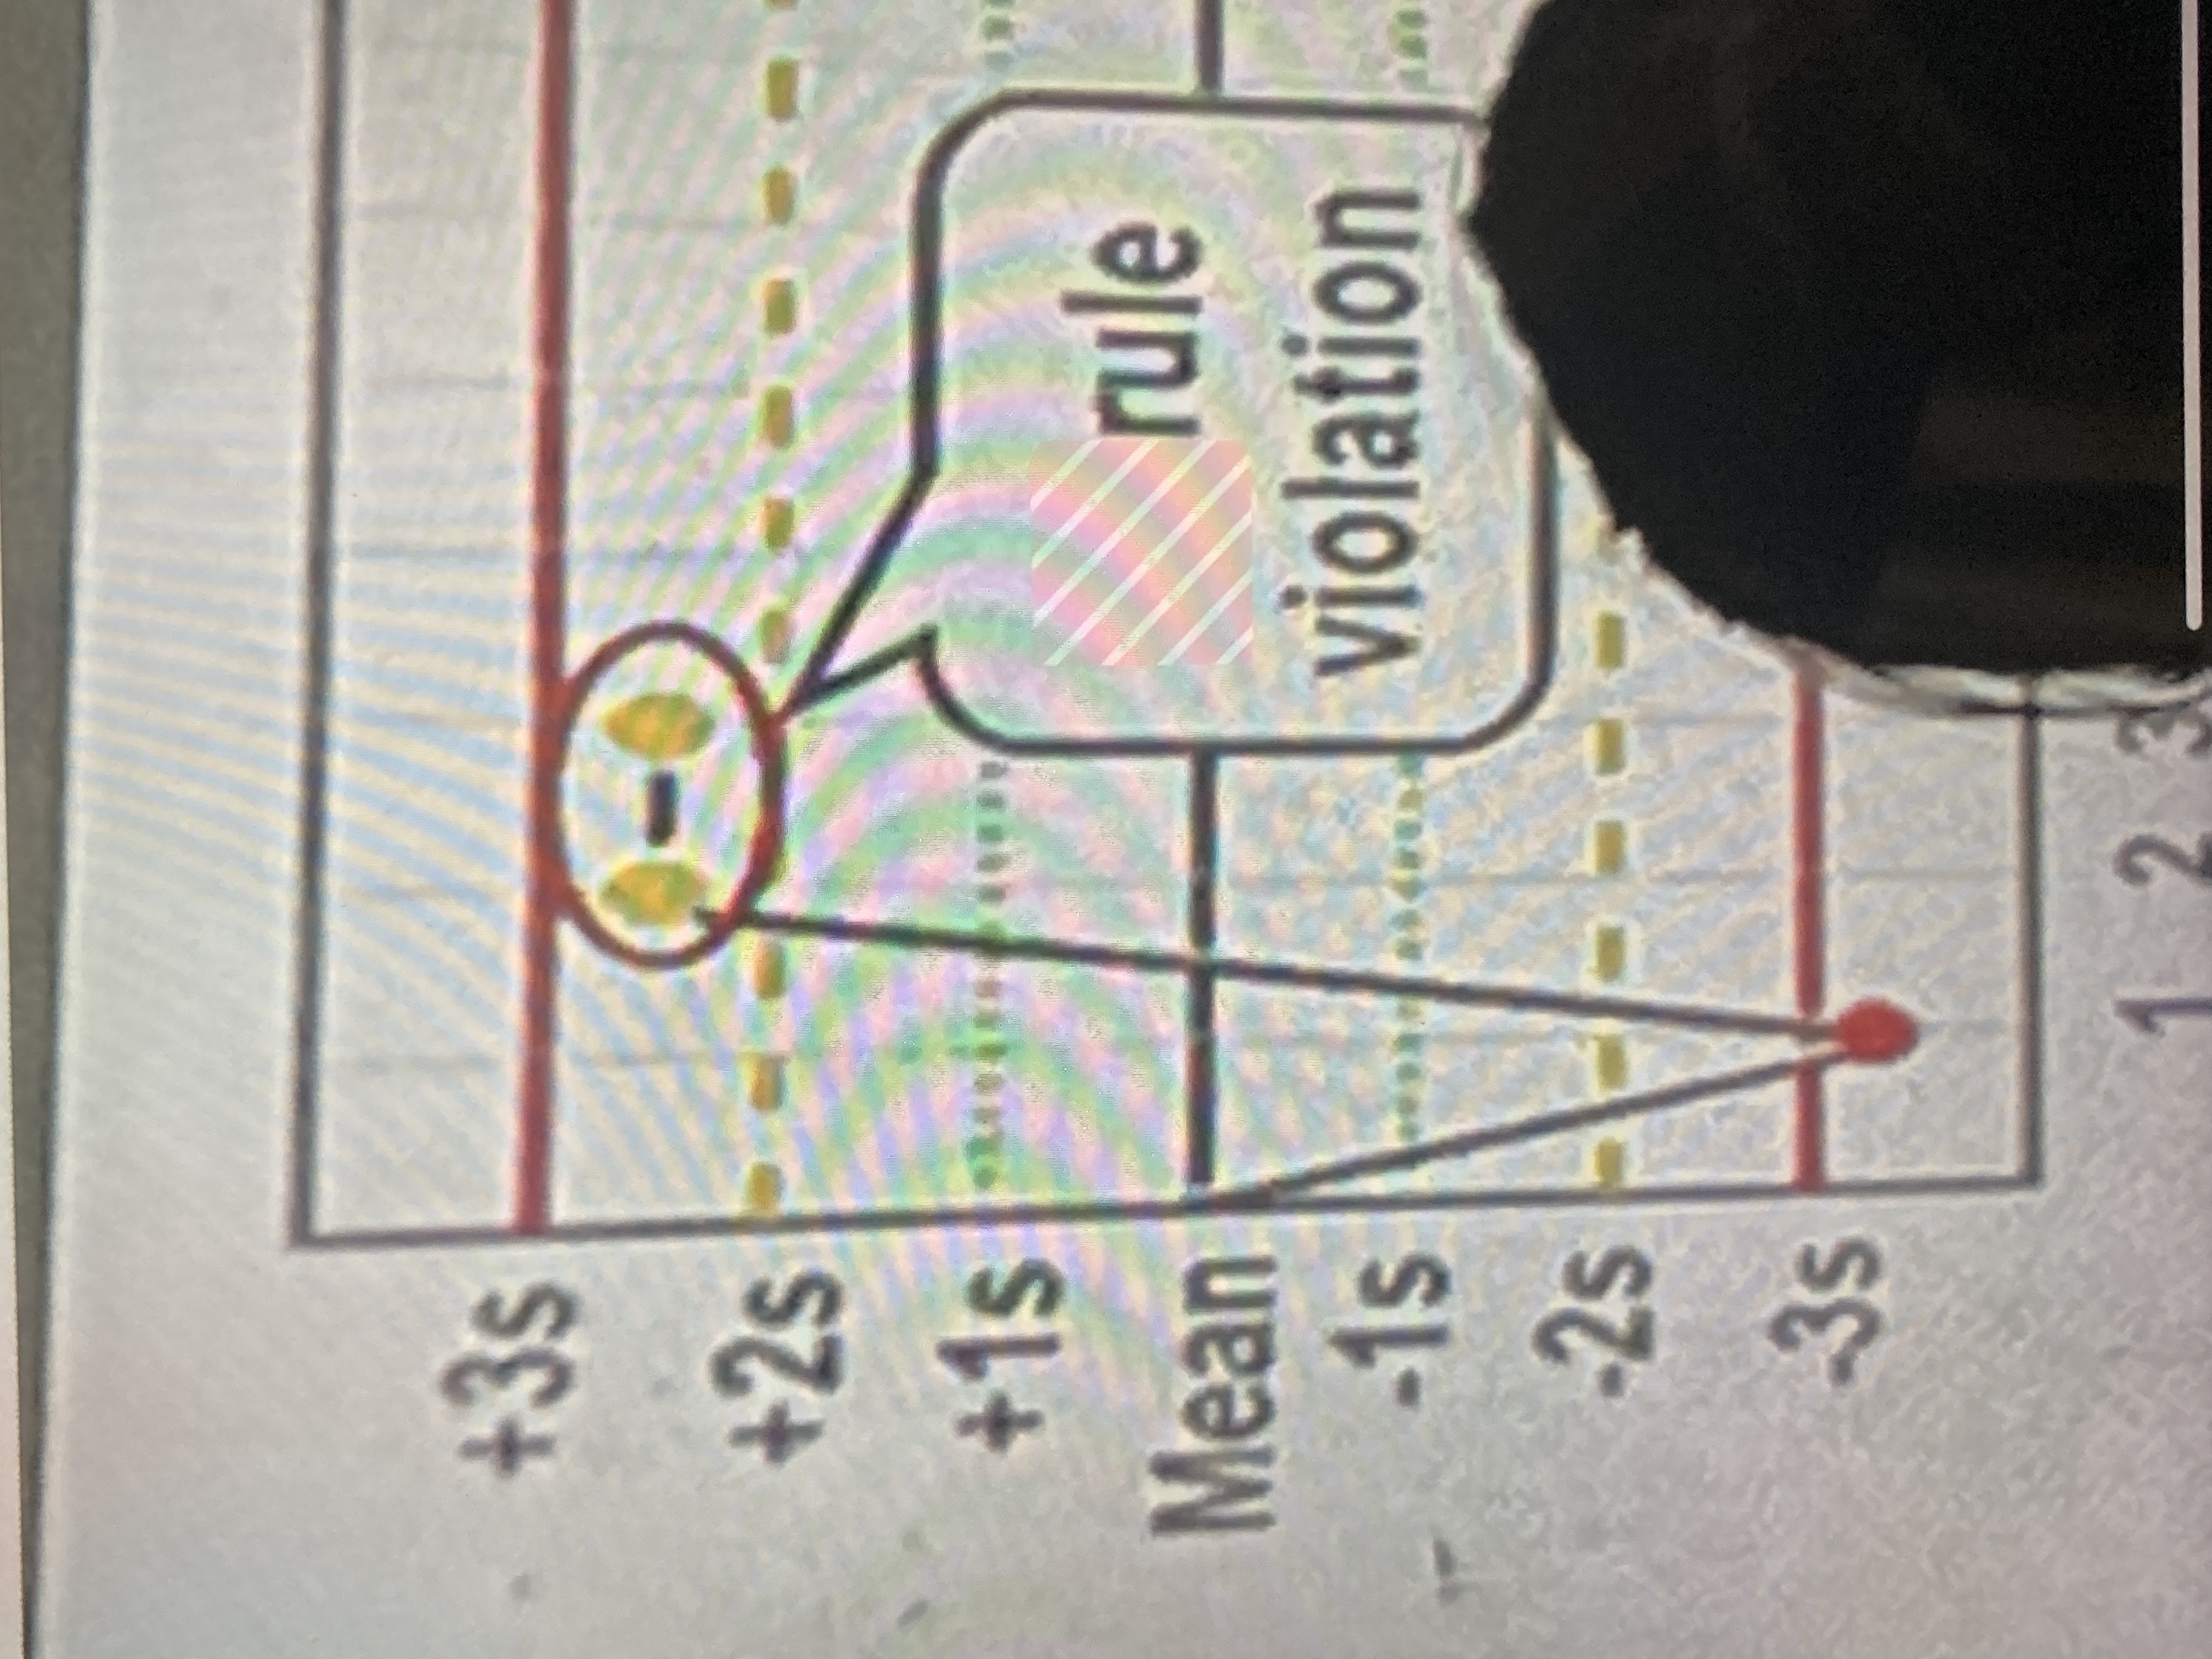
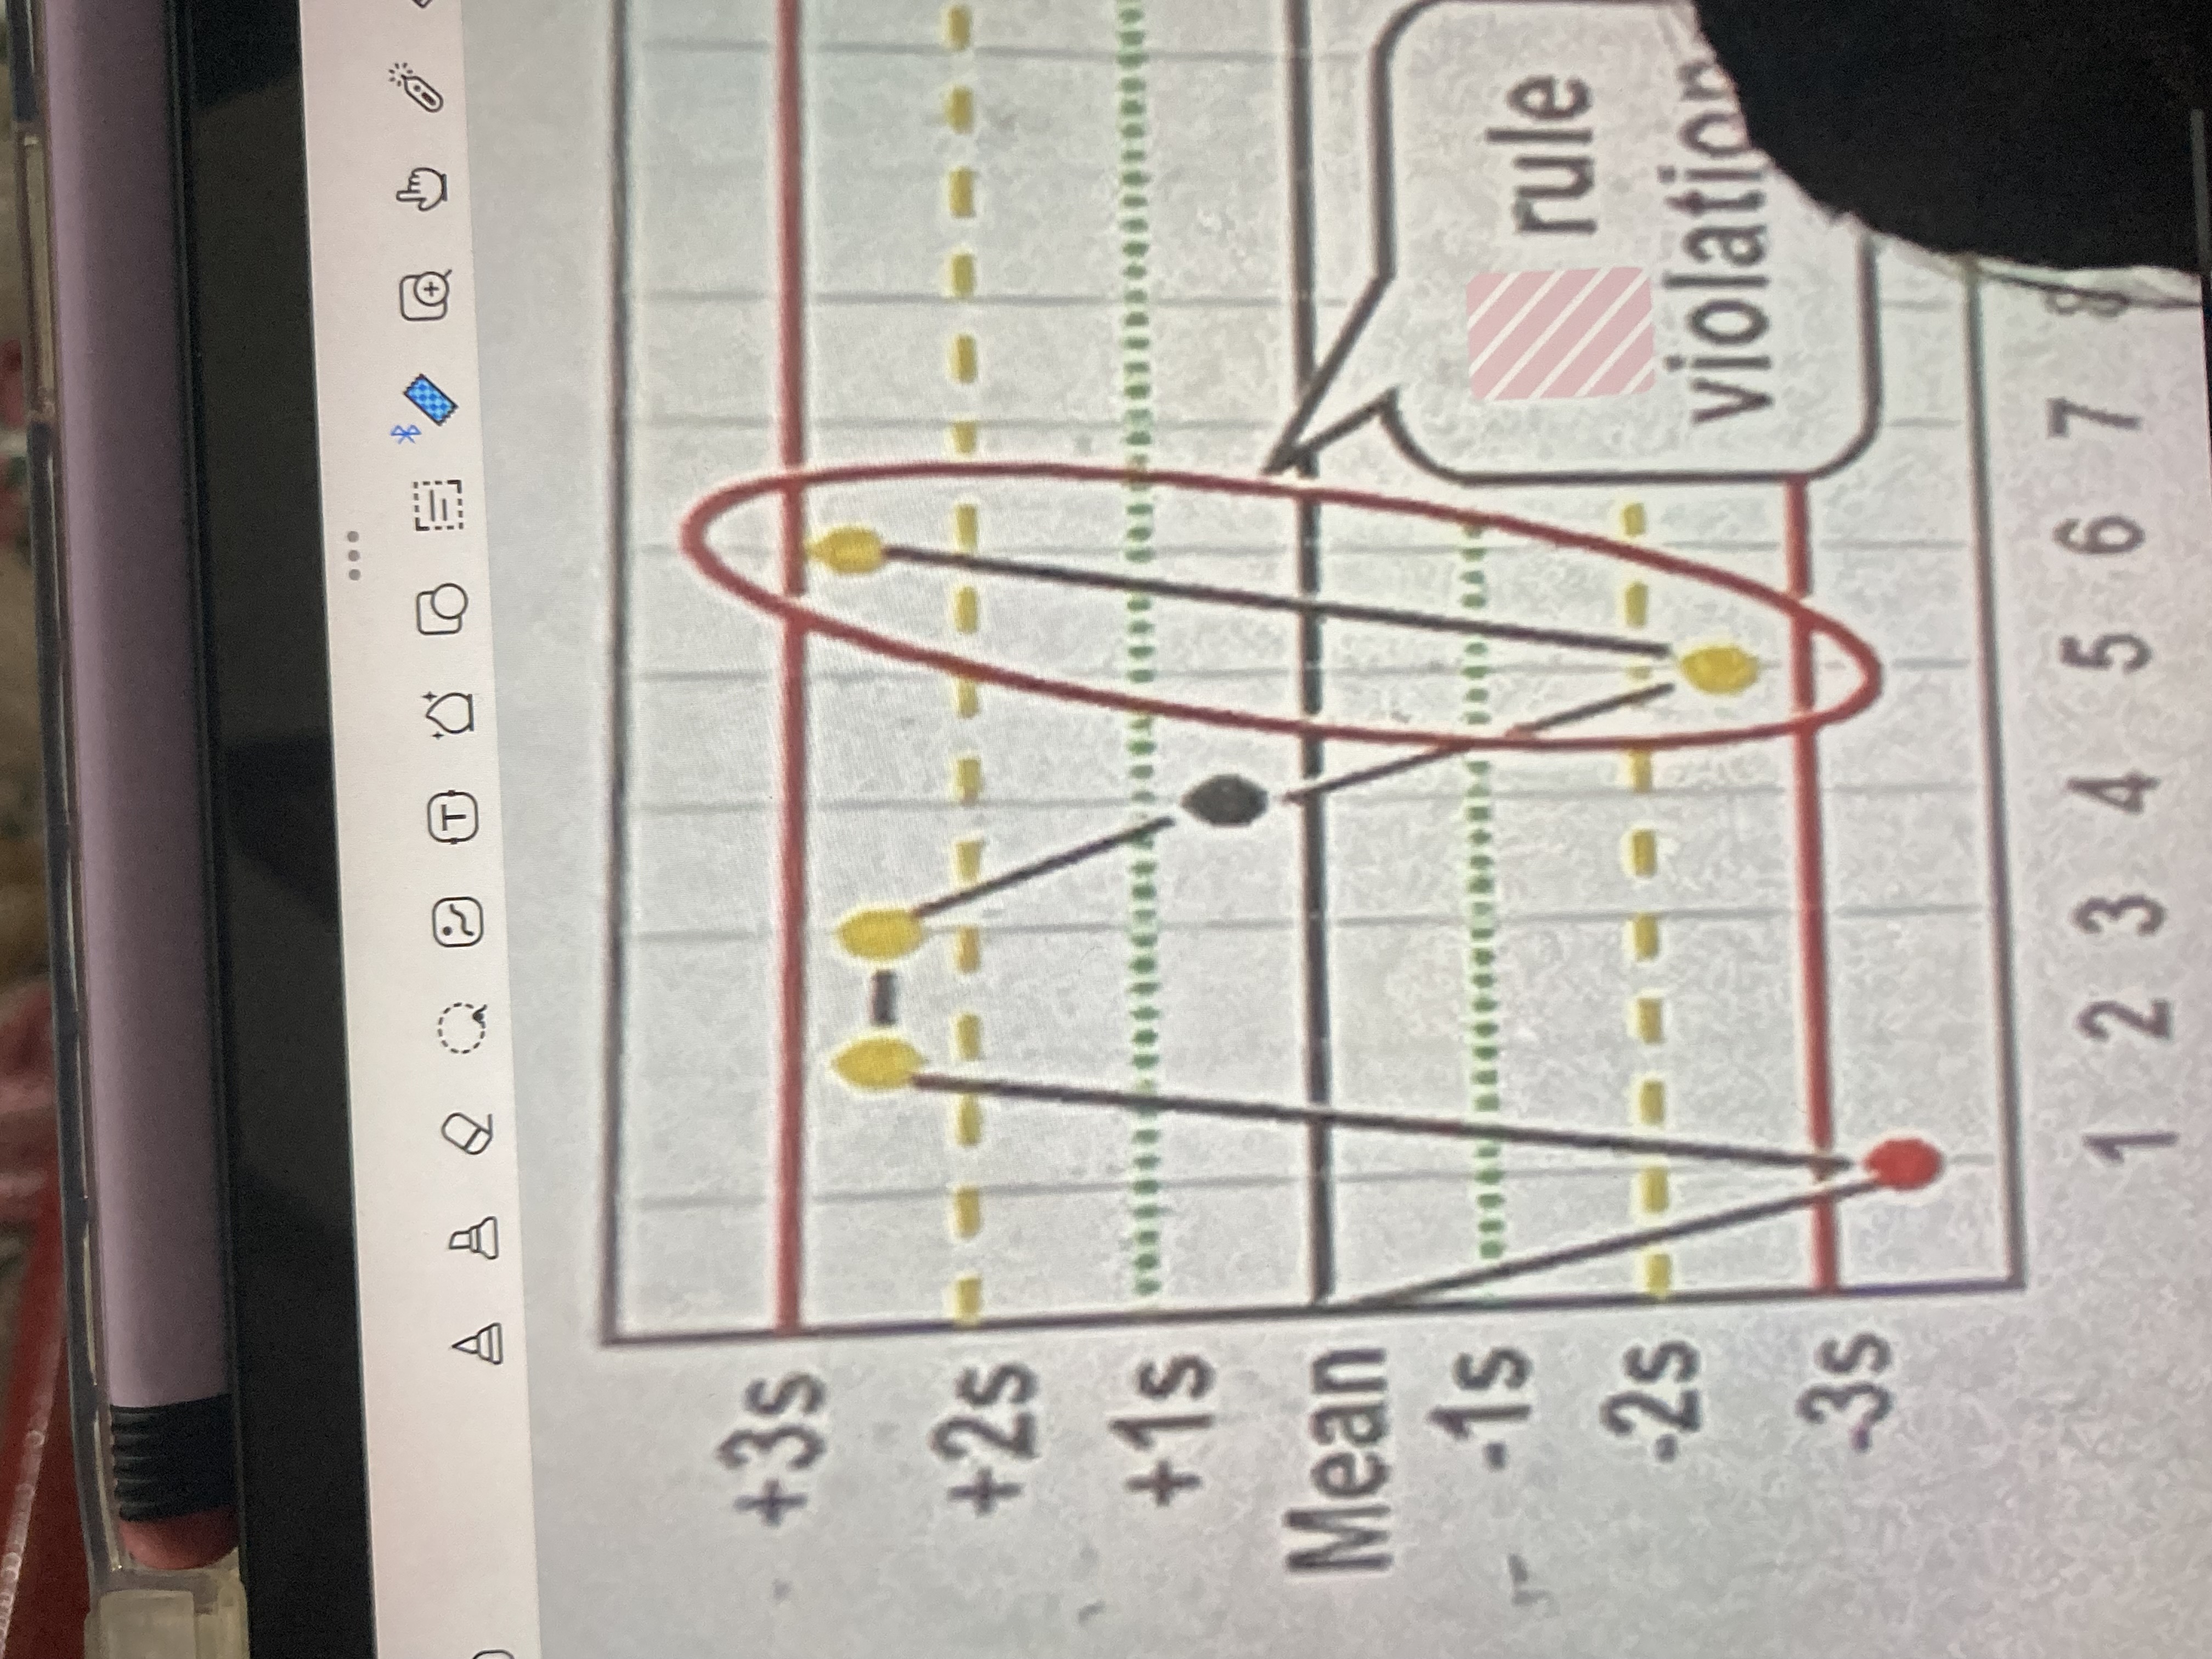
Levey-Jennings chart
Power functions
The cumulative sum (Cusum) method
trend line analysis
methods in quality assessment
12s
one measurement exceeds 2 standard deviations either above or below the mean of the reference range
13s
one measurement exceeds 3 standard deviations either above or below the mean of the reference range
22s
2 consecutive measurements exceed 2 standard deviations of the reference range, and on the same side of the mean
R4s
2 measurements in the same run have a 4 SD difference (such as 1 exceeding 2 above, and another 2 below)
41s
4 consecutive measurements exceed 1 standard deviation on the same side of the mean
10x
10 consecutive measurements are on the same side of the mean
12s
13s
22s
R4s
10x