econ calculations for paper 3 (micro and macro)
1/41
There's no tags or description
Looks like no tags are added yet.
Name | Mastery | Learn | Test | Matching | Spaced | Call with Kai |
|---|
No analytics yet
Send a link to your students to track their progress
42 Terms
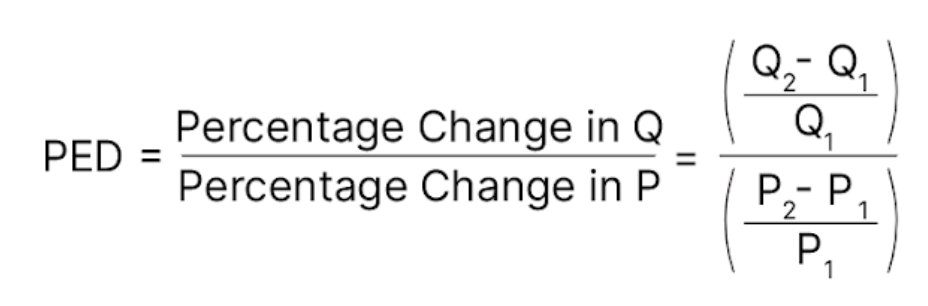
PED
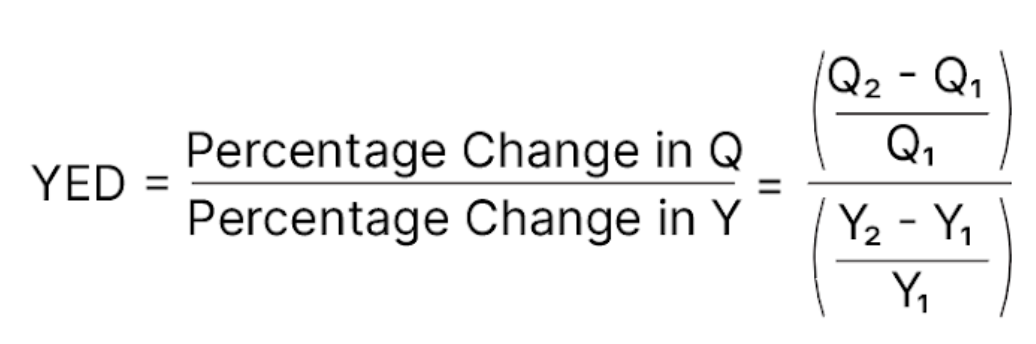
YED
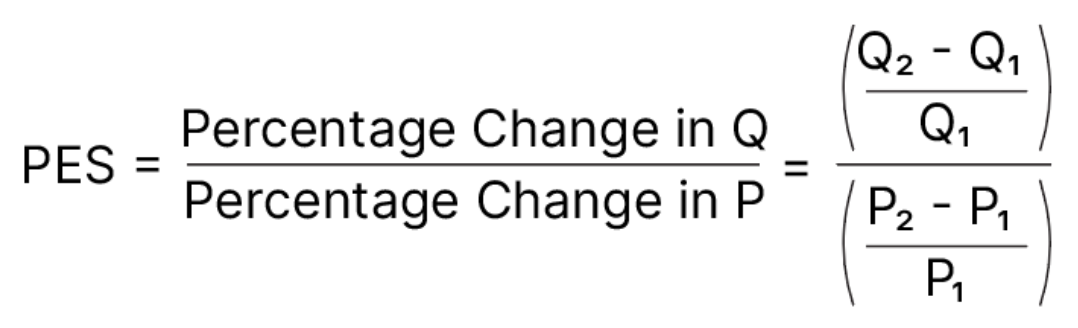
PES
profit
total revenue - total costs
abnormal profit
average revenue (AR) > average costs (AC)
normal profit
AR = AC
loss (negative profit)
AR < AC
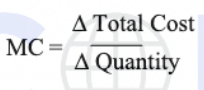
Marginal cost (MC)
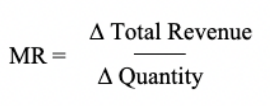
Marginal revenue (MR)
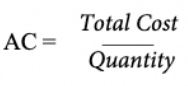
Average cost (AC)
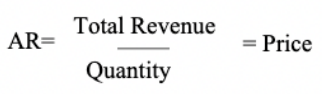
Average revenue (AR)
Total cost (TC)
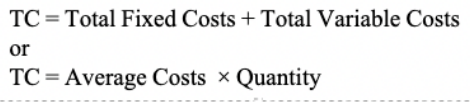
Total revenue (TR)
price x quantity
profit maximisation quantity
when MC = MR
revenue maximisation
when MR = 0
allocative efficiency
demand (MB) = supply (MC)
MSB = MSC
P = MC
productive efficiency
AC = MC (minimum point on AC curve)
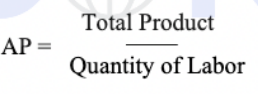
average product (AP)
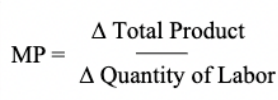
marginal product (MP)
marginal utility
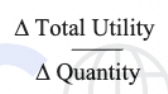
average utility
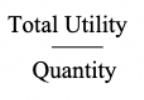
utility maximisation
marginal utility = 0
social cost
private costs + external costs
social benefit
private benefit + external benefit
GDP/AD
C + I + G + (X - M)
nominal GDP
quantity of goods and services produced x current prices
Real GDP
(nominal GDP/price deflator*) x 100
*CPI
GDP deflator
(nominal GDP/real GDP) x 100
GNI
GDP + net income from abroad (income from abroad - income sent abroad)
GDP per capita
GDP/total population
unemployment rate
(unemployed*/labour force*)x100
*unemployed - looking for a job but not employed
*labour force - unemployed and employed
index number (CPI)
(current value/raw value (in base year)) x100
percentage change
((final - original)/original) x100
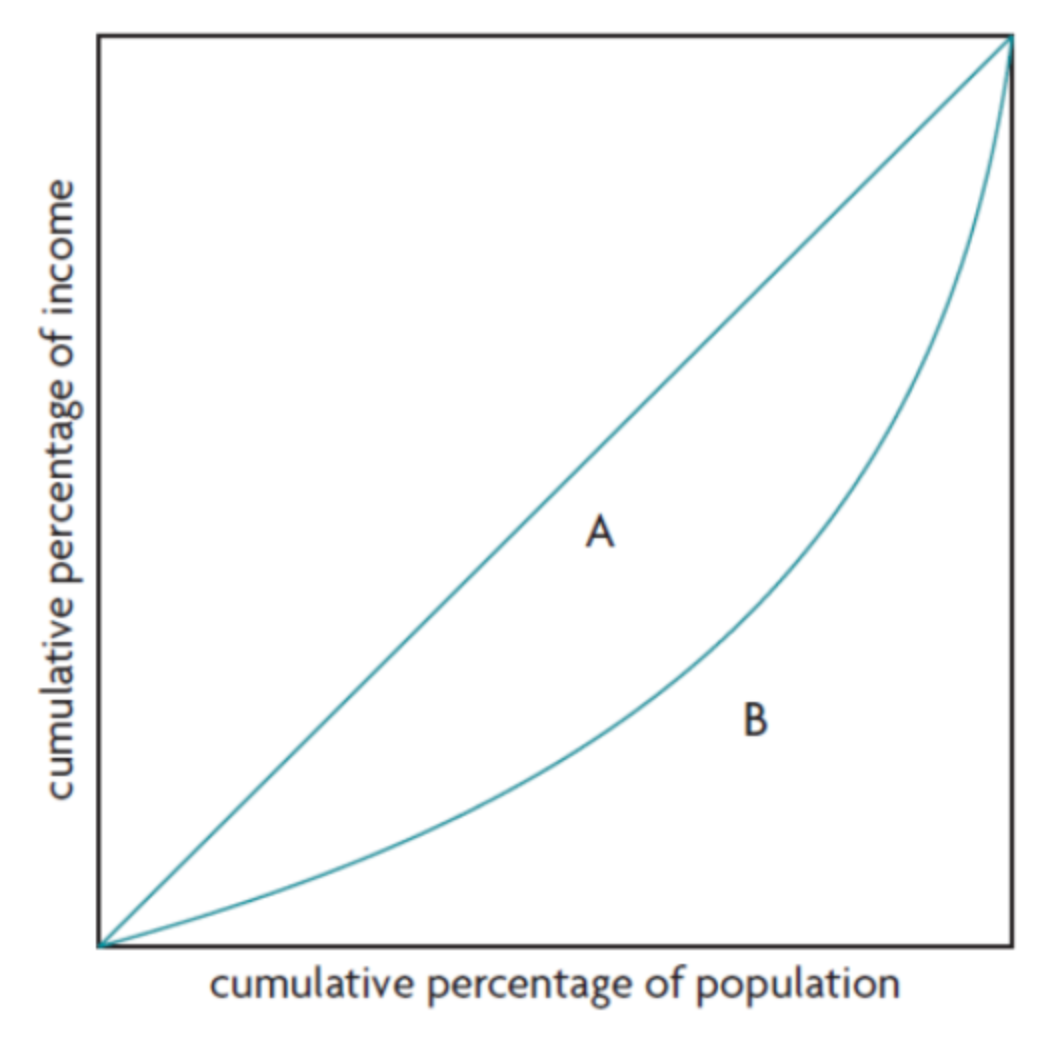
gini coefficient
area between lorenz curve and line of perfect equality (A)/area under line of perfect equality (A+B)
rate of economic growth
((GDP 2 - GDP 1)/GDP 1) ×100
inflation rate
((CPI 2 – CPI 1)/ CPI 1) x 100
construct a lorenz curve from income quintile data
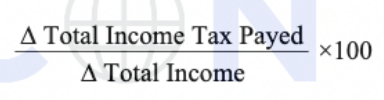
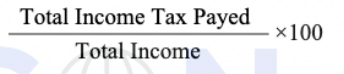
average tax rates
real interest rate
nominal interest rate - rate of inflation
% change in real income/purchasing power
% change in nominal income - % change in the price level/inflation rate
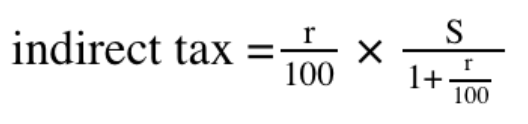
indirect tax
r = tax rate, S = amount available for purchases
marginal tax rate