Unit 3 Managing human population
1/25
There's no tags or description
Looks like no tags are added yet.
Name | Mastery | Learn | Test | Matching | Spaced | Call with Kai | Chat |
|---|
No analytics yet
Send a link to your students to track their progress
26 Terms
What’s the formula for population density?
total population/land area
# of ppl per km²
What’s the formula for intrinsic growth rate?
dN/N0
dN = (births + immigration) - (deaths + emigration)
N0 = original population
What is doubling time and its formula?
period of time required for a population to double in size
Rule of 70: 70/percent
How can environmental factors impact population density + distribution?
natural resources, geographic & climatic factors
Large, flat lowland plains are easier to access + better for food production than mountainous areas
Areas w/ few extreme weather events are more appealing
Areas w/ fertile soil like river deltas tend to have higher populations than areas with high rainfall (leached soil) & cold areas with permafrost
A secure water supply
Areas w/ a wealth of natural resources
How can economic factors impact population density + distribution?
Agriculture is a primary industry & is manufactured by a secondary industry
These increase job opportunities & standard of living, causing population growth
Areas w/ good transport links are often more densely populated due to trade links
How can political factors impact population density + distribution?
Government policies have an impact on population density
Can encourage/discourage investment in an area
War is a ‘push’ factor & causes out migration + decrease in food production
How does high infant mortality rates in LICs impact birth rates?
causes high birth rates
Due to: spread of disease & lack of both medical care + access to clean water
What’s death rate influenced by?
climate, medical facilities, living standards, & social conflict + crime rates
How does life expectancy increase?
increased standards of living, access to both clean water & nutrition, & education improvements
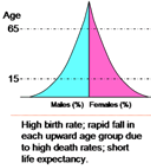
What’s a Stage 1 population pyramid?
(pre-industrial): high birth & death rate w/stable population
Rarely found & low life expectancy
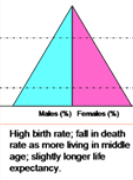
What’s a Stage 2 population pyramid?
(transitional): declining death rate (due to medicine, better nutrition, & clean water)
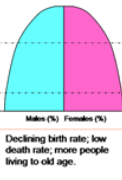
What’s a Stage 3 population pyramid?
(industrial): birth rate declines from stage 2, death is still declining/low
Less population growth than stage 2; birth rates can typically be controlled by contraceptives
Avg. life expectancy increases & mortality rates stabilize
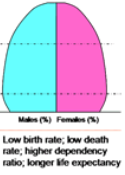
What’s a Stage 4 population pyramid?
(late-industrial): low birth & death rates
Population size fluctuates due to economic conditions; slow growth
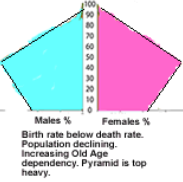
What’s a Stage 5 population pyramid?
(post-industrial): birth rate is lower than death rate
Older population reaches full life expectancy
What’s a dependency ratio?
relationship b/t a country’s working & non-working populations
Dependent: ages 0 to 14 (young)& 65+ (old)
Independent: age 15-64
What’s the formula for dependency ratio?
[young population (0 to 14) + old population (65+)] × 100 / population aged 15 to 64
Expressed as # of dependents per hundred ppl in the workforce
Considered high when it’s above 62%
How can dependency ratio decrease?
young population reaching working age
anti-natalist policy
immigration of working age ppl
lower birth rate
What’s an ageing population?
population w/ a high percentage of older people
Occur when birth rates decline & life expectancy increases — typically stage 5
Average age is increasing due to: better nutrition, sanitation, standard of living, & care
What are some impacts of an ageing population?
Shrinking workforce impact economy
Pensions may be insufficient to care for older populations - higher spending
Health care systems have more pressure since older ppl need more care
Increased retirement age, so gov’ts can collect extra taxes
What is the Club of Rome?
aims to alert the world about consequences of a rapidly growing population → focused on sustainable economic growth + limited population growth
What is UN Agenda 21?
plan of action to limit human impact on the environment
What are pro-natalist policies?
encourage ppl to have children & increase birth rates
What are some examples of pro-natalist policies?
Shrinking populations pressure a country’s workforce + financial stability
Monetary incentives, childcare assistance, free schooling, & monthly grants
What is anti-natalist policy?
discourage ppl from having children & decrease birth rates
What are some examples of anti-natalist policy?
Increasing populations that cause declining mortality rates & high rates of poverty
e.g) China’s One Child Policy
Other policies include:
encouraging marriage later in life
increasing access to contraceptives & family planning
improving education + employment opportunities for women
making abortions legal + safe
What’s a limitation of anti-natalist policy?
Can cause an ageing population + declining workforce