Edwards lessons research methods
1/17
There's no tags or description
Looks like no tags are added yet.
Name | Mastery | Learn | Test | Matching | Spaced | Call with Kai |
|---|
No analytics yet
Send a link to your students to track their progress
18 Terms
What’s the purpose of statistical tests?
To determine if a study's results are statistically significant, and at what probability, (real, and not due to chance) or non-significant (likely a random occurrence)To
What is the only stats test you need to know how to do?
The sign test
How do you conduct the sign test? (Step one)
In the data table given to you in the exam, calculate the difference in the two conditions for each participant and write down the sign for this (+, - or nothing)
What is the formula for finding S and N in the sign test? (Part 2)
Using the values in the table:
The value of S is the number of the least frequent sign.
The value is N is the number of participants, ignoring any with a 0 sign.
How is the critical value calculated? (Part 3)
It is calculated using the table of critical values - this is given to you in the exam.
Using these results, how do you know if significance is achieved? (Part 4)
For significance to be achieved, the value of S must be EQUAL or LESS THAN the critical value.
If the results aren’t significant, the hypothesis must be rejected.
What are the different levels of probability? (This is the amount of error allowed in the experiment)
0.01 (1%) - won’t affect results, but too strict
0.05 (5%) - compromise, not to strict and not too much error
0.1 (10%) - too much error allowed
Unless told otherwise in the exam, which probability level should you always go for? (Part 5)
0.05 (5%)
In the sign test, what are directional and non-directional hypotheses referred to as? (Part 6)
One tailed test (directional)
And two tailed test (non-directional)
What is a type 1 hypothesis error? (Part 7)
“Error of optimists” - when the results happened by chance, when using a 0.1 level of significance.
What is a type 2 hypothesis error? (Part 8)
“Error of pessimists” - when results didn’t work because you’ve been too strict, 0.01 level of significance.
Some stats tests are referred to as parametric. What does this mean?
They use data within parameters.
These are better tests.
Table for how to work out the when to use the other stats tests
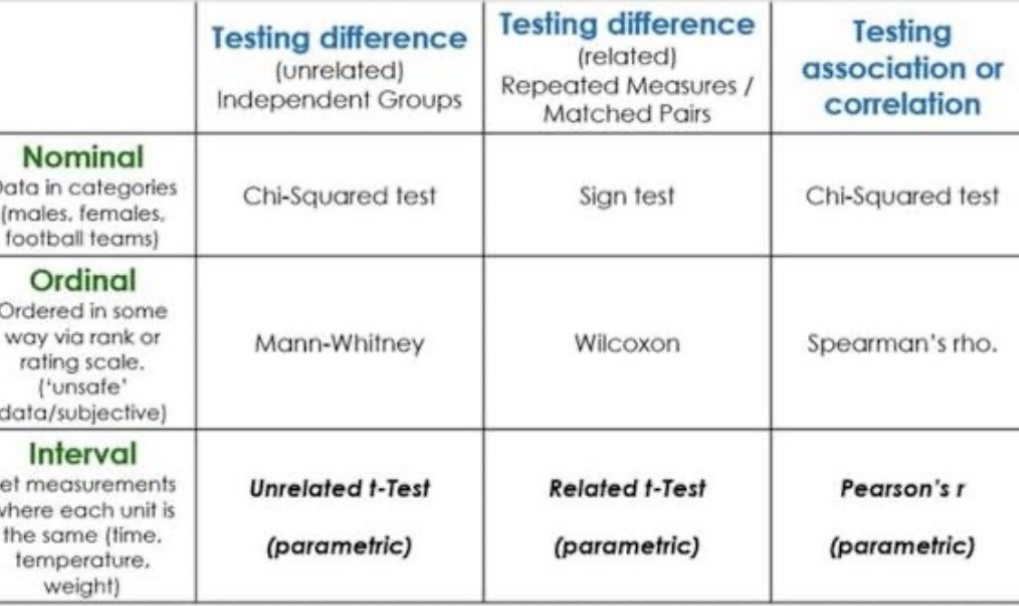
Lexi Anagram for this

What is the difference between related and unrelated data in psychology?
Related data - data points taken from the same sample.
Unrelated data - data points taken from different samples.
What’s a null hypothesis?
Predicting the opposite effect to previous research will happen in an experiment.
What are the advantages and disadvantages of the experimental designs?
Independent groups (worst one) -
Quick and easy, no order effects, avoids demand characteristics
Individual differences
Repeated measures (middle one) -
Removes individual differences
Order effects
Matched pairs (best one) -
No order effects
Slightly time consuming
What are the three different types of data?
Nominal - catagorised data (eg hair colour, gender)
Ordinal - catagorised data that is ordered on a scale, but the size of the unit isn’t designed (eg strongly agree, fear of snakes 1 to 10)
Interval - data that has a clear order and differences between measurements on a defined scale, but lacks a true zero (eg height, time, temperature)