Statistics
0.0(0)
0.0(0)
Card Sorting
1/15
Earn XP
Description and Tags
Some statistics :)
Study Analytics
Name | Mastery | Learn | Test | Matching | Spaced | Call with Kai |
|---|
No study sessions yet.
16 Terms
1
New cards
Categorical data
Data that doesn't require numbers, eg. Which ice cream flavour is your favourite.
2
New cards
Ordered data
Sub category of categorical data that requires an answer from a set of answers eg. What year are you in.
3
New cards
Unordered data
Sub category of categorical data that doesn’t require a specific answer eg. What's your favourite colour.
4
New cards
Numerical data
Data comprised of numbers eg. What age are you.
5
New cards
Discrete data
Numerical data that can only take certain values, eg. any question starting with "How many".
6
New cards
Continuous data
Numerical data that can take any value, ie. anything you measure, such as height, weight, etc.
7
New cards
The Mean
The sum of numbers over the amount of numbers.
8
New cards
The Median
The middle number in a ranked set of data. Formula: (n+1)÷2= number to count to to find the median.
9
New cards
The Mode
The most common data frequency.
10
New cards
Outlier
A statistic that is far away from the others, eg. counting the teacher's age when trying to find the average age of a class.
11
New cards
The Range
Highest statistic minus the lowest statistic.
12
New cards
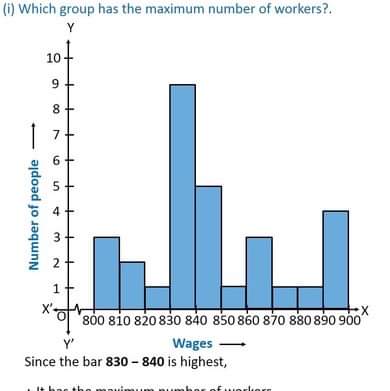
Histograms
Like a bar chart except there are no gaps between the bars. Best for continuous data.
13
New cards
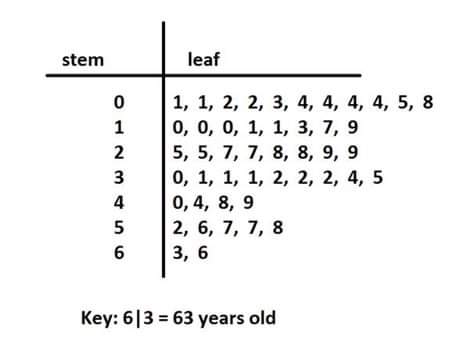
Stem and leaf plot
Displays numerical data.
14
New cards
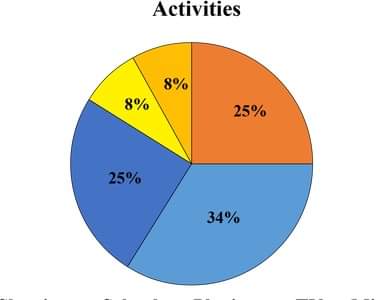
Pie charts
A circular chart presenting data as sectors of the circle. The bigger the angle in a sector, the more frequent that data is.
15
New cards
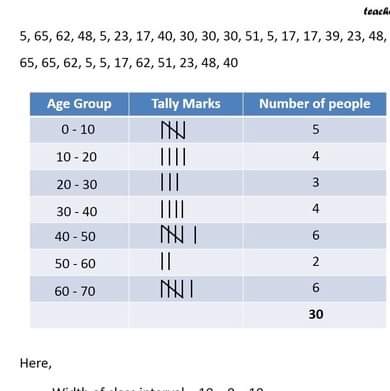
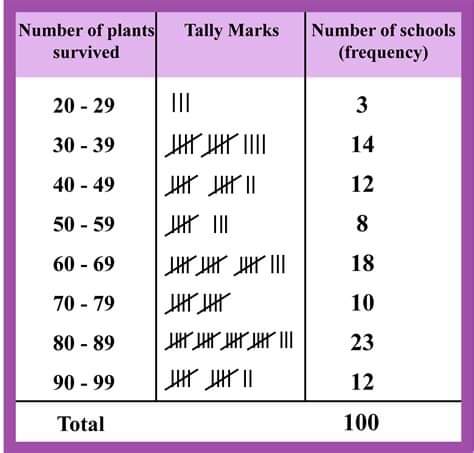
Frequency tables
A chart that shows the classes of data and the amount of each class. Can be grouped, eg 10-20.
16
New cards
Mean of grouped frequency tables
When finding the mean of grouped frequency tables and finding the sum of the numbers, find the mid-interval value of each class. Multiply the mid interval values of each class by the amount in each class. Add up the totals and put them over the amount of the numbers.