TOPIC #5: Linear model
1/18
Name | Mastery | Learn | Test | Matching | Spaced | Call with Kai |
|---|
No analytics yet
Send a link to your students to track their progress
19 Terms
When can you use a linear regression?
Given bivariate data (x,y)—> meaning that the data involves a pair of variables, and the research question is (is y linearly related to x?)
What are the steps to a linear regression?
Produce a scatterplot
calculate the correlation coefficient
produce a regression line
produce a residual plot
check assumptions
perform predictions
what does linear correlation mean?
referring to the association between two variables to describe how tightly the cloud of points cluster around a line through the centre.
what does it mean if there is a strong linear correlation?
the cloud of points are tightly clustered around a line and this allows for good predictions of 1 variable (y) from the other (x).
What does it mean when one variable tends to increase with the other?
We have a positive association.
what does it mean when one variable tends to decreases with the other?
we have a negative association.
what is the correlation coefficient?
(r ), is a numerical summary which measures the clustering of points around a line and can indicate both the sign and strength of the linear association. (the correlation coefficient is between -1 and 1)
what does it mean if r is positive
the cloud/clustering of points, slopes up
what does it mean if r is negative
the cloud slopes down
what does it mean if r gets closer to +- 1?
the points cluster more tightly around the line.
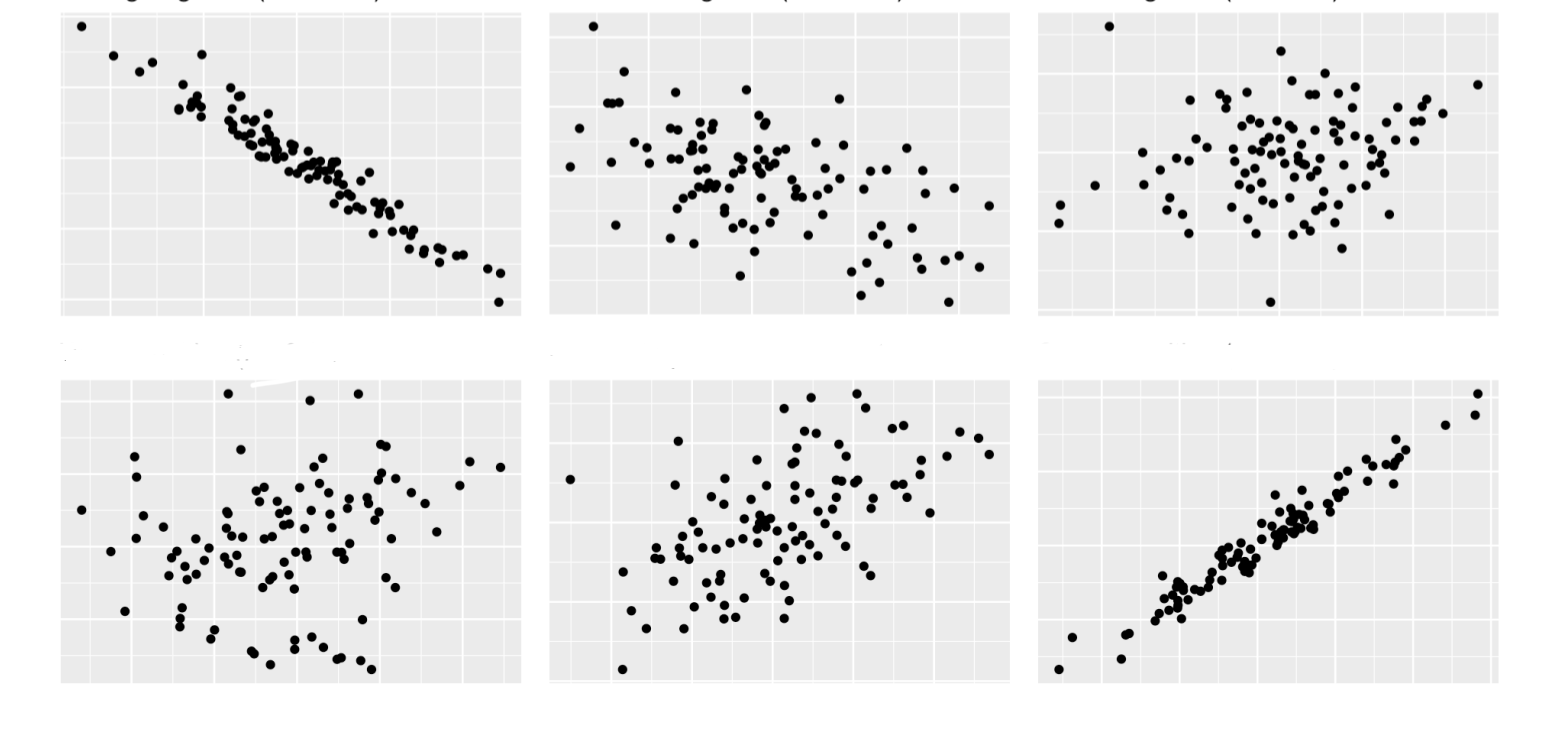
Describe each graph.
Strong negative
moderate negative
weak negative
weak positive
moderate positive
strong positive
what is the population correlation coefficient
(rpop) is the mean of the product of the variables in standard units
what are the properties of the correlation coefficient?
value (lies between -1 and 1)
symmetry (correlation coefficient is not affected by interchanging the variables)
scaling (correlation coefficient is shift and scale invariant)
how do you find the optimal line for predicting values in a linear model
using a regression line
what is a regression line?
a straight line that best fits a set of data points, and it's used to predict one variable from another.
the regression line connects (x, y) to (x + SDX, y + rSDy)
What is a residual?
the vertical distance or gap of a point above and below the regression line. A residual represents the error between the actual value and the prediction.
What is a residual plot?
A residual plot graphs the residuals (on the vertical axis), vs x or the fitted values y (on the horizontal axis).
If a linear regression is appropiate for the data, what should the residual plot show?
No pattern, it should be random about a horizontal line at 0 and homoscedasticity (meaning it has a constant variance within vertical strips along the x axis)
does correlation measure causation?
no, it measures association, however association does not mean causation.