AP Pre-Calculus Concepts and Functions Unit 1-2
1/88
There's no tags or description
Looks like no tags are added yet.
Name | Mastery | Learn | Test | Matching | Spaced | Call with Kai |
|---|
No analytics yet
Send a link to your students to track their progress
89 Terms
Sequence
A discrete set of points (not continuous) whose domain is whole numbers (0,1,2,3...)
Arithmetic Sequence
Terms have a common difference d and behave like linear functions.
Geometric Sequence
Terms have a common ratio r; to get ratio divide second term by first or divide third term by the second.
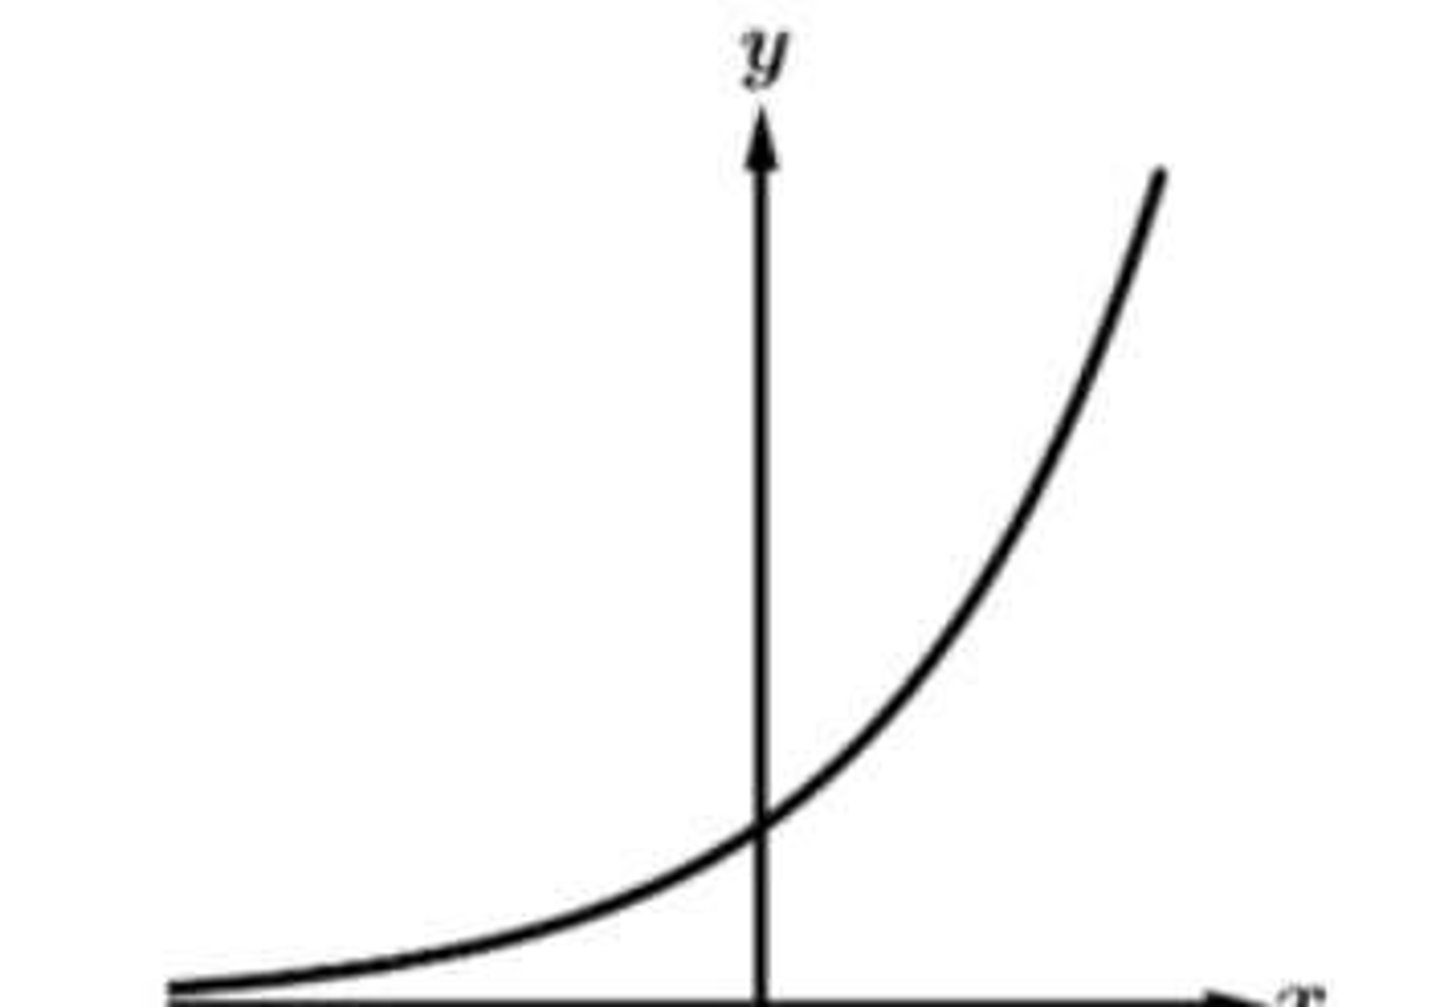
Exponential Functions
Functions of the form f(x) = ab^x where a > 0 and b > 1.
Exponential Growth
Always increasing or decreasing, with a horizontal asymptote y = 0 unless shifted vertically.
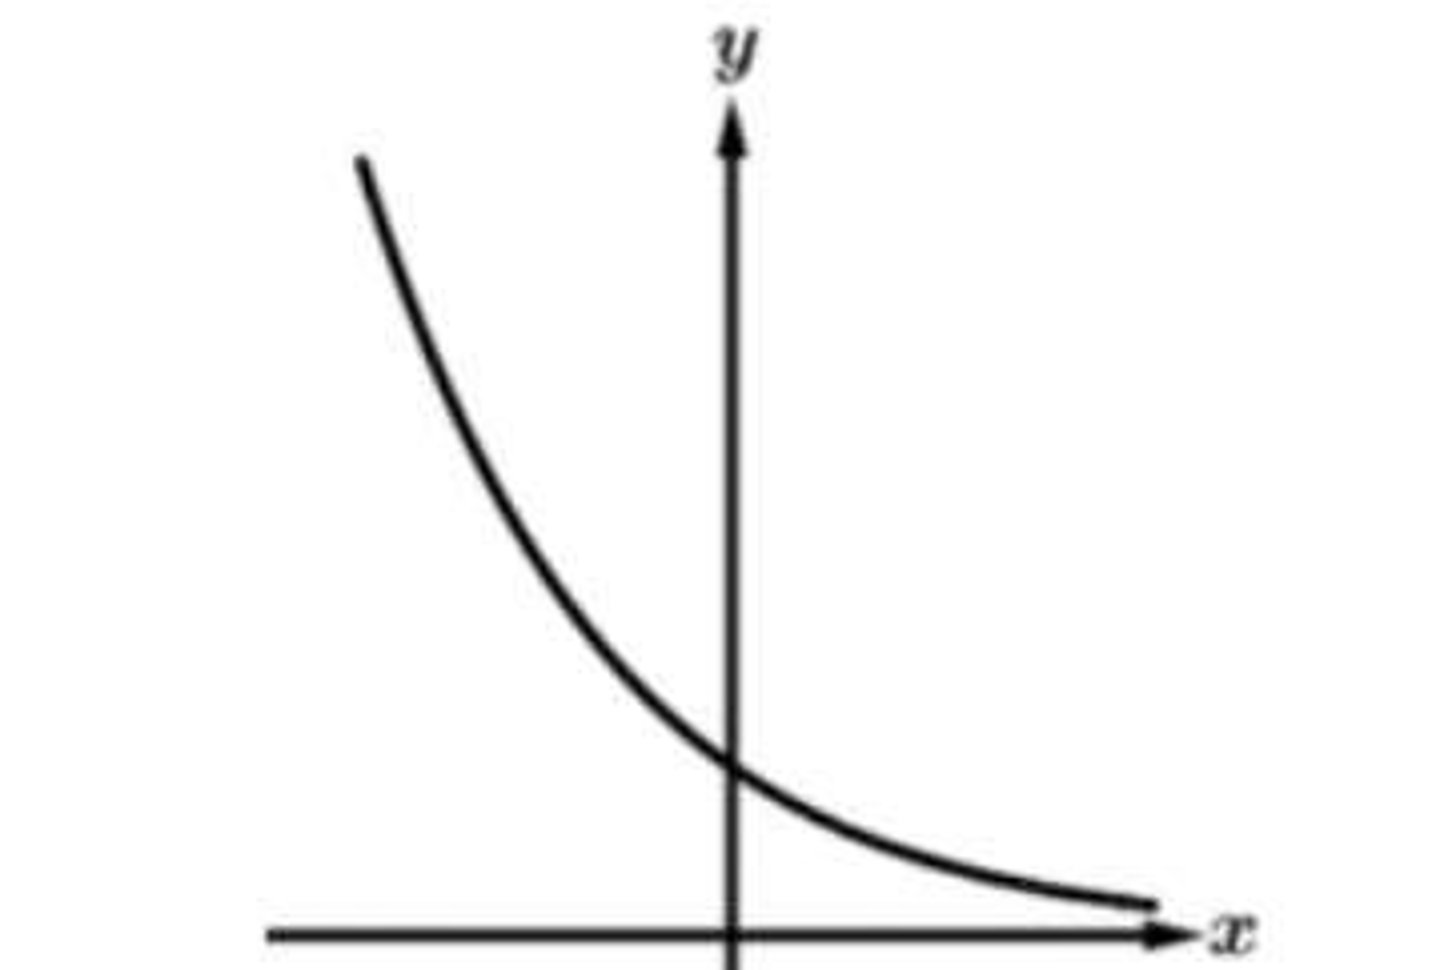
Exponential Decay
Functions of the form f(x) = ab^x where a > 0 and 0 < b < 1.
Exponent Rules
bm . bn = bm+n; (bm)n = bm.n; 1/bm = b-m; 1/bk = b-k.
Transformations of Exponential Functions
Reflections and translations will affect the graph.
Function Modeling
If the function has been vertically translated, you will not see the proportional difference; you will have to add/subtract a constant to see the proportional growth.
Residuals
Residual = Actual value - Predicted Value; if the residual is negative the predicted value is an over-estimate, if positive it is an under-estimate.
Composition of Functions
Combining two functions where the output of one function becomes the input of another.
Inverse Functions
Functions that reverse the effect of the original function.
Limit of Exponential Growth
lim f(x) = 0 as x → ∞.
Limit of Exponential Decay
lim f(x) = ∞ as x → 0.
Linear Function
A function with a constant rate of change.
Quadratic Function
A function with a constant second difference.
Exponential Function Characteristics
Inputs are linear, outputs are proportional.
Base of Exponential Growth
The base is larger than 1.
Base of Exponential Decay
The base is between 0 and 1.
Horizontal Translation
Every horizontal translation can be re-written as a vertical dilation.
Vertical Dilation
A change in the vertical stretch or compression of a graph.
Constant Rate of Change
The rate of change in a linear function.
Composite Function
f(g(x)) = (fog)(x)
Domain of g(x)
The domain for g(x) is x ≥ 0
Domain of f(g(x))
The domain for f(g(x)) is x ≥ 1
Composite Function Domain
The domain for the composite function is [0,1)U(1,∞)
Inverse Function Notation
Given a function f(x), its inverse is notated by f-¹(x)
Invertible Function
For a function to be invertible it must be one-to-one (pass the horizontal line test)
Inverse Function Graphs
Graphs of inverse functions are reflections over the line y = X
Domain and Range of Inverses
The domain and range of a function and its inverse are swapped.
Composition of Function and Inverse
The composition of a function and its inverse should equal x: ƒ (ƒ−¹(x)) = x
Finding Inverse Steps
1) Replace f(x) with y 2) Switch x and y 3) Solve for y
Logarithmic to Exponential Form
If log₁ c = a then bª = c
Base of Logarithm
If there is no base listed, the base is 10
Evaluating Logarithm
To evaluate a logarithm rewrite it in exponential form: Example log₂ 8 is rewritten as 2x = 8 which equals 3
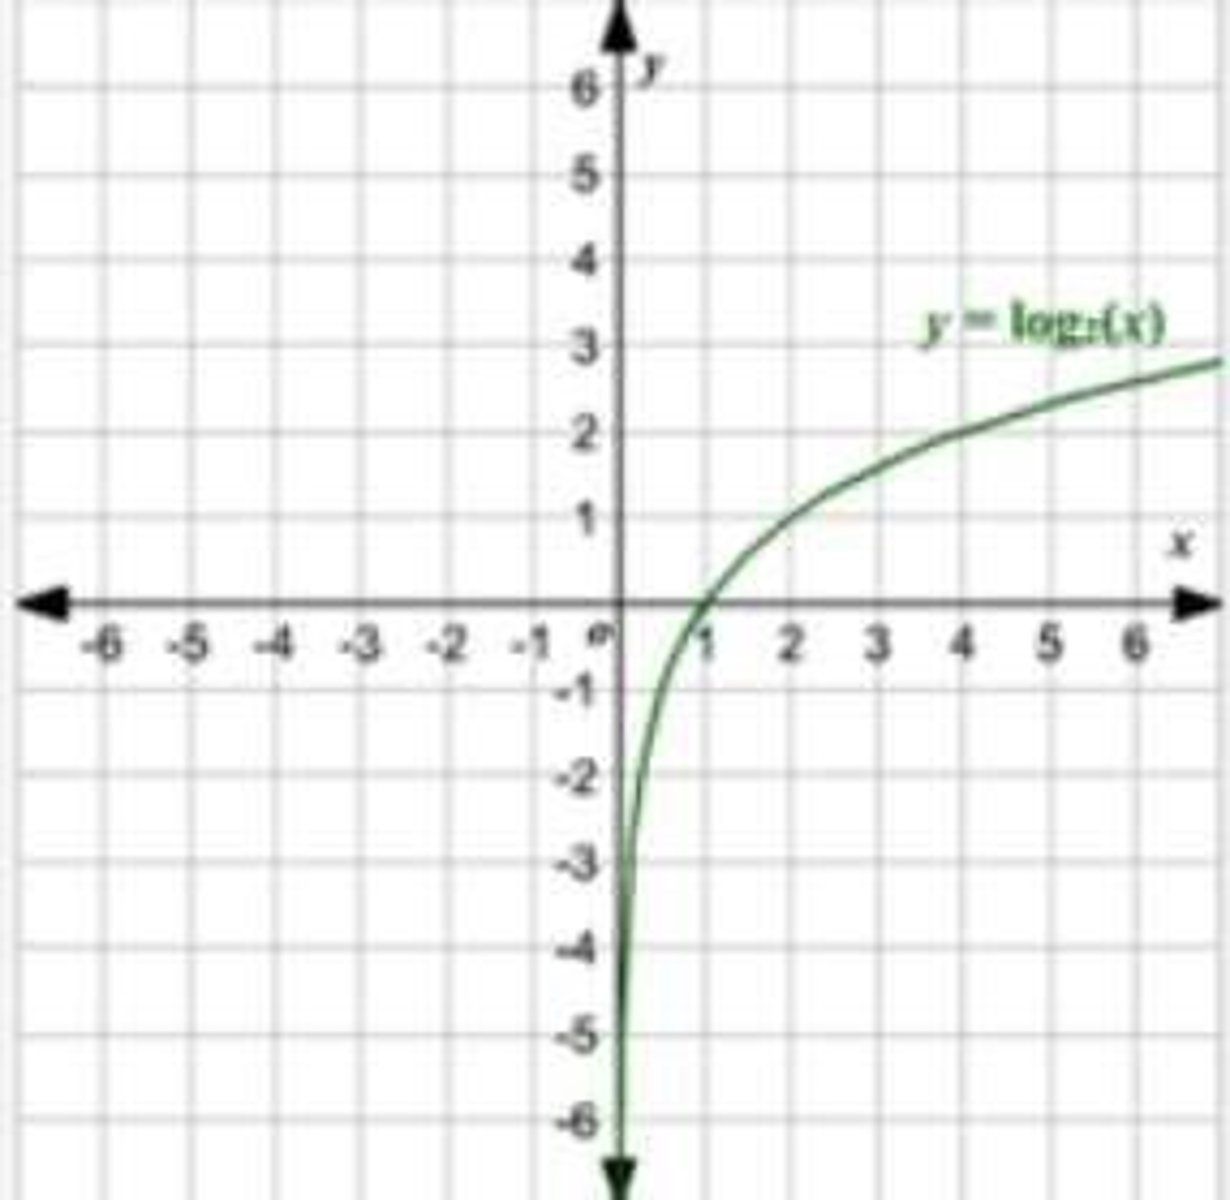
Inverse of Exponential Functions
Logarithms are the inverse of exponential functions
Composition of Functions
If f(x) = bx and g(x) = logb x then f(g(x)) = g(f(x)) = x
Domain of Exponential Functions
Domain of the exponential is the range of the logarithm.
Range of Exponential Functions
Range of the exponential is the domain of the logarithm.
Vertical Asymptote
Has a vertical asymptote x = 0
Logarithmic Data
Logarithmic data will have inputs that are proportional and outputs that are linear - Reverse of exponential data
Logarithmic Properties
logb (xy) = log₁ x + logb y
Change of Base Formula
Change of base = log₁x / loge
Solving Logarithmic Equations
Always check for extraneous solutions (Can't take the log of zero or a negative number)
Logarithmic Inequalities
Create a sign chart and determine if solution is in the domain of the given inequality
Exponential Function Linearization
Given f(x) = ab^x, the linearization of that function is logn y = logn b * x + logn a
Rate of Change
If the rate of change of a function is positive the graph is increasing. If the rate of change is negative the graph is decreasing. If the rate of change is increasing the function is concave up. If the rate of change is decreasing the function is concave down.
Average Rate of Change
The average rate of change visually is the slope of a secant line.
Instantaneous Rate of Change
The instantaneous rate of change visually is the slope of the tangent line.
Methods to Approximate Instantaneous Rate of Change
1. If given a table or equation pick two points close together and calculate slope. 2. If given a picture, draw a tangent line and approximate the slope of that line.
Rate of Change of Linear Function
The rate of change of a linear function is constant.
Rate of Change of Quadratic Function
The rate of change of a quadratic function is the second rate of change.
Point of Inflection
A point where the graph changes concavity.
Relative (local) Extrema
Extrema means maximums and minimums. Of all the relative extrema, the greatest y value is the absolute maximum and the least y value is the absolute minimum.
Absolute (global) Extrema
The absolute maximum is the greatest y value among all relative extrema, and the absolute minimum is the least y value.
Even Functions
Even functions are symmetric about the y-axis. Proof: f(-x) = f(x).
Odd Functions
Odd functions are symmetric about the origin. Proof: f(-x) = −ƒ(x).
Extrema on Closed Interval
On a closed interval, endpoints count as maximums and minimums.
Graph Changes from Increasing to Decreasing
The graph changes from increasing to decreasing at x = c.
Graph Changes from Decreasing to Increasing
The graph changes from decreasing to increasing at x = c.
Multiplicity of Zero
How the multiplicity of zero affects the graph.
Imaginary Solutions
Solutions that are not real numbers.
Degree of a Function
How to determine the degree of a function given a table.
Number of Solutions of a Polynomial
How to determine the number of solutions of a polynomial looking at the equation.
Conjugate
If 1 + i is a solution, so is its conjugate 1 - i.
Rate of Change
Keep finding the rate of change until it becomes constant; the degree will be how many times it takes for the rate of change to be constant.
Degree of Polynomial
The degree of the polynomial determines the number of zeros. Ex: A cubic function has three zeros.
Odd Multiplicity Zero
If a zero has an odd multiplicity, the graph will cross through the x-axis.
Even Multiplicity Zero
If the multiplicity of the zero is even, the graph will be tangent to the x-axis (bounce).
End Behavior of Polynomials
The behavior of the graph of a polynomial as x approaches positive or negative infinity.
Even Degree Polynomial
If a polynomial is of even degree, the ends of the graph will go in the same direction.
Rational Function End Behavior
The behavior of a rational function as x approaches positive or negative infinity.
Slant Asymptote
When the numerator is one degree higher than the denominator, there is a slant asymptote.
Limit Notation
lim f(x) = a as x approaches +∞.
Finding Zeros of Rational Functions
Set numerator equal to zero after factoring and simplifying (assuming there was no common factor that simplified).
Vertical Asymptote
x = a is a vertical asymptote.
Determining a Hole
Cancel out a common factor and the factor is either eliminated or remains in the numerator.
Vertical Asymptote Definition
After factoring and simplifying, the denominator equals zero.
Definition of a Hole
The limit from the left equals the limit from the right, but the function is not defined at the x-value.
Limit from the Left
lim_ f(x) as x approaches a from the left.
Limit from the Right
lim f(x) as x approaches a from the right.
Transformation of Functions
y = af(b(x + c)) + d.
Vertical Dilation
a = vertical dilation (affects y values).
Horizontal Dilation
b = horizontal dilation results in a dilation by a factor of (affects x values).
Horizontal Translation
c = horizontal translation (affects x values).
Vertical Translation
d = vertical translation (affects y values).
Calculator Skills
Approach the x value from the left and from the right.
Finding Max and Mins
Finding maximum and minimum values of a function.
Calculating Zeros
Finding the zeros of a function.