P1: Basics of Proteomics and Mass Spectrometry
1/36
There's no tags or description
Looks like no tags are added yet.
Name | Mastery | Learn | Test | Matching | Spaced | Call with Kai |
|---|
No analytics yet
Send a link to your students to track their progress
37 Terms
Why is proteomics so challenging?
Complexity: DNA and RNA are structurally uniform polymers of only 4 different monomers (bases), while proteins are structurally diverse polymers of 20 different monomers (amino acids). Thus, proteomics is challenging compared to transcriptomics/genomics due to the incredible diversity of proteins and their amino acid-sequences.
Signal strength: DNA and RNA signals can be amplified by PCR or other polymerase reactions, while proteins cannot be amplified. Additionally, they are present across a large dynamic range in biological samples (i.e. some are present in very large quantities while others are present in very small amounts).
Mass-spectrometry
Mass spectrometry (MS) is an analytical technique used to determine the mass-to-charge ratio (m/z) of molecules, primarily for identifying and quantifying compounds such as proteins, peptides, metabolites, and small molecules.
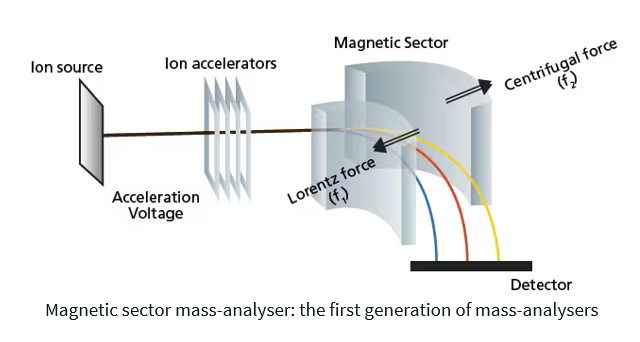
Mass spectrometry works in three main steps (and 3 corresponding components):
Ionization (ion source) – Converts molecules into charged ions.
Mass Analysis (mass analyser) – Separates ions based on their mass-to-charge ratio (m/z) by passing them through a magnetic field. Ions with the same m/z will undergo the same amount of deflection. Lighter ions are deflected to a greater degree than heavier ions.
Detection (detector) – Measures the abundance of ions and generates a spectrum.
Mass to charge ratio m/z
The mass-to-charge ratio (m/z) represents the mass of an ion divided by its charge. It is used to separate and identify ions in a mass spectrometer.
Bottom-up proteomics VS Top-down proteomics
Bottom-up proteomics: common method to identify proteins and characterize their amino acid sequences and post-translational modifications by proteolytic digestion of proteins prior to analysis by mass spectrometry.
Top-Down Proteomics: Analyses intact proteins without digestion, preserving information on modifications and isoforms.
Protein separation techniques
Isoelectric Focusing: separating proteins based on charge.
SDS-PAGE: separate proteins by size.
2D-PAGE: separate on both charge and size.
Liquid chromatography: separates based on hydrophobicity.
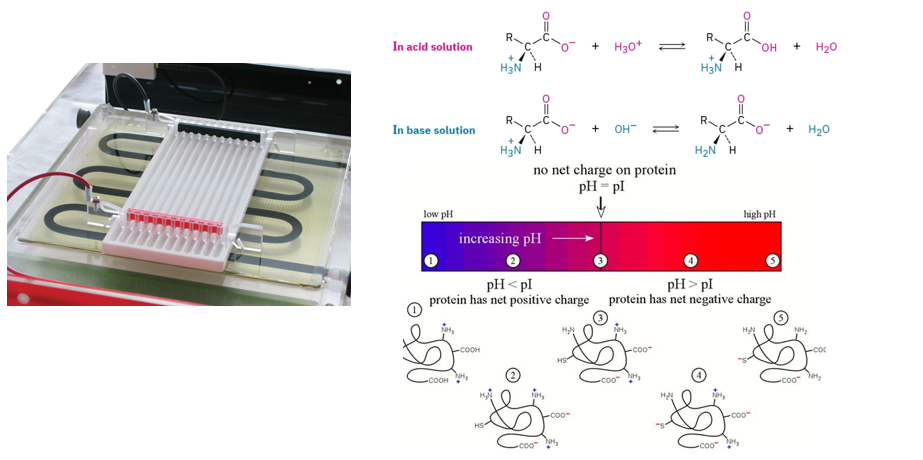
Isoelectric focusing (IEF)
What?
Isoelectric focusing (IEF) is a technique used to separate proteins based on their isoelectric point (pI), the pH at which they carry no net electric charge.
How?
A gel is filled with a pH gradient. This gradient is stable and ranges from a low pH (acidic) to a high pH (basic).
The sample containing proteins is applied to the gel.
When an electric field is applied, proteins migrate based on their charge. Each protein will stop at the point where its net charge is zero (i.e. at the pH corresponding to their pI).
This results in focused bands corresponding to the pI of each protein.
This is often only a first basis for separation as some proteins may have the same pI and will therefore not be separated by this technique.
SDS-PAGE
What?
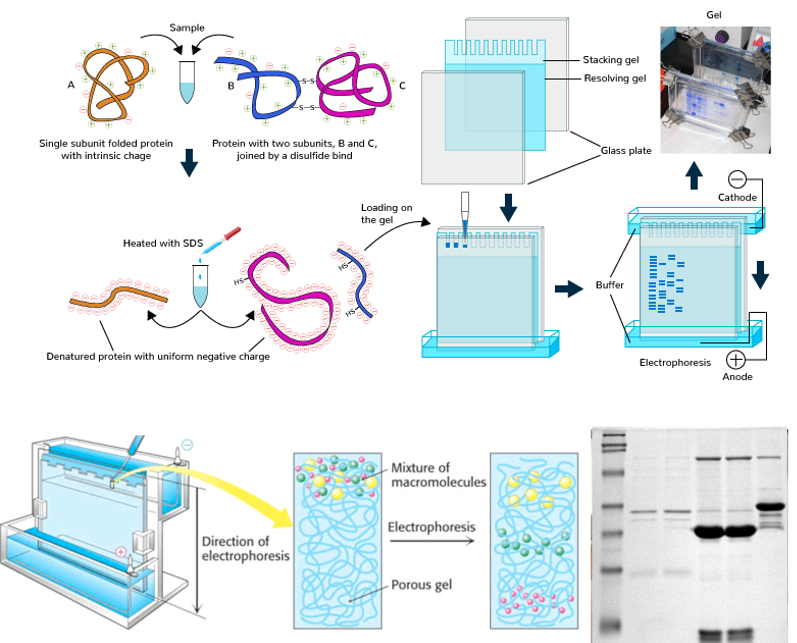
SDS-PAGE (Sodium Dodecyl Sulphate - Polyacrylamide Gel Electrophoresis) is a technique used for separating proteins based on their molecular weight.
How?
Protein denaturation with SDS: the proteins are coated with SDS, a detergent that:
coats the protein with negative charges. 1 SDS anion binds for every 2 amino acids, providing a negative charge proportional to the length of the protein. This allows for the separation to only be done on the basis of molecular weight rather than both weight and charge.
denatures the proteins, converting them into linear polypeptide chains.
Sample loading: the protein sample is loaded into a polyacrylamide gel (porous).
Electric field: an electric field is applied. Since SDS makes all proteins negatively charged, they migrate toward the positive electrode (anode). Smaller proteins move faster through the gel, while larger proteins move slower.
2D-PAGE
What?
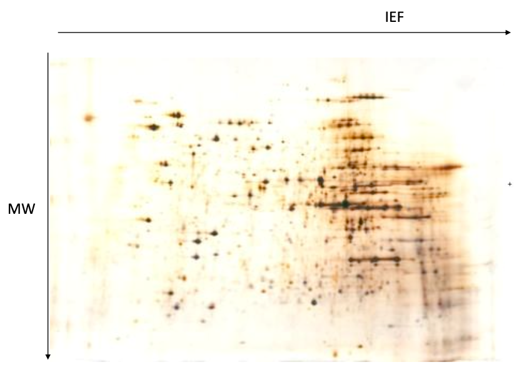
2D-PAGE (Two-Dimensional Polyacrylamide Gel Electrophoresis) is a method for separating complex protein mixtures based on two independent properties:
Isoelectric point (pI)
Molecular weight
In other words, it combines both isoelectric focusing and SDS-PAGE into one procedure.
How?
Two electrophoresis steps performed sequentially.
Isoelectric focusing to separate proteins based on their isoelectric point (pI)
Proteins are loaded onto a pH gradient gel
Electric field is applied, and proteins migrate until they reach their pI (i.e. where their net charge is 0)
SDS-PAGE to separate proteins based on their molecular weight
Focused proteins from the IEF strip are laid horizontally onto a SDS-PAGE gel.
SDS coats the proteins, giving them a uniform negative charge.
An electric field is applied, and proteins migrate based on their size (smaller proteins move faster).
Final result: a 2D protein map, where each protein appears as a spot on the gel.
The horizontal position (left to right) corresponds to pI.
The vertical position (top to bottom) corresponds to molecular weight.
Why?
Protein identification: specific spots can be excised and analysed in a mass-spectrometer for identification.
Comparative analysis using “spot” comparison.
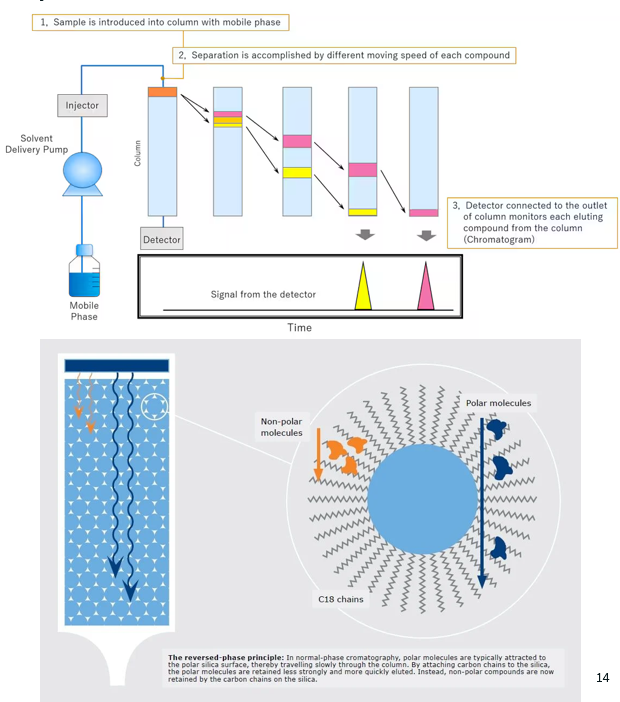
Mobile and stationary phase
In chromatography, separation of compounds occurs due to the interaction between two phases:
Stationary Phase – The immobile phase inside the column that interacts with the sample components.
Mobile Phase – The moving liquid or gas that carries the sample through the stationary phase.
Reverse-Phased Liquid Chromatography (RP-LC)
What?
Reverse-Phase Liquid Chromatography (RP-LC) is a chromatography technique which separates compounds based on their hydrophobicity using a nonpolar stationary phase and a polar mobile phase.
This is the opposite of normal-phase liquid chromatography, where the stationary phase is polar and the mobile phase is non-polar.
How?
Column and Phases:
Stationary phase: the column is packed with hydrophobic, nonpolar material, typically silica particles modified with long hydrocarbon chains (C18 is the most common as it offers strong hydrophobic interactions).
Mobile phase: the peptides (proteins are digested into smaller peptides before RP-LC) are dissolved in a polar solvent - the mobile phase - which is a mixture of water and an organic solvent (e.g. acetonitrile).
Sample injection:
The sample is injected into the column, and the mobile phase carries the peptides through it.
Separation mechanism:
Non-polar peptides (hydrophobic) will interact more strongly with the hydrophobic stationary phase, and will thus travel through the column slowly.
Polar peptides (hydrophilic) will not interact with the stationary phase as much, and will thus travel through the column faster.
Elution process:
Initially, the mobile phase has a higher percentage of water, and is thus very polar.
Over time, the percentage of organic solvent (acetonitrile) increases. This reduces the polarity of the solvent, thus making it easier for the hydrophobic peptides to dissolve in the mobile phase, and reducing the hydrophobic interactions between the peptides and the stationary phase. Thus, the more hydrophobic compounds will gradually elute out of the column.
As the mobile phase reaches a high percentage of organic solvent, even the most strongly retained compounds elute from the column.
Detection:
A detector connected to the outlet of the column monitors each eluting compound from the column.
This results in a chromatograph.
Often, the output of the column is directly connected to the mass spectrometer, allowing for separation of the proteins and direct identification.
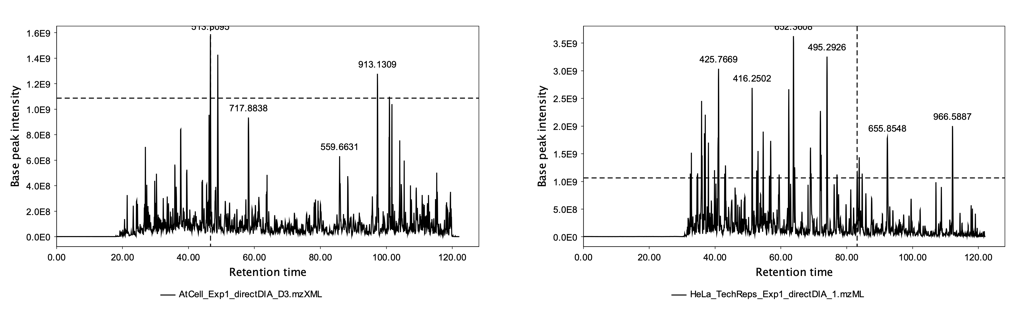
Explain how chromatographs from RP-LC are interpreted.
In a RP-LC chromatograph:
The x-axis corresponds to the retention time (time from injection in the column until the peak is detected).
The y-axis corresponds to intensity.
Each peak corresponds to a distinct protein or peptide. The position of the peak on the x-axis tells us when the compound exited the column (and thus its relative hydrophobicity), and the height of the peak tells us the abundance of the compound.
Peaks with a shorter retention time (i.e. on the left) correspond to compounds that are more hydrophilic (polar).
Peaks with longer retention time (i.e. on the right) correspond to compounds that are more hydrophobic (non-polar).
Basic workflow for quantitative proteomics (5 steps)
Protein extraction
Protein digestion
Peptide separation (e.g. RP-LC)
Mass analysis (with mass spectrometry)
Peptide identification and quantification
Substeps in the protein extraction step of quantitative proteomics workflow
Extract protein with extraction buffer
Remove denaturing agent
Quantitate extracted protein
What are the key considerations when choosing a protein extraction buffer?
The buffer should be compatible with the enzymes used for the digestion step (i.e. they must be stable at the pH of the buffer).
The buffer should solubilise most proteins in the biological sample.
Choose if we want a denaturing buffer or a native buffer.
Denaturing buffer: linearises the proteins to make them inactive, thus limiting endogenous enzyme activity (important for proteins such as protease, phosphatase…).
Native buffer: leaves the proteins in their native form, allowing them to stay active and/or bound in complexes. This is useful if we want to study said protein complexes.
If using a denaturing buffer, important that it is easily removable. This is because we later need to add proteases to break the proteins into peptides, and these will not work if they are denatured.
Safe choice of buffer for protein extraction
8M urea (denaturant) in 100mM Tris (buffering agent), pH 8.5
Additional steps to take to optimise protein extraction.
Add reducing agents to break disulphide bridges → DTT, beta-mercaptoethanol.
Add alkylation agent to irreversibly modify free thiols after reduction (thus preventing disulphide bonds reformation) —> Iodoacetamide, chloroacetamide, N-ethylmaleimide (NEM).
Adjust salt concentration to optimize protein solubility and prevent aggregation.
If using a weak detergent, add protease, phosphatase, deubiquitinase inhibitors to prevent protein degradation.
Add benzoase or nucleases to free DNA/RNA bound proteins.
Detergent removal in protein extraction step.
If using a denaturing buffer, it is important to remove it before we add proteases to break the proteins into peptides, as the proteases will not work if they are denatured.
One method to do this is by precipitation and buffer exchange:
The proteins are precipitated by adding an organic solvent such as acetone or trichloroacetic acid (TCA), thus separating them from the denaturing agent.
Incubation and centrifugation to pellet the proteins.
Protein pellet is resuspended in a native buffer.
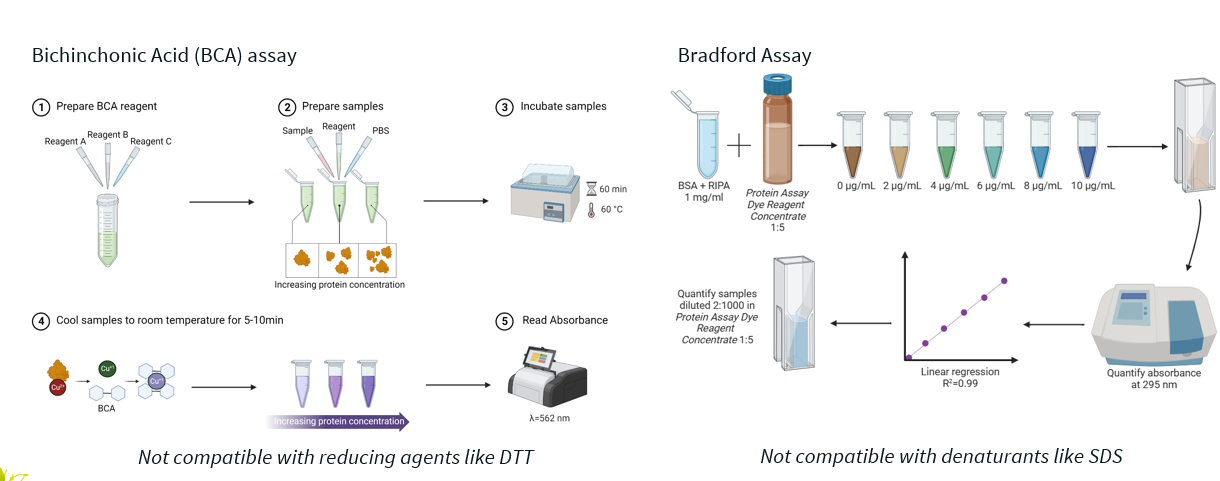
2 protein quantitation methods after extraction.
Bichinchonic acid (BCA) assay: measures protein concentration based on the reduction of Cu²⁺ to Cu⁺ by protein, followed by a colour change when BCA reacts with Cu⁺.
Bradford assay: relies on Coomassie Brilliant Blue dye binding to proteins, which shifts the dye's absorbance spectrum
Explain how protein digestion is usually carried out.
Proteolysis is performed by proteases (enzymes). The digestion must:
be consistent across all proteins (i.e. cleave at specific sites regardless of the protein).
be highly efficient (to avoid incomplete digestion, which can complicate peptide identification).
have well-defined cleavage sites.
Trypsin is mostly used for this step.
What’s an important step carried out after protein digestion into peptides?
Protein purification
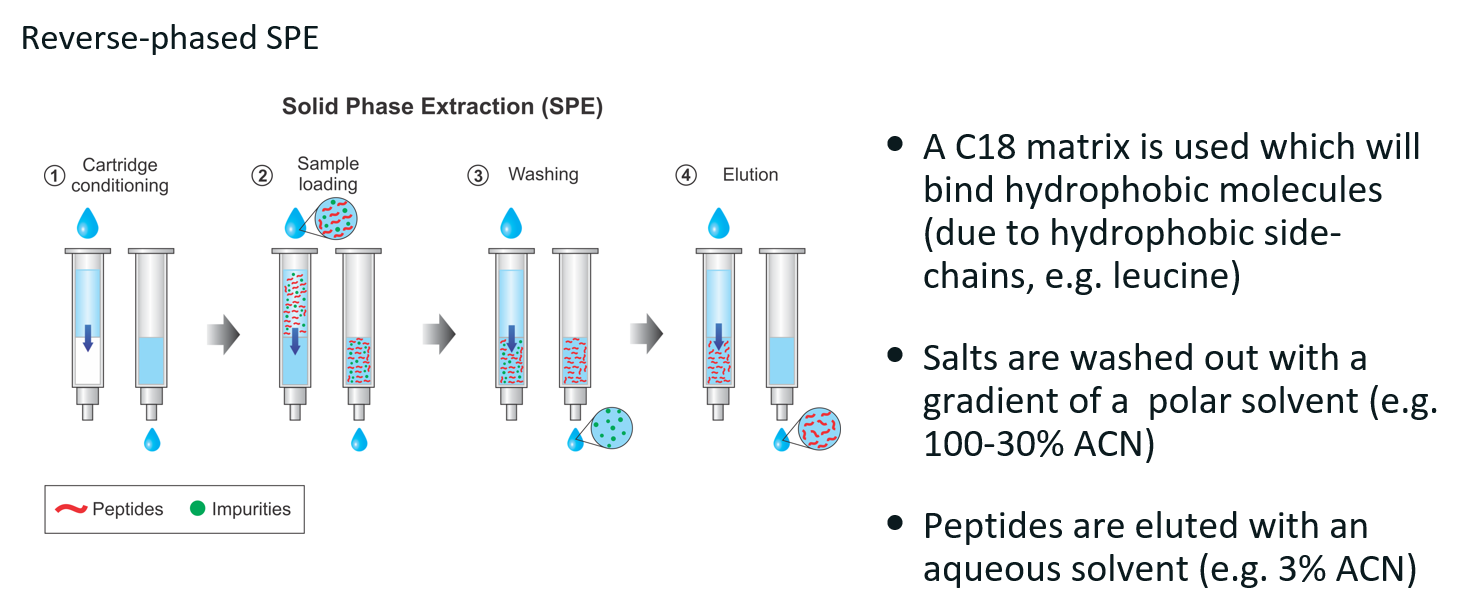
Protein purification technique and how it works.
Reverse-phase SPE
Technique used to remove salts and contaminants from peptide mixtures by leveraging hydrophobic interactions between the peptides and the C18 column matrix (similar to reverse-phased liquid chromatography).
Cartridge conditioning
Sample loading
Digested protein sample is loaded
Hydrophobic peptides bind to the C18 column matrix
Impurities (e.g. salts, polar contaminants) may not bind and can be washed away.
Washing
A polar solvent is used to wash away unbound and weakly bound impurities.
Peptides remain bound to the C18 matrix.
Elution
Peptides are eluted with an aqueous solvent.
This disrupts hydrophobic interactions, allowing peptides to elute into a clean collection tube.
Give 2 common protocols for protein sample preparation.
FASP: Filter-Aided Sample Preparation
SP3: Single Pot, Solid-Phase, Sample Preparation
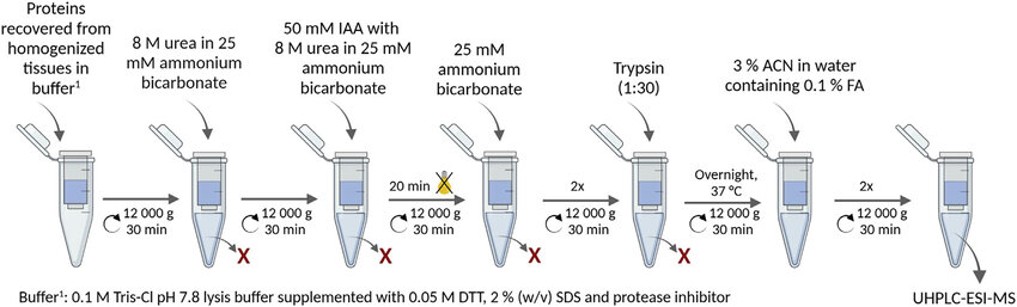
FASP
FASP (Filter-Aided Sample Preparation) is a filtration-based method that allows for the digestion of proteins into peptides while simultaneously removing contaminants like salts, detergents, and other impurities. It utilizes a centrifugal filter (with a specific molecular weight cut-off) to separate larger molecules (such as undigested proteins) from smaller peptides.
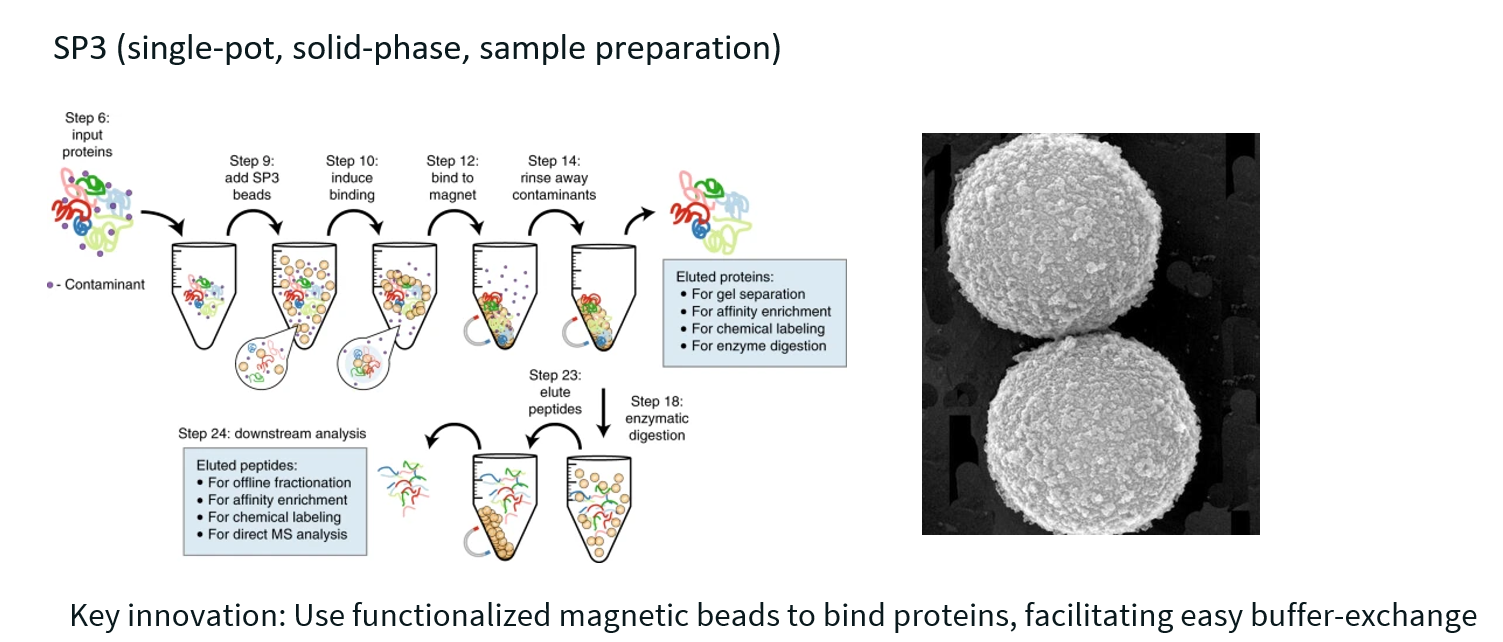
SP3
SP3 uses magnetic beads to capture, purify, and digest proteins and peptides all in a single tube—making the workflow simpler, faster, and less prone to sample loss than traditional methods like in-solution digestion or FASP.
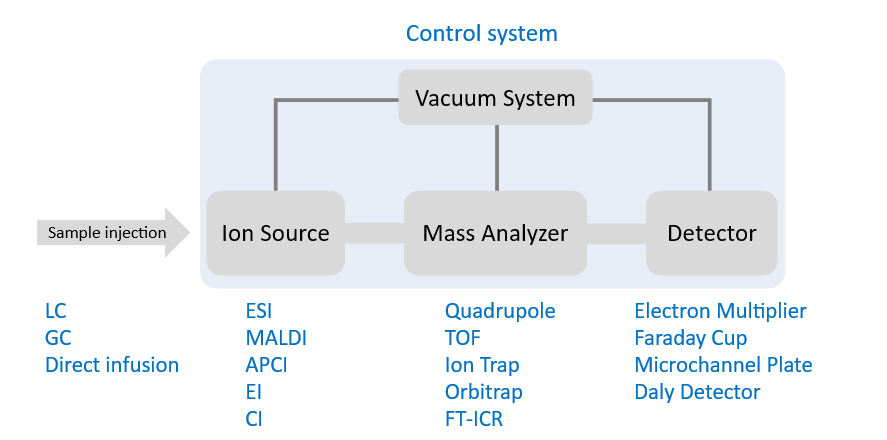
What do each of the acronyms mean?
Sample injection
LC: Liquid Chromatography
GC: Gas Chromatography
Ion source: converts molecules into ions
ESI: Electrospray Ionisation
MALDI: (Matrix-Assisted Laser Desorption/Ionisation)
APCI: Atmospheric Pressure Chemical Ionization
EI/CI: Electron/Chemical Ionisation
Mass analyser: separates ions based on mass-to-charge ratio (m/z)
Quadrupole
TOF: Time-of-Flight
Ion trap
Orbitrap
FT-ICR: Fourier Transform Ion Cyclotron Resonance

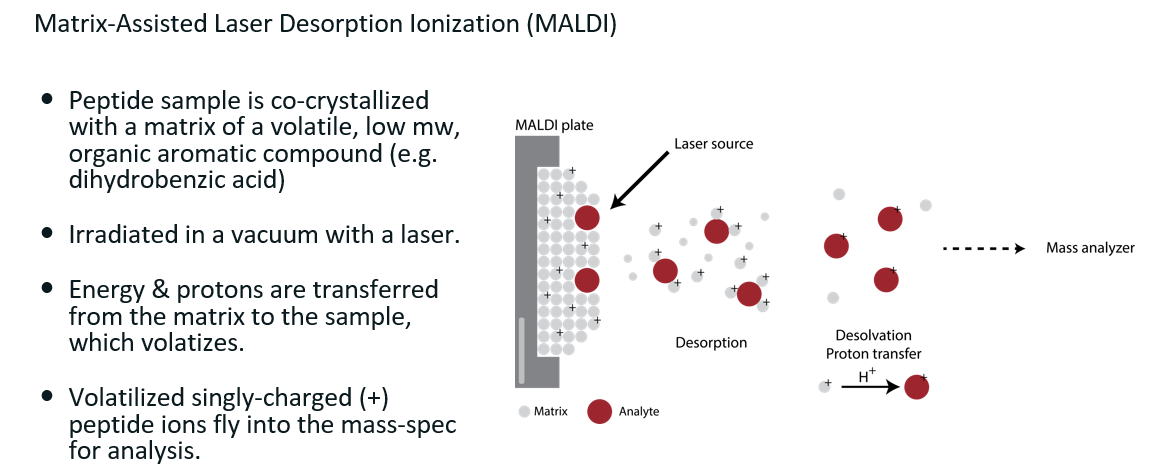
MALDI
See image for details (mw: molecular weight)
Nowadays, this method is mostly used for imaging mass-spec, not for quantitative proteomics.
Also known as imaging mass-spectrometry (IMS)
Key limitation is the resolution of the laser.
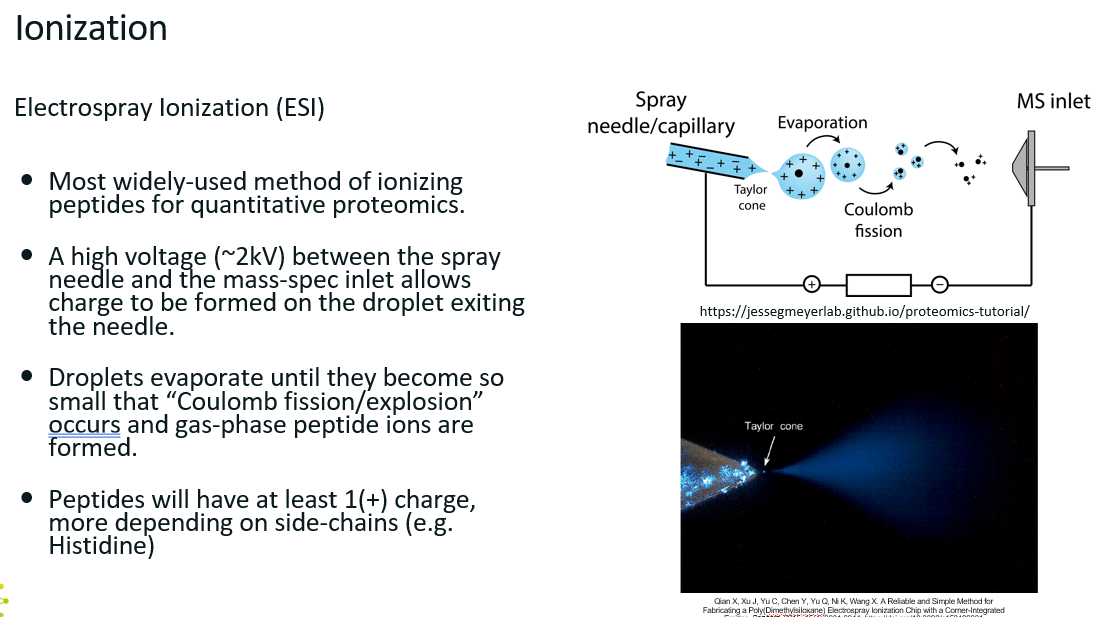
Electrospray Ionisation (ESI)
Very thin needles fused to the LC column.
As peptides exit the column, they enter the needle and travel through it.
There is a very large potential difference between the exit of the needle and the inlet of the mass spec, allows charge to be formed on the droplet exiting the needle.
Droplets evaporate until they become so small that “Coulomb fission” occurs and gas-phase peptide ions are formed
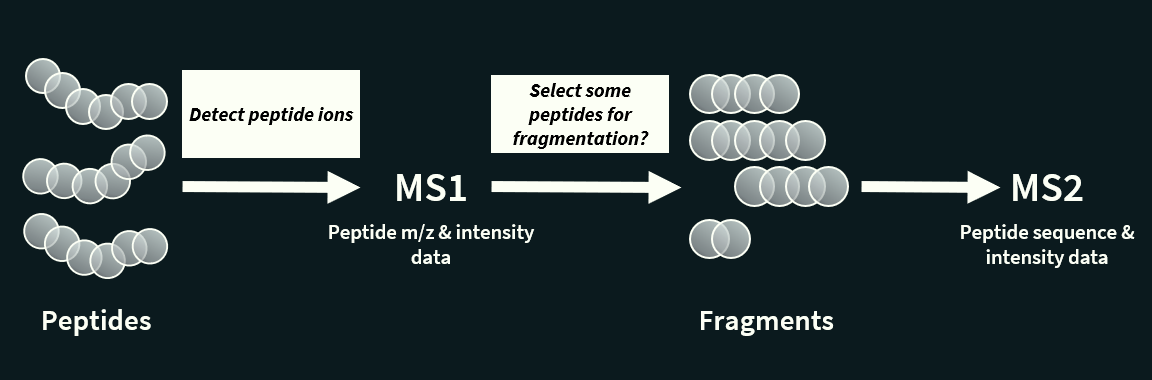
Briefly explain tandem mass spectrometry
Tandem mass spectrometry (MS/MS or MS²) is a an extension of mass spectrometry used to identify and characterize molecules, especially peptides and proteins, by fragmenting ions and analysing the pieces.
It involves two or more rounds of mass analysis:
First MS (MS1): all peptides are analysed by the mass spectrometer one by one (thanks to the separation by LC) to detect their mass to charge ration.
Fragmentation: Ions of a particular m/z coming from MS1 are selected to be split into smaller fragment ions. This is done in a collision cell, which breaks the peptides into predictable pieces.
Second MS (MS2): these fragments are introduced into the second mass spectrometer, which in turns separates the fragments by their m/z.
The fragmentation step makes it possible to identify and separate ions that have very similar m/z ratios in regular mass spectrometers.
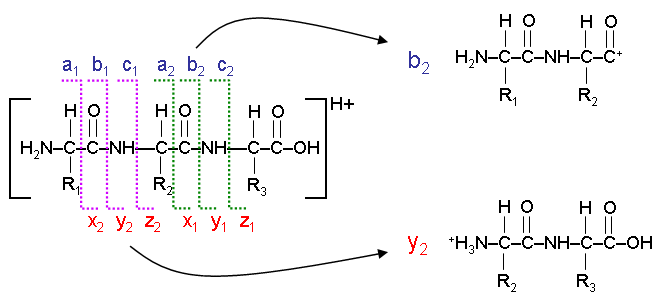
Explain this image.
The lines represent the way an ion can be fragmented. There are three types of bond that can be broken:
a/x: separates the carboxyl group from the rest of the ion.
b/y: breaks the peptide bond between amino acids.
c/z: separates the amino group from the rest of the ion.
Consider the first break → a1/x2
The fragment on the left is called the a1 ion
The fragment on the right is called the x2 ion

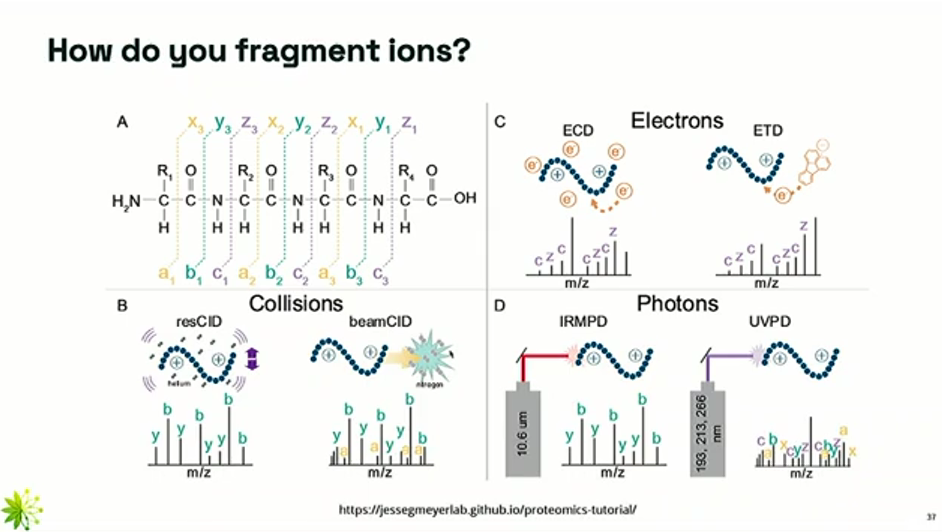
How do you fragment ions for MS2?
The peptides should be broken in a predictable and consistent way (i.e. either all a/x bonds, all b/y bonds, or all c/z bonds).
Once a precursor ion is selected in MS1, it it passed into a collision cell where it is broken into smaller ions (called daughter ions or fragments). There are several methods to fragment it:
CID (Collision-Induced Dissociation) (beamCID on the image)
The ions are collided with an inert gas like nitrogen.
The kinetic energy causes the weakest bonds (i.e. peptide bonds, b/y) to break.
This technique can be a bit imprecise (i.e. bonds other than peptide bonds can be broken). This is shown on the spectra of the beamCID, where we can see the presence of a ions.
ETD (Electron Transfer Dissociation)
More precise (i.e. no random breaks) than CID, but more complex
This technique breaks the c-z bonds (separates the amino group from the rest of the ion) through electron transfer
With these techniques, all possible fragmentation patterns are generated
4 mass spectrometer types
Triple quadrupole
Q-TOF
Orbitrap
Astral
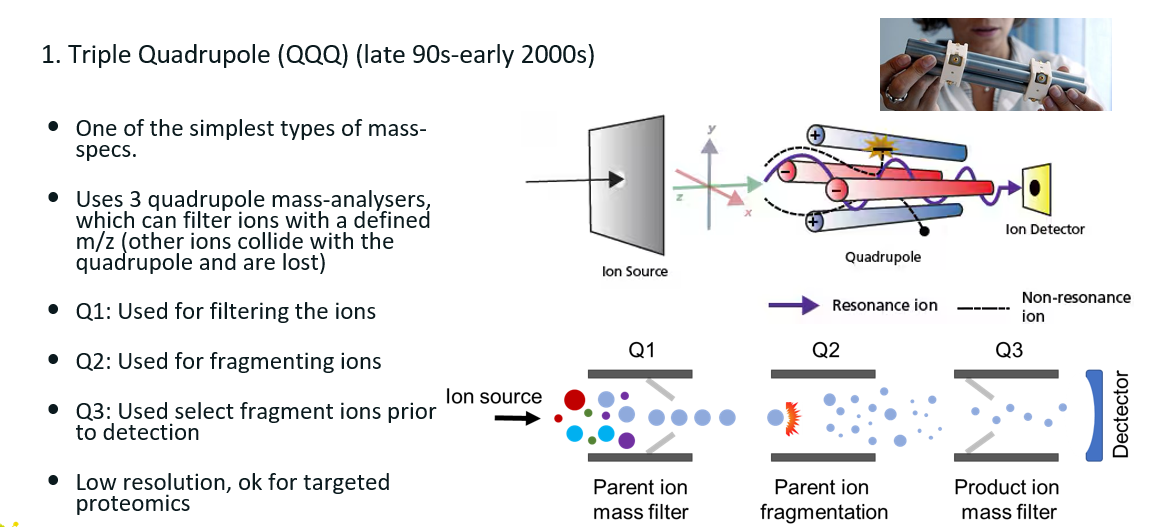
Triple quadrupole
Consists of 3 quadrupoles arranged back to back. Each quadrupoles consists of four poles, 2 positively charged and 2 negatively charged.
How does it work?
Q1: First quadrupole: acts as a mass filter to select a specific precursor ion (e.g. a peptide of m/z 567.4).
Q2: Second quadrupole: a collision cell where fragmentation occurs (usually via CID).
Q3: Third quadrupole: analyses the fragment ions produced in Q2.
This is then repeated for each peptide ion of interest.
Not state of the art technology.
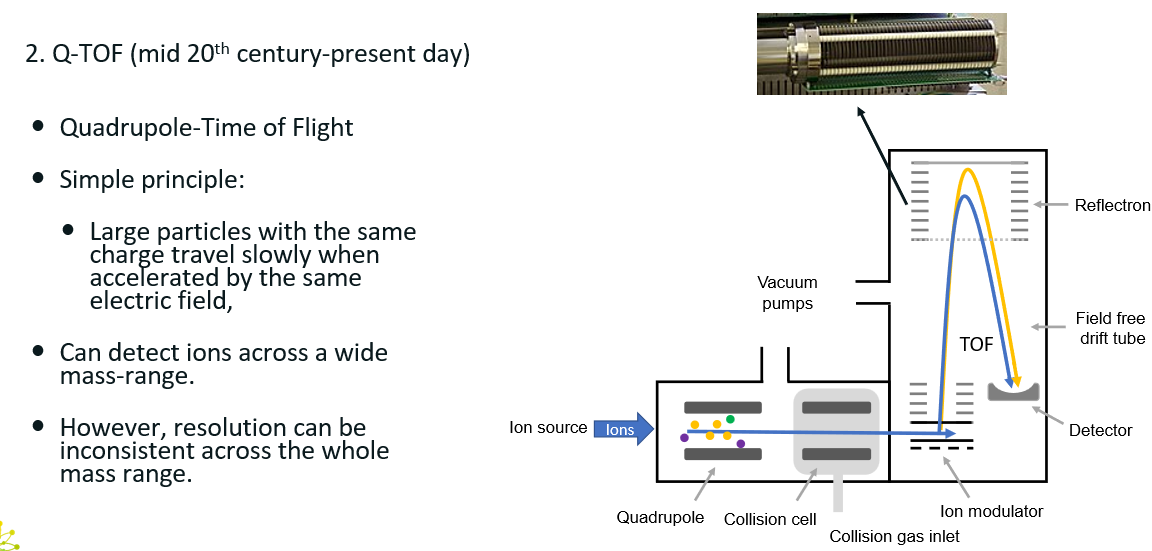
Q-TOF
Q-TOF: quadrupole + Time-Of-Flight
How does it work?
Quadrupole: Selects precursor ion
Collision cell fragments precursor ion
TOF: accelerates the fragments and measures the time it take for them to reach the detector. Acceleration of the fragments will depend on their m/z.
Can detect ions across a wide mass-range, but the resolution can be inconsistent across the whole mass range.
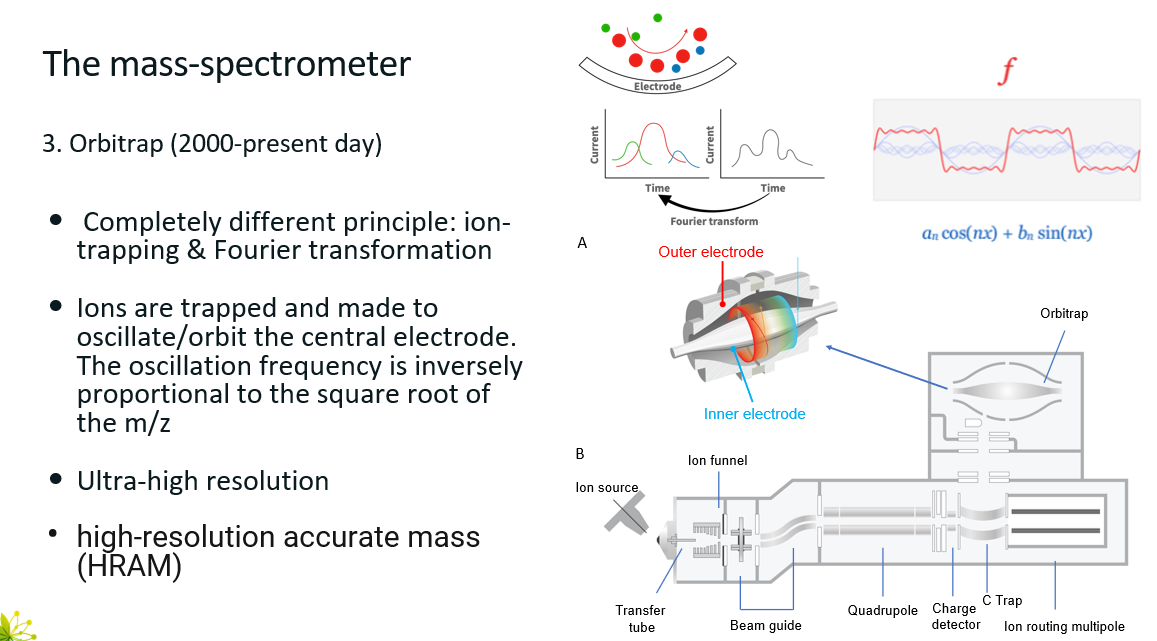
Orbitrap
Very high resolution device
State of the start at the moment
However, the process is slower than other techniques
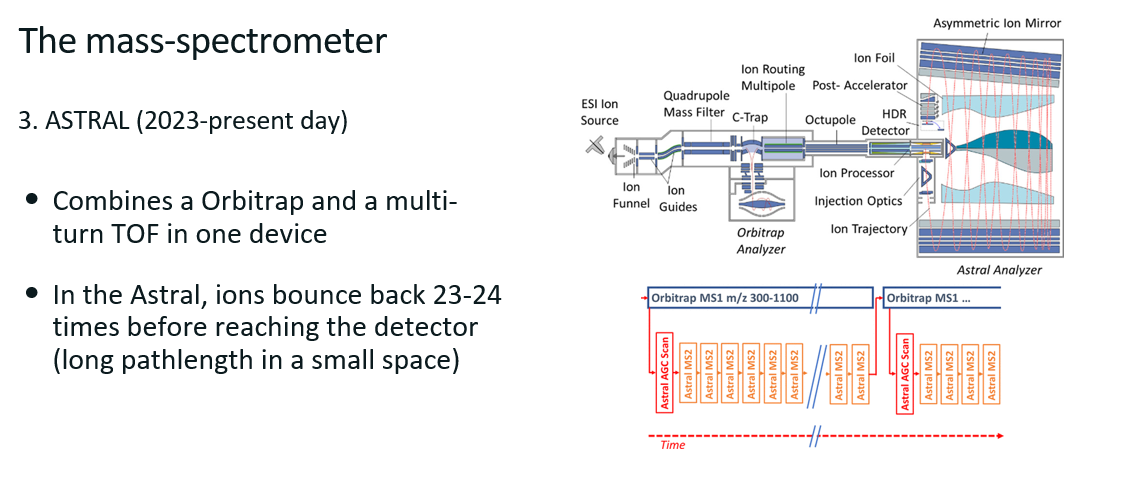
Astral
Combines an orbitrap with a TOF in one device
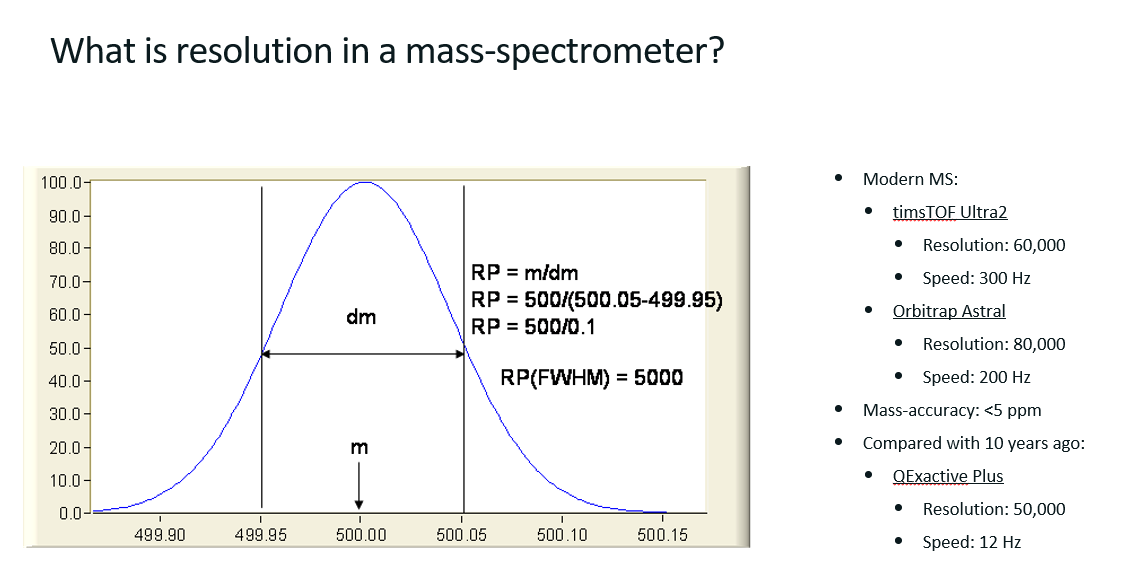
What is resolution is a mass spectrometer?
Resolution (R or RP) measures the instrument’s ability to separate two peaks that are close in mass. It’s calculated as R = m/dm
m/z of ion of interest
dm is the peak width at half maximum intensity
Ion mobility
i’m so tired rn