paper 2 sales forecasting
 Call Kai
 Learn
Learn Practice Test
 Spaced Repetition
 Match
Match Flashcards
 Knowt Play
1/9

Earn XP
Description and Tags
component 2 eduqas a level
Name | Mastery | Learn | Test | Matching | Spaced | Call with Kai | Chat |
|---|
No analytics yet
Send a link to your students to track their progress
10 Terms
explain what is meant by sales forecasting
Sales forecast: an estimate of a business's future sales revenue/volume over a given period, based on available data and assumptions.
Sales volume = number of units sold.
Sales revenue = units sold × selling price.
Forecasts can be quantitative (numerical data) or qualitative (judgement/opinion).
Why businesses forecast: to reduce uncertainty and support decisions about production, stock, staffing, finance, capacity, marketing and investment.
Explain the usefulness of sales forecasting
Usefulness of sales forecasting
Use | How it helps |
|---|---|
Production | Forecast demand → plan output and avoid excess stock/stockouts. |
Stock/inventory | Helps determine how much stock/raw material to order. |
Human resources | Anticipated demand helps plan recruitment, hours and staffing. |
Finance/cash flow | Expected sales help estimate future revenue and cash inflows. |
Capacity | Helps decide whether extra machinery, premises or capacity is needed. |
Marketing | Helps set promotional budgets and target periods of expected demand. |
Investment | Forecast growth may support investment decisions. |
Objectives | Provides a basis for setting realistic sales targets. |
Stakeholders | Investors/lenders may use forecasts when assessing future prospects; employees may be affected by staffing/output decisions |
Explain the factors that can affect sales forecasting reliability
A forecast is not a guarantee. Reliability depends on:
Quality/accuracy of historical data — poor or limited data → weaker forecast.
Time period — longer-term forecasts are generally more uncertain.
Market changes — competitors, technology and consumer tastes can change unexpectedly.
Economic conditions — inflation, unemployment, interest rates and economic growth affect demand.
Seasonality — recurring fluctuations can make simple forecasts misleading if ignored.
One-off events — strikes, pandemics, extreme weather, supply disruptions etc. may make past patterns irrelevant.
Accuracy of assumptions — forecasts depend on assumptions about prices, demand and competitors.
Method used — quantitative methods can identify trends but may fail to capture qualitative changes.
Human judgement/bias — managers may be over-optimistic or pessimistic.
Product life cycle — past sales patterns may not continue as a product moves between stages.
Understand that sales forecasting includes quantitative and qualitative techniques
Quantitative forecasting: Uses numerical/historical data to predict future sales.
Examples: Moving averages, Scatter graphs, Line of best fit, Extrapolation, Time-series analysis
Strength: objective and data-based.
Limitation: assumes past patterns provide useful information about the future.
Qualitative forecasting: Uses judgement, opinions, experience and discussion, rather than relying solely on numerical data.
Examples: Intuition, Brainstorming, Delphi method
Strength: can account for factors that historical data cannot capture.
Limitation: subjective and potentially biased.
Calculate a three-point moving average
A moving average smooths fluctuations in sales data to reveal the underlying trend.
formula: previous period + current period + next period divided by 3
Year | Sales | 3-point moving average |
|---|---|---|
2023 | 100 | — |
2024 | 130 | (100 + 130 + 150) ÷ 3 = 126.7 |
2025 | 150 | (130 + 150 + 170) ÷ 3 = 150 |
2026 | 170 | (150 + 170 + 190) ÷ 3 = 170 |
2027 | 190 | — |
Important: With a 3-point moving average, you normally cannot calculate a value for the first and last periods, because each average needs one observation either side.
Why use it?
Removes short-term fluctuations.
Makes the underlying trend easier to identify.
Can assist forecasting.
Limitations
Loses information at the beginning/end of the series.
Past patterns may not continue.
Averages can hide sudden changes.
Does not explain why sales changed.
Seasonal effects may still need separate consideration.

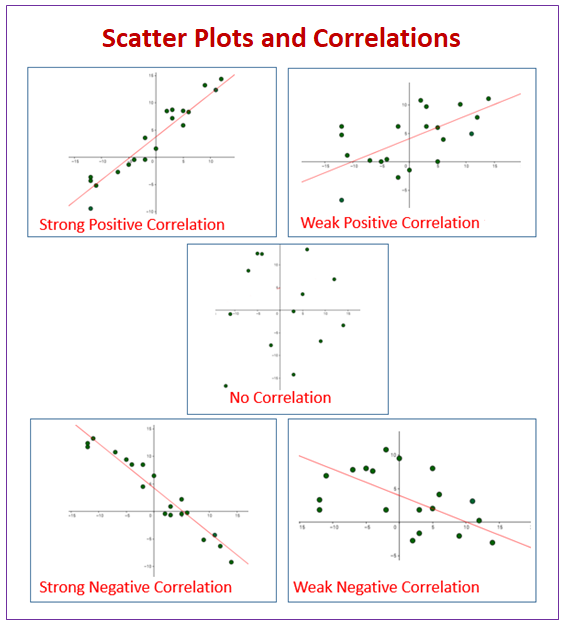
Create a scatter graph and a line of best fit
A scatter graph plots paired data to identify whether two variables appear to be related.
For sales forecasting, it can show the relationship between variables such as time and sales or advertising expenditure and sales.
Use extrapolation to predict future developments
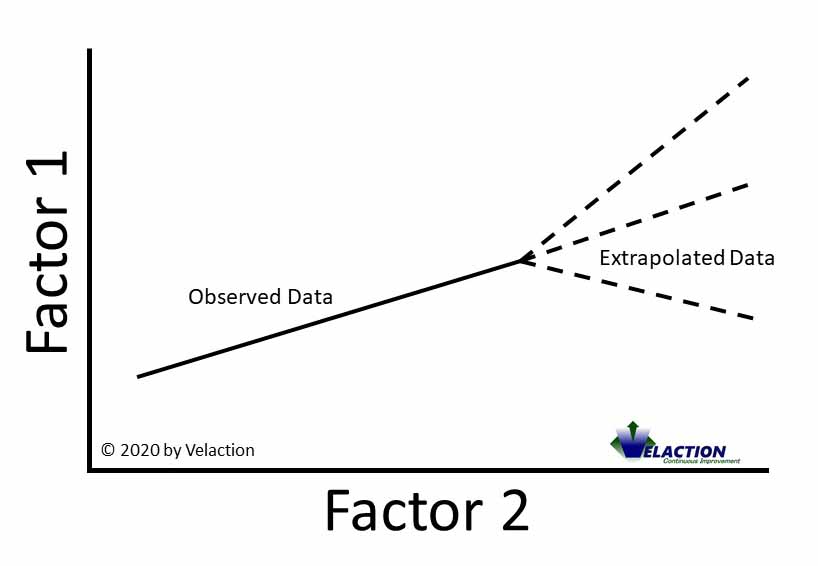
Extrapolation: using an established pattern/trend to predict a value outside the range of the existing data.
Example: Past sales show a steady upward trend → extend the line of best fit beyond the final known period → estimate future sales.
Advantages
Simple and quick.
Uses existing data.
Provides a numerical basis for planning.
Limitations
Assumes the existing trend will continue.
Increasingly unreliable the further into the future the forecast goes.
Unexpected changes cannot easily be incorporated.
Particularly risky in rapidly changing markets.
Interpret information from time-series analysis
A time series is data recorded at regular intervals over time.
Sales time-series data can be analysed to identify:
1. Trend: The long-term direction of sales.
Upward trend → sales generally increasing.
Downward trend → sales generally decreasing.
2. Seasonal variation: Regular, predictable fluctuations occurring at particular times of the year.
Examples: Ice cream → higher summer sales..
3. Cyclical variation: Longer-term fluctuations associated with the economic/business cycle.
For example, sales may rise during economic expansion and fall during recession.
4. Random variation: Unpredictable changes caused by unusual/unforeseen events.
Examples:
Extreme weather
Industrial action
Sudden competitor action
Interpretation: When interpreting a time series, consider trend + seasonal/cyclical effects + unusual fluctuations, rather than simply assuming that the latest figure will continue.
Evaluate the usefulness of time-series analysis for a business and its stakeholders
For the business
Advantages
Identifies sales trends.
Helps predict future demand.
Supports production and stock planning.
Helps identify seasonal demand.
Can improve resource allocation.
Provides evidence for targets and budgets.
Relatively inexpensive if reliable historical data already exists.
Disadvantages
Past trends may not continue.
Unexpected events are difficult to predict.
Historical data may be inaccurate/outdated.
Does not necessarily explain the causes of changes.
Forecasts become less reliable further into the future.
Structural changes in the market can make historical patterns inappropriate.
For stakeholders
Owners/shareholders: forecasts may inform investment and expected future revenue/profit decisions.
Managers: help with production, staffing, stock and financial planning.
Employees: forecasts can influence recruitment, working hours and job security.
Suppliers: may help anticipate future orders.
Lenders: may use expected sales when considering whether a business can generate sufficient cash to meet obligations.
Explain qualitative forecasting techniques including, intuition, brainstorming and the Delphi method
Qualitative forecasting: Qualitative techniques rely on human judgement and expertise, particularly where historical numerical data is limited or unlikely to reflect future conditions.
Intuition: A forecast based on an individual's experience, instinct and judgement.
Advantages: Fast., Cheap, Useful when little/no historical data exists, Can incorporate knowledge of current market conditions.
Disadvantages: Highly subjective, Personal bias can affect decisions, One person's judgement may be inaccurate, Difficult to test objectively.
Useful when: launching a new product where historical sales data does not exist.
Brainstorming: A group generates ideas/opinions about future sales or market developments, usually encouraging many ideas before evaluating them.
Advantages: Produces a wide range of ideas, Combines employees' different knowledge and experience, Can identify factors numerical methods miss, Encourages discussion and creativity.
Disadvantages: Dominant personalities may influence the group, Groupthink may reduce challenge of ideas, Can be time-consuming, Opinions may be biased, Quantity of ideas does not guarantee accuracy.
Delphi method: A structured forecasting technique involving a panel of experts.
Typical process: Experts independently give forecasts → responses are collected → anonymous results/summary are circulated → experts reconsider → process repeated until a degree of consensus is reached.
Key features: Experts, Anonymity, Several rounds, Feedback, Consensus
Advantages: Reduces influence of dominant individuals, Draws on specialist knowledge, Useful where reliable quantitative data is unavailable, Can consider complex/unpredictable future developments, Multiple rounds allow experts to reconsider their views.
Disadvantages: Time-consuming, Potentially expensive, Depends on selecting appropriate experts, Consensus does not guarantee accuracy, Experts can still be biased or wrong.