8.1 Human Population Dynamics
1/47
There's no tags or description
Looks like no tags are added yet.
Name | Mastery | Learn | Test | Matching | Spaced | Call with Kai |
|---|
No analytics yet
Send a link to your students to track their progress
48 Terms
how have technological advances affected the population and carrying capacity?
increasing populations and increased carrying capacity
when was the period of high population growth in MEDCs
19th and 20th century
when did LEDCs have a period of high population growth
1950s onwards
what type of growth has population growth followed so far
exponential
what is crude birth rate (CBR)
the number of births per 1000 individuals of a population per year
what is crude death rate (CDR)
the number of deaths per 1000 individuals of a population per year
rate of natural change
the difference between the birth rate and the death rate
natural increase rate (NIR)
the rate of human growth expressed as a percentage change per year (CBR-CDR)/10
fertility rate
the number of live births per 1000 women aged 15-54 years in a given year
total fertility rate
the average number of children each woman has in her reproductive lifetime
replacement-level fertility
the level at which people in each generation have just enough children to replace themselves in the population
doubling time
the time in years that it takes for a population to double in size
70/NIR
how long does it take for an NIR of 1% to double
70 years
human development index (HDI)
a measure of wellbeing and development in a country
what does HDI combine to get one value about the wellbeing of the country
health (life expectancy), wealth (GNI per capita) and education (adult literacy rate/ mean years of schooling)
how does population impact the environment
more people need more resources (scarcity), more people produce more waste (pollution), people want improved standards of living (resource use)
what factors can affect the level of impact that populations have on the environment
wealth of the population, resource demand, resource use ( varied among development level, urban or rural areas and geography)
Malthusian theory of population
food supply is the main limit to population growth
human population increases geometrically while food supply growth arithmetically, limited by the availability of new land
at some point population would outstrip food supply until a catastrophe like famine disease or war occurred- negative view
overcultivation and soil erosion cause a general decline in food production
limitations of malthusian theory
only the poor would go hungry, not everone
there is no fair or even distribution of the food supply
food is not the only factor controlling population growth
does not account for technological advancement in food production
assumes a closed population- doesn’t account for people who will migrate in search of food and resources or bring new food and resources in
he didn’t predict the changes in farming technique
Boserup’s theory
population growth is exponential
increases in population will increase the demand for food and act as an incentive to improve technology to produce more food- positive view
limitation of Boserup’s theory
assumes a closed population with no migration in face of shortages
no all areas are suitable for technological developments- lack of money, skill etc
assumes that technological development will occur
Factors influencing birth rates (5)
level of education- more education of women encourages higher levels of employment for them meaning that they have less children to focus on careers as well as educating people about family planning and contraception
policies- pro-natalist or anti-natalist eg: one child rule in China
economic prosperity- people in MEDCs may prioritse education and careers over having children and are more likely to be able to afford contraception, child mortality rates are also lower
need for children- eg: in agrarian countries to work on farms, in LEDCs for security in old age
Cultural/ religious beliefs- encourage child birth or prevent contraception
reasons for large families (5)
high infant and child mortality
parents want security in old age and children to care for them
children are an economic asset- can work on farms etc
women are seen as child bearers and aren’t given opportunities for work
unavailability of contraception and lack of education about family planning
what solution to food scarcity would malthus theory suggest
population control, natural checks
what solution to food scarcity would Boserup’s theory suggest?
innovation, intensification of agriculture
example of Malthus’ theory occuring in history
Irish Potato Famine
example of Boserup’s theory occuring in history
Green Revolution
when was Malthus’ theory suggested
1798
when was Boserup’s theory suggested
1965
factors affecting death rate/ mortality (5)
availability of healthcare and sanitation
child/infant mortality rates
politics
natural disasters
aging population
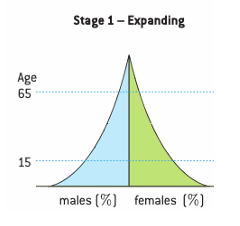
what is a population pyramid
populations at a particular time period, divided into gender and age groups
stage one: expanding population pyramid
high birth rate
rapid fall in each upward age group
high death rate
low life expectancy
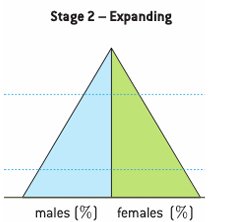
stage two: expanding population pyramid
high birth rate
falling death rate
slightly longer life expectancy
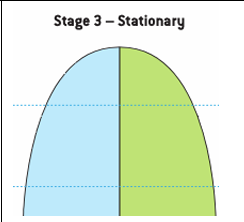
stage 3: stationary population pyramid
declining birth rate
low death rate
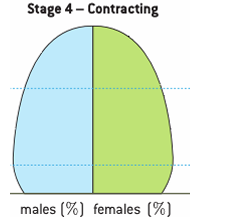
stage 4: contractionary population pyramid
low birth rate
low death rate
high dependency ration
demographic transition model
the historical shift of birth and death rates from high to low levels in a population
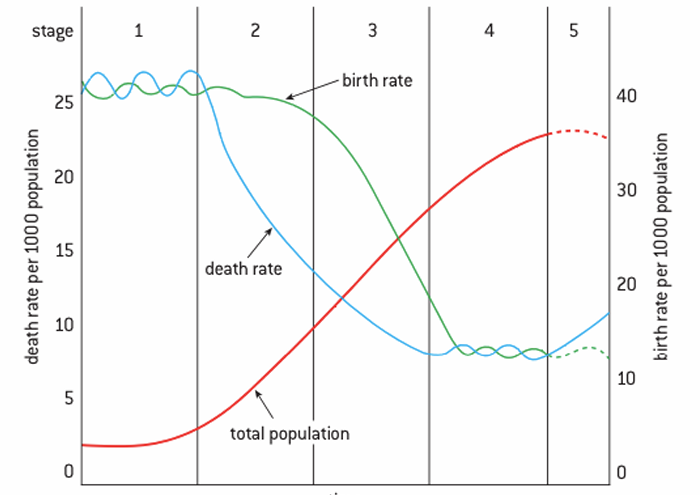
stage one of DTM (demographic transition model)- high stationary
high birth rate
high death rate
stable/ sow increase
stage two of DTM- early expanding
high birth rate
rapidly falling death rate
very rapid increase
stage three of DTM- late expanding
falling birth rate
slowly falling death rate
slower increase
stage four of DTM- low stationary
low birth rate
low death rate
stable/ slow increase
stage five of DTM- declining
very low birth rate
low death rate
slow increase/ decrease
reasons for stage 1 and 2 of DTM (high stationary and early expanding) (5)
children needed for farming means high birth rates
high infant/ child mortality means high birth rate
lack of family planning means high birth rate
disease/ famine means high death rate
poor medical facilities means high death rate
reasons for stage 3 of DTM (late expanding) (4)
improved healthcare and diet
improved family planning
improved education and status of women means lowered birth rate
fewer children needed
reasons for stage 4+5 of DTM (low stationary and declining)
family planning
good healthcare
improved status of women
later marriages
aging population
limitations of the DTM (4)
the fall in death rate is not as steep as suggested- rural to urban migration creates slums which leads to more death
it assumes that birth rates will always fall- ignored factors such as religious attitudes towards contraception and gender biases against women
some countries become industrialized much quicker than shown
the model is Eurocentric in assuming that all countries will become industrialized
methods of reducing birth rates/ family sizes (4)
provide education to children. women and adults
improve healthcare to prevent infant deaths
provide contraception and education on family planning
micro-finance schemes for the poor so they don’t have to rely on their children
policies to reduce growth rates (4)
introducing pension schemes to reduce dependency on children in old age
taxes on having children
increased access to contraception and education on family planning
educating and employing women
policies to increase population growth rates
improved health care and sanitation to reduce death rates
free education and healthcare can increase birth rates
encouraging immigration