Science Graphs
1/10
There's no tags or description
Looks like no tags are added yet.
Name | Mastery | Learn | Test | Matching | Spaced |
|---|
No study sessions yet.
11 Terms
x-axis
The horizontal axis in a graph, typically representing the independent variable (thing being changed).
y-axis
The vertical axis in a graph, usually representing the dependent variable (thing being measured).
data
Facts, statistics, or measured numbers that you gather during an investigation.
correlation
Sets of data that seem to increase or decrease together.
causation
Sets of data that cause each other to increase or decrease.
units
Quantities used to specify measurements (meters, grams, seconds, etc.)
pie graph
A circular graph divided into slices to illustrate numerical proportions.

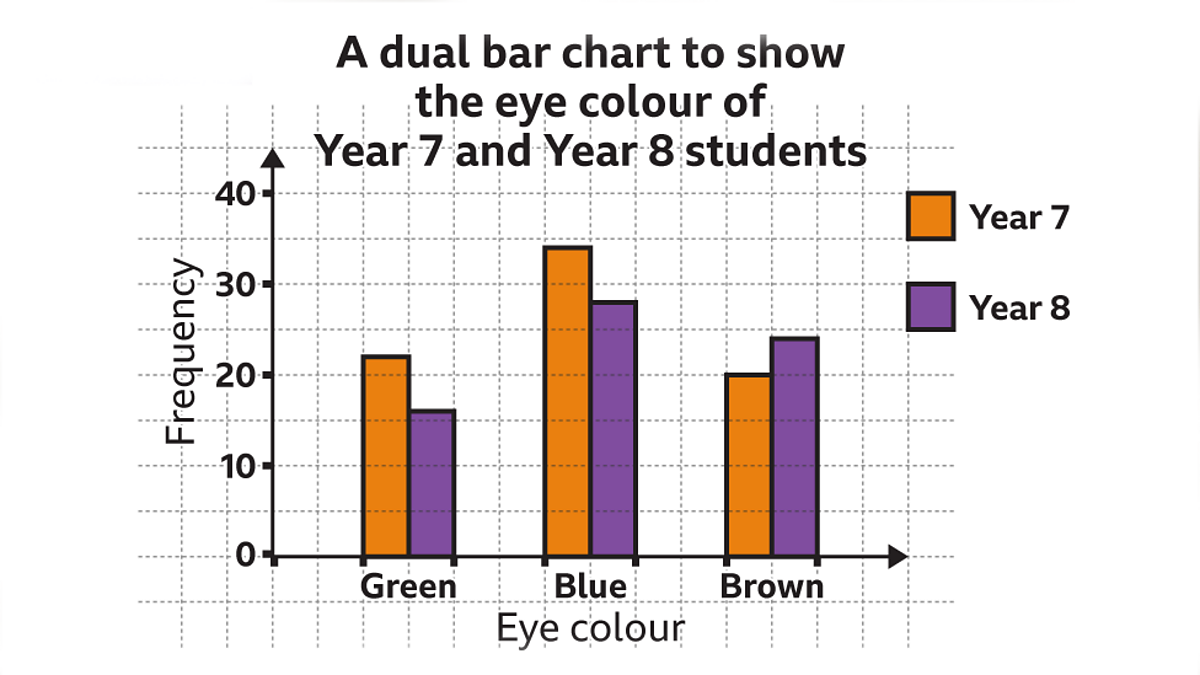
bar graph
A graph that represents data with rectangular bars, where the length of each bar is determined by the y-axis values.
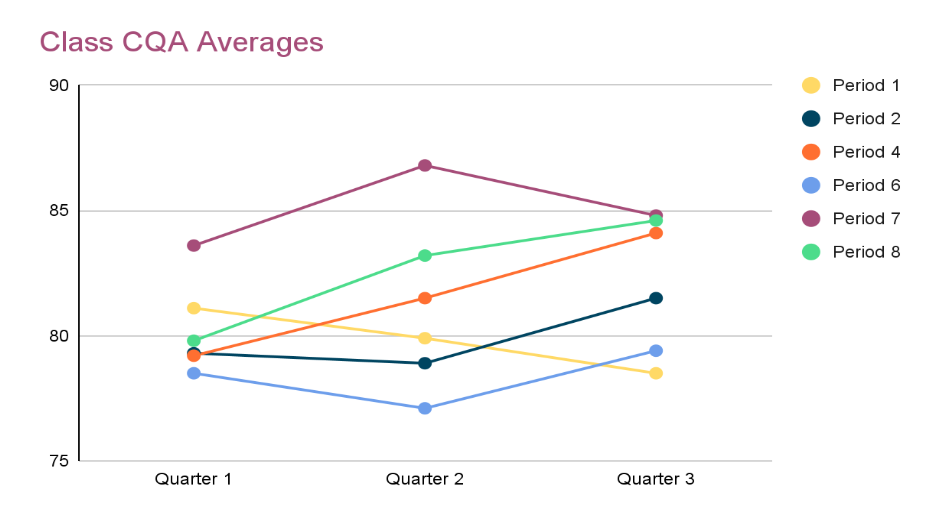
line graph
A graph that displays information as a series of data points connected by lines, typically used to show change over time.
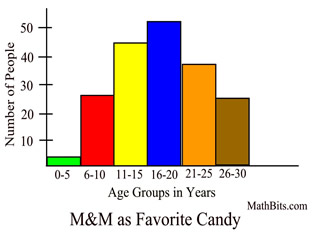
histogram
A type of bar graph that represents the frequency distribution of numerical data, showing how often each value occurs.
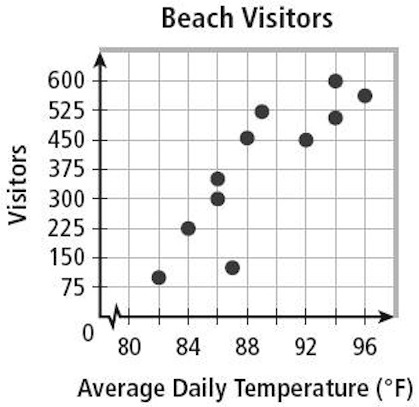
scatter plot
A graph that uses dots to represent the values obtained for two different variables, showing the correlation between them.