AP hug unit 1
 Call Kai
 Learn
Learn Practice Test
 Spaced Repetition
 Match
Match Flashcards
 Knowt Play
1/31

There's no tags or description
Looks like no tags are added yet.
Name | Mastery | Learn | Test | Matching | Spaced | Call with Kai | Chat |
|---|
No analytics yet
Send a link to your students to track their progress
32 Terms
Functional (a.k.a nodal) regions
are areas influenced by a node (center). For example, a radio tower may be able to broadcast music from a radio station within a radius of 50 miles from that tower. Or, a Wal-Mart may serve an area of residents within 25 square miles.
Formal (a.k.a. uniform) regions:
examples involve a shared characteristic such as language, commuting patterns, climate, production of a particular crop, etc. It could also be a State such as Montana, because it has uniform State laws within its boundaries
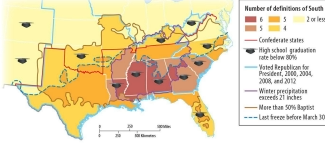
Perceptual (a.k.a vernacular) region
See map to the right. People have perceptions (things they believe exist) about regions. The map on the right is a perfect example of perceptions of “the South” What are your perceptions of other regions, such as “New England” or “SoCal”?
Map scales
s tell us how much map distance there is relative to ground distance, Map distance to (or vs.) Ground distance
Goode’s, map projection
-“Interrupted” -Equal area
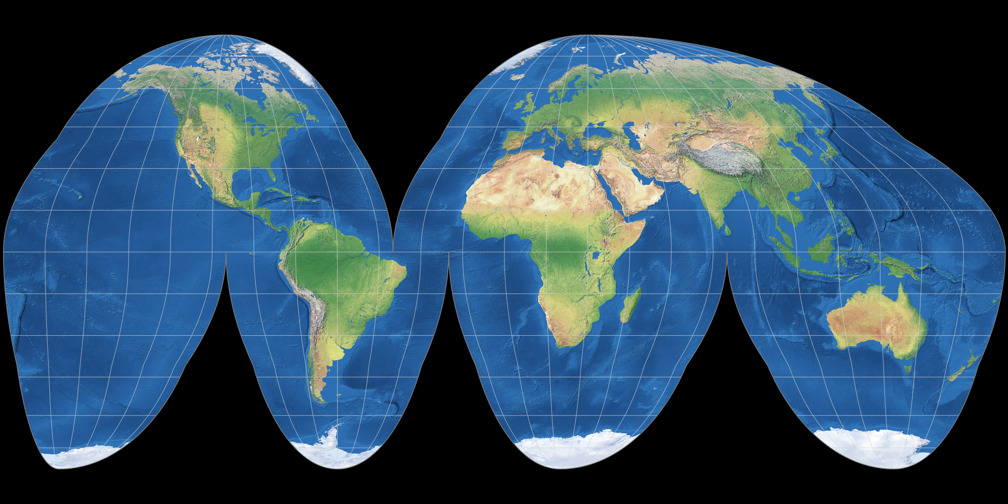
Robinson
-Hard to see polar land masses -Useful for displaying info across oceans

Mercator
-Accurately shows direction -Distorts size of some land masses -Shape is preserved

isopleth
a thematic map that uses lines or colored bands to connect locations sharing equal or constant numerical values

choropleth
Different shades or color intensities reflect the magnitude of the data, where darker colors typically mean higher values and lighter colors mean lower values

dot density
uses uniform dots placed randomly within geographic boundaries to show the concentration and distribution of a specific variable or numeric count

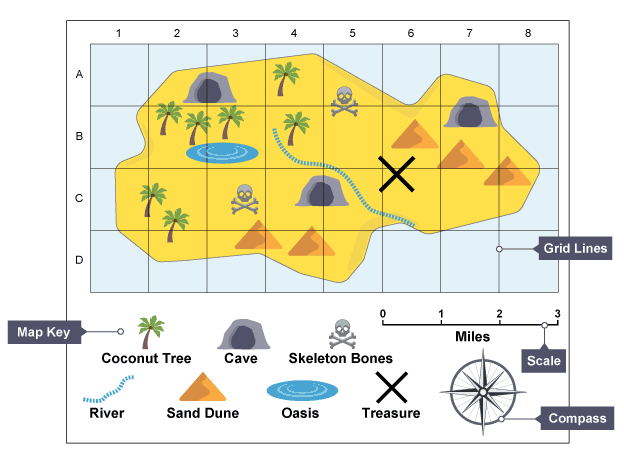
reference
a set of numbers and letters used to locate a specific point or area on a map
topograph
a detailed, two-dimensional drawing that shows the three-shaped ups and downs of the Earth's surface, including elevation, natural features, and man-made structures

cartogram
is a thematic map where the sizes, shapes, or areas of geographic regions are intentionally distorted to be directly proportional to a specific data variable

floline
a type of thematic map that shows the movement of people, goods, money, or information between places, using lines of varying thickness to represent volume or magnitude

distance decay
the longer it takes me to connect from point A to point B, the less likely I will have a strong connection to point B. I frequently go to Pleasanton, so I have a strong connection. However, if Pleasanton were 10 more miles further than it is, that connection would begin to decay because it takes me longer to get there.
Space-time compression
the relative distance (not the absolute distance) between two points becomes shorter when you can get there faster. If it was 1830 and I wanted to go to New York from San Francisco, it would take me a lot longer because I would have to travel over land or by boat around the tip of S. America. Now that it is 2020 and I can fly, the relative distance between New York and San Francisco is shorter. Obviously, the physical distance hasn’t changed, but the time it takes to get there has gotten shorter (compressed).
Sustainability
balancing the needs of the environment and people with the existing natural resources available to them and make them available in the future.
Possibilism
ability of humans to use technology to overcome the limitations of climate and modify the landscape. If you live in a cold climate, you may need to use technology in combination with the natural resources like plants or animals to overcome the limitations of living in a cold climate. Using technology to make sugar from sugar beets made sugar possible in cold climates, when most sugar is made from evaporated cane juice from sugarcane grown in the tropics.
Environmental Determinism
claim that the physical environment (the natural landscape) determines the social development of people. An example of this may be how living in a desert influences how you live, what you do, what you build, how you entertain yourself. It is the thought that your environment determines who you are and what you do (generally speaking).
polder
land made from water *Know what it looks like

data scale (scale of analysis)
the geographic level—such as global, regional, national, or local—used to organize, study, and interpret data
remote sensing
the science of collecting data about an object, area, or the Earth's surface from a distance without physical contact

GPS
a satellite-based navigation tool that finds exact coordinates (latitude, longitude, and altitude) and time anywhere on Earth
GIS
a computer software system that stores, manages, analyzes, and visualizes spatial data
site
The physical characteristic of a place
region
An area distinguished by a unique combination of trends or features
Place
A specific place on Earth, distinguished by a particular characteristic.
Spatial analysis
Comparing what is around us/on the stimulus and analyzing why a feature is there/not there
Cultural Landscape
Features we can see (visually) that reflect EsPEnd
Isoline
An isoline map is a thematic map that uses continuous lines to connect points sharing the same numerical value, turning complex data gradients into easy-to-read visual patterns

Proportional symbol map
The size of the symbol represents the data

site features/ factors
What makes location unique what is there what is the what makes it special what is it known for ex livermore is known for vineyards hills (all makes livermore unique) describing the location