STATS2- correlation & pearson's r
1/13
There's no tags or description
Looks like no tags are added yet.
Name | Mastery | Learn | Test | Matching | Spaced | Call with Kai |
|---|
No analytics yet
Send a link to your students to track their progress
14 Terms
what is a correlation
relationship between 2+ non-independent variables
what does correlation measure
covariance: extent to which change in 1 variable is associated with predictable changes in another variable
4 features of correlational research design
measures if 2 variables are related
can’t infer causality
produces positive or negative correlations
eg: linear correlations
what does it mean when you have high co-variance
if scores for 1 variable change then the scores for the other variable changes in a predictable way
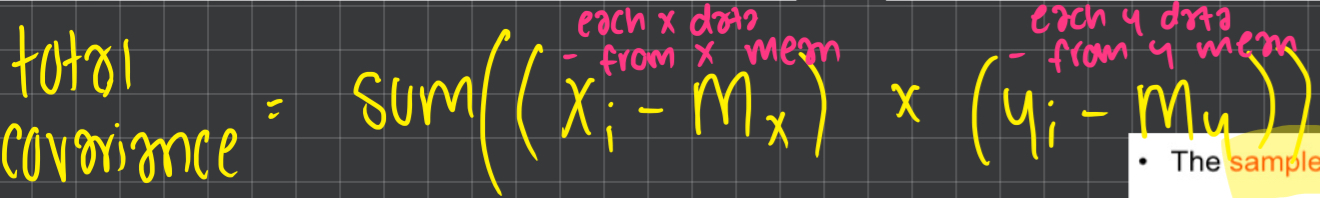
total covariance
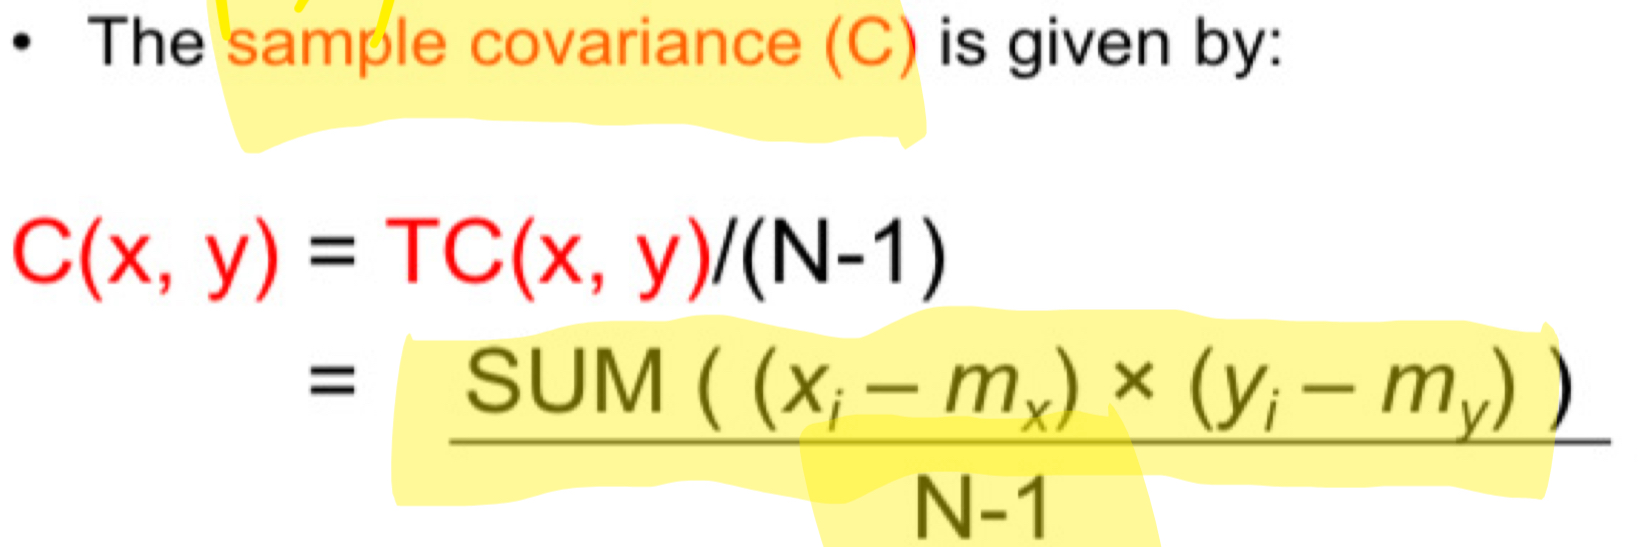
sample covariance
pearson’s r
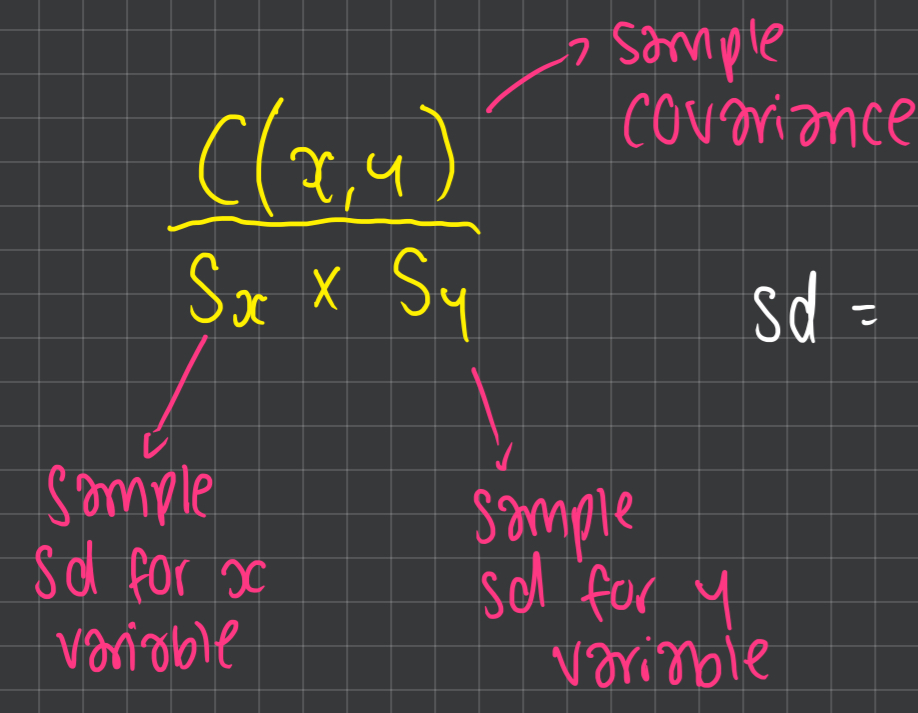
how to work out standard deviation from variance
sd= square root of variance
values for perfect positive/negative & no correlation
perfect positive correlation= 1
perfect negative correlation = -1
no correlation = 0
values for strong positive/negative correlation
0.9-0.7 or -0.9 - -0.7
values for moderate positive/negative correlation
0.6-0.4 or -0.6 - -0.4
values for weak positive/negative correlation
0.3-0.1 or -0.3 - -0.1
4 steps for pearson’s r test
hypothesis: x correlation between variables
collect data & calculate pearson’s r
calculate p value
reject or fail to reject null hypothesis
pearson’s > critical value = reject null
what to do with negative r values when looking at critical values table
ignore -