Measures of economic performance theme 2
1/70
There's no tags or description
Looks like no tags are added yet.
Name | Mastery | Learn | Test | Matching | Spaced | Call with Kai |
|---|
No study sessions yet.
71 Terms
GDP
the value of all goods and services produced in an economy in a one year period
Nominal GDP
The actual value of all goods and services produced in an economy not adjusted to inflation
Real GDP
The value of all goods and services produced in an economy, adjusted to inflation
GDP per capita
GDP/Population
shows the mean wealth of each resident in a country
Makes it easier to compare standards of living between countries
Negative of using GDP
Doesn’t consider the income earned by its citizens while operating outside of the country
What does value of GDP mean
The monetary worth
What does the volume of GDP mean
The physical number
GNI
Measures the total income earned by a country’s residents and businesses regardless of where is is generated during a given period
adjusts for cross-border income flows
What is GNI often used for
To compare the economic well being of a country’s residents
To set eligibility thresholds for development assistance because it traces income to the nationality of the earner rather than to the geographic place of production
National income statistics
Useful for making comparisons between country’s
They provide insights on the effectiveness of government policies
Allow judgements to be made about the relative wealth and standard of living within each country
allow for comparisons to be made over the same or different time periods
Why real GDP is better than nominal GDP
One country may have a much higher rate of economic growth but also a much higher rate of inflation.
Real GDP provides a better comparison
HOWEVER
Using real GDP/capita provides better information than real GDP as it takes population differences into account
Using real GNI/capita is a more realistic metric for analysing the income available per person than GDP/capita
Purchasing Power Parity
It shows the number of units of a country's currency that are required to buy the same baskets of products in the local economy, as $1 would buy of the same products in the USA or another country
Aim of PPP
to help make a more accurate standard of living comparison between countries where goods and services cost different amounts
If a basket of goods cost $150 in Vietnam (once the currency has been converted) and the same basket of goods cost $450 in the USA, the purchasing power parity would be 1:3
It seems like the cost of living is much higher in the USA
However, if the USA GNP/capita is more than three times higher than the GNP/capita of Vietnam, it could be argued the USA has better standards of living
difficulties of PPP
Countries have different tastes and preferences.
Choosing the items to use in the basket of products is difficult.
For example, cheese may not be popular in some countries and there are lots of different types of cheese too
Limitations of Using GDP Data To Compare Living Standards Between Countries and Over Time
Lack of information provided |
|
|---|---|
Quality of goods/services |
|
Does not include unpaid/voluntary work |
|
Differences in hours worked |
|
Environmental factors |
|
National happiness
happiness focuses on health, relationships, the environment, education, satisfaction at work and living conditions
provide normative data over positive
Easterlin Paradox
Happiness and increases in income have a direct relationship up to a point
Beyond that point, the relationship is less evident
Inflation
The sustained increase in the average price level of goods/services in an economy
Deflation
Fall in the average price of goods and services in an economy
Disinflation
When the average price level is still rising but at a lower rate than before
CPI
A 'household basket' of 700 goods/services that an average family would purchase is compiled on an annual basis
A household expenditure survey is conducted to determine what goes into the basket
Each year, some goods/services exit the basket and new ones are added
Goods/services in the basket are weighted based on the proportion of household spending
E.g. More money is spent on food than shoes, so shoes have a lower weight in the basket
Each month, prices for these goods/services are gathered from 150 locations across the UK
These prices are averaged out
The price x the weighting determines the final value of the good/service in the basket
These final values are added together to determine the price of the 'basket
The percentage difference in CPI between the two years is the inflation rate for the period
limitations of CPI
The CPI provides a level of inflation for the average basket and the basket of many households is not the average basket
Depending on what households buy, the level of inflation for each one can vary significantly
As an average, it also ignores regional differences in inflation
The CPI is one of several methods used by countries in determining inflation; another is the retail price index (RPI)
This can make comparisons between countries less meaningful, as one may use the RPI and another the CPI
The CPI does not capture the quality of the products in the basket
Product quality changes over time, so the comparison with different time periods is less useful
The CPI only measures changes in consumption on an annual basis
Changes in consumption can occur more frequently and the index is always behind these changes
RPI
The retail price index (RPI) is calculated in exactly the same way as the CPI
Certain goods/services that are excluded from the CPI are included with the RPI
These include council tax, mortgage interest payments, house depreciation, and other house purchasing costs such as estate agents fees
RPI as a measure of inflation
Inflation measured using the RPI is usually higher than the CPI
This is mainly due to its sensitivity to interest rate changes, which affect mortgage interest
It's argued that the RPI is a more accurate indication of household inflation
Demand pull inflation
Caused by excess demand in the economy (increased AD)
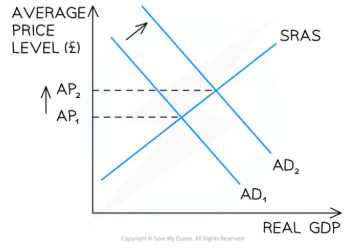
Diagram analysis of demand pull inflation
If any of the four components of AD increase, there will be a shift to the right of the AD curve from AD1 → AD2
At the original price (AP1), there is now a condition of excess demand in the economy
As prices rise, there is a contraction of AD and an extension of SRAS
Prices for goods and services are bid up from AP1 → AP2
Demand pull inflation has occurred
Cost push inflation
Cost push inflation is caused by increases in the costs of production in an economy
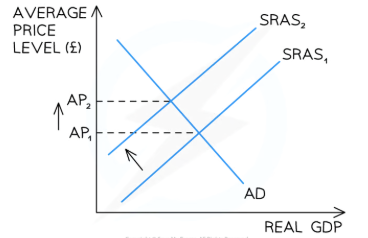
Diagram analysis of cost push inflation
If any of the costs of production increase (wages, raw materials, etc.), there will be a shift to the left of the SRAS curve from SRAS1→SRAS2
At the original price (AP1), there is now a condition of excess demand in the economy
As prices rise, there is a contraction of AD and an extension of SRAS
Prices for goods/services are bid up from AP1→AP2
Cost-push inflation has occurred
Changes to the money supply
If the Central Bank lowers the base rate, there is likely to be increased borrowing by firms and consumers
This will result in an increase in consumption and investment
It is likely to lead to a form of demand-pull inflation
The Central Bank can also increase the money supply through quantitative easing
This will result in increased liquidity and lower interest rates
It is likely to lead to a form of demand-pull inflation
Change to Wages
Increased aggregate demand in an economy causes demand pull inflation
Workers now feel less well off as their wages no longer have the same purchasing power
Workers may demand wage increases to compensate for the higher prices
Those wage increases are now a form of cost-push inflation (increased costs of production) and drive prices even higher
This economic phenomenon is called the wage-price spiral
Effects of Inflation on Firms
Uncertainty. Rapid price changes create uncertainty and delay investment
Menu change costs. Price changes force firms to change their menu prices too and this can be expensive
Effects of inflation on consumers
Decrease in purchasing power
Decrease in the real value of savings (as money will be worth less in real terms)
Fall in real income for those on fixed incomes/pension
effects of inflation on the government
Inflation erodes international competitiveness of export industries
Trade-offs involved in tackling inflation e.g reducing inflation may increase unemployment and/or reduce economic growth
effects of inflation on workers
Demand higher wages to compensate for reduced purchasing power
If wage increases ≠ inflation, motivation and productivity may fall
unemployment
Someone is considered unemployed if they are not working but actively seeking work
Labour force
The labour force consists of all workers actively working and the unemployed (who are seeking work)
Usually between the ages of 16-65
Non labour force
The non-labour force includes all those not seeking work e.g. stay-at-home parents, pensioners, schoolchildren, and students
Economically inactive are those between 16 and 65 and not working or not seeking work, e.g. early retire
ILO
An extensive survey is sent to a random sample of ≈ 60,000 UK households every quarter
Respondents self-determine if they are unemployed based on the ILO criteria
Ready to work within the next two weeks
Have actively looked for work in the past one month
The same survey is used globally so it's useful for making international comparisons
The claimant count
Counts the number of people claiming job seekers allowance (JSA) in the UK
More stringent requirement to be considered unemployed than with the ILO survey
Requires claimants to meet regularly with a 'work coach'
Underemployment
They want to work more hours than they currently work
They are working in a job that requires lower skills than they have, e.g. an architect working as a gym instructor
What type of unemployment is underemployment
Often a response to cyclical unemployment
Workers who have lost their jobs in a weak economy are willing to take part-time jobs or accept roles outside of their main skill base
Underemployment is also a consequence of structural unemployment
Unless workers retrain and gain new skills, it will be hard for them to gain full employment
Changes in rates of the Employment rate
The employment rate could be increasing even as the unemployment rate is increasing.
May be caused by increased immigration, which causes working-age population to increase
May be caused by a decrease in the inactivity rate as people move from inactive to employed
Changes in unemployment rates
Unemployment rates do not capture the hidden unemployment that occurs in the long term
Workers look for a job but may eventually give up and become economically inactive
This actually improves the unemployment rate as fewer people are actively seeking work
Structural unemployment
Occurs when there is a mismatch of skills in the economy
e.g. the secondary sector is declining and the tertiary sector is growing: deindustrialisation
Cyclical unemployment
Caused by a fall in AD in an economy
As output falls in the economy, firms lay off workers
Seasonal uneployment
Occurs as certain seasons come to an end and labour is not required until the next season
E.g. fruit pickers; summer seaside resort workers; ski instructor
Frictional unemployment
Occurs when workers are between jobs
This is usually short-term unemployment
Workers have voluntarily left their previous job to search for another
Real wage unemployment
Occurs when wages are inflexible at a point higher than the free-market equilibrium wage
Usually caused by the existence of minimum wage laws
The higher wage creates an excess supply of labour
This excess supply represents real wage unemployment
Importance of Labour
Labour is a key factor of production and one way to expand output in an economy is to increase the amount of labour available
This is often achieved through easing the inward migration policies (immigration)
UK migration
The UK has experienced significant immigration since the 1990's, especially from Eastern Europe
Net migration is the difference between inward migration and outward migration (emigration)
Less developed economies generally have net outward migration
More developed economies generally have net inward migration
More developed economies usually have skilled workers emigrating
Significance of migration on employment
The immigrants usually fill vacancies that the local citizens cannot (or will not) fill
These tend to be manual labour, dangerous, and low-skilled jobs
The increased supply of labour may push down wages in the economy, especially for low-skill jobs
Lower average wages are an incentive for employers to hire more workers
Employment may increase as a result
Immigration results in an increased population, which increases consumption in the economy
Greater output requires more labour so it creates more jobs
Significance of migration on unemployment
Immigrants may displace some local workers, increasing the level of unemployment
Dependents of immigrants may be unable to find work and register as unemployed
Effects of unemployment on Firms
Loss of sales revenue
loss of output
changes in the skill level in the economy
Effects of unemployment on the government
Increased speding on benifits
less tax revenue
increased spending on retraining
Effects of unemployment on the economy
Increased crime and vandalism
increased anti social behaviour
increased homelessness
Effects of unemployment on individuals
Loss of income
health issues
mental instability
sense of failure
suicide
What is balance of payments
A record of all the financial transactions that occur between a country and the rest of the world
Sections of the BoP
Current account
Capital account
Financial account
What is the current account
a record of all the transactions related to goods/services along with payments related to the transfer of primary and secondary income
What is the financial and capital account
all transactions related to savings, investment and currency stabilisation
What is Currency stabilisation
Refers to the government intervention in exchange markets so as to influence the price of a currency
Why is the current account considered the most important
It records the net income that an economy gains from international transactions
what is a credit
The provision of funds (loans, overdrafts, mortgages, credit cards) that allow spending before income is received, with the agreement to repay in the future (often with interest).
Recieved
What is a debit
A debit is an entry in accounts that usually represents money flowing out of an account, or a reduction in value for the owner
what the business owns or spends.
Sent
Net income
Consists of income transfers by citizens and corporations
Credits are received from UK citizens who are abroad and send remittances home
Debits are sent by foreigners working in the UK back to their countries
Current transfers
Typically payments at government level between countries, e.g. contributions to the World Bank, foreign aid
The Current Account balance is often expressed as a % of GDP
This allows for easy international comparisons
Current account deficit
Occurs when the value of the outflows is greater than the value of the inflows
Usually occurs when the debits from imports > credits from exports
Current account surplus
Occurs when the value of the inflows is greater than the value of the outflows
Usually occurs when the debits from imports < credits from exports
UK government current account
The UK government has a macroeconomic aim to reduce the Current Account imbalance to achieve as close to equilibrium as possible
The UK has run a current account deficit since 1985
Export-led economic growth would help it become less negative, although realistically this is unlikely for a long time
However, with increasing income and wealth in an economy, the value of imports rises
Consumers enjoy the variety of goods/services abroad
Rising imports push the balance towards a greater deficit
How to correct the current account deficit
The government could raise tariffs
This would likely decrease imports bought by households
Firms that rely on imports for raw materials used in production would now face higher costs of production
These higher costs are likely to be passed on to consumers in the form of higher prices
Reducing the current account deficit has come at the expense of increased inflation in the economy; there has been a trade-off
The interconnectedness of economies through trade
The world is more connected than ever and there is a high level of interdependence between economies
COVID-19 and the Ukraine War demonstrated how disruptions in one part of the world cause widespread problems in others
One country's imports are another country's exports
Theoretically, the global value of exports will be equal to the global value of imports
Producers all over the world are often highly dependent on imported raw materials used in production