BPrac B - General
1/18
There's no tags or description
Looks like no tags are added yet.
Name | Mastery | Learn | Test | Matching | Spaced | Call with Kai | Chat |
|---|
No analytics yet
Send a link to your students to track their progress
19 Terms
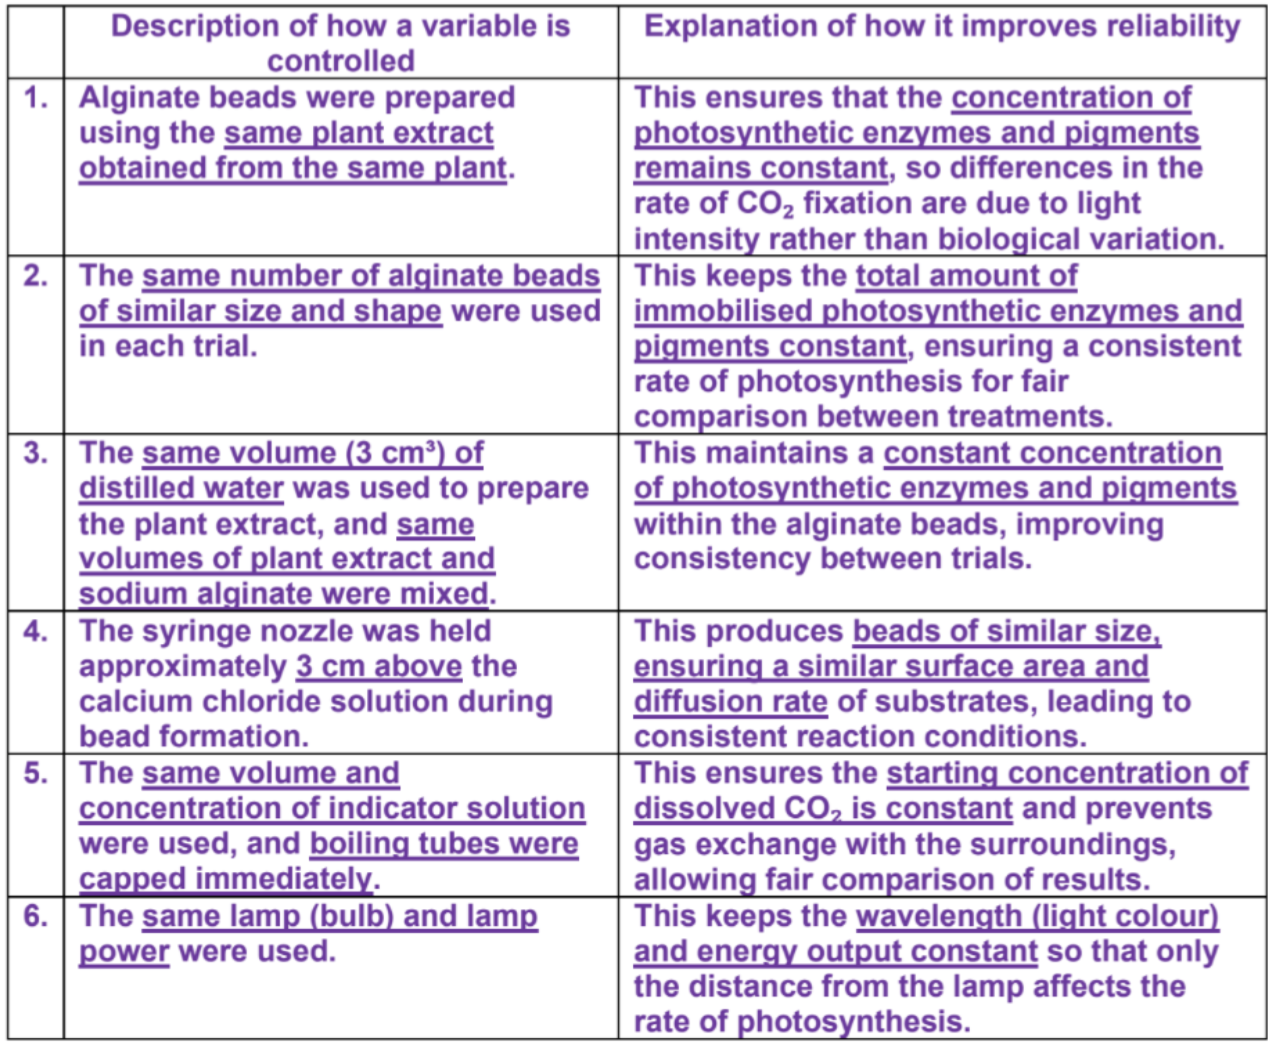
Describe and explain how two variables in this procedure were controlled to improve the reliability of the results (Experiment: place boiling tube in front of lamp, time taken for indicator to change colour)
Units for (±, x/, average, division over a constant)
Addition or subtraction : follow least number of decimal place
Multiplication or division : follow least number of sf
Eg. 2.5 (2sf) /15.7 (3sf) = 0.16 (2sf)
Values given count in sf
Average : follow value measured on instrument in sf
Eg. Micrometer screw gauge : (18.36 (2dp) + 18.26) / 2 = 9.155mm (4sf)
Division over a constant : follow sf of raw data
M = mol/L = mol dm^-3 (NOT mol/dm^3)
Even if time in minutes, convert to seconds
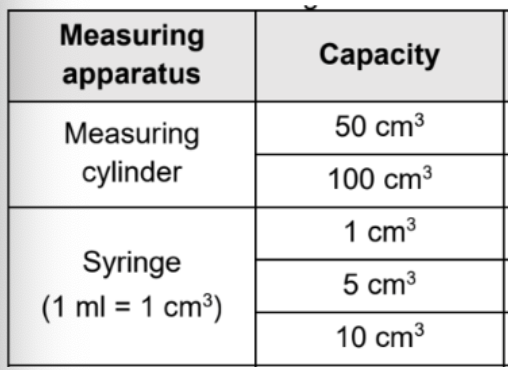
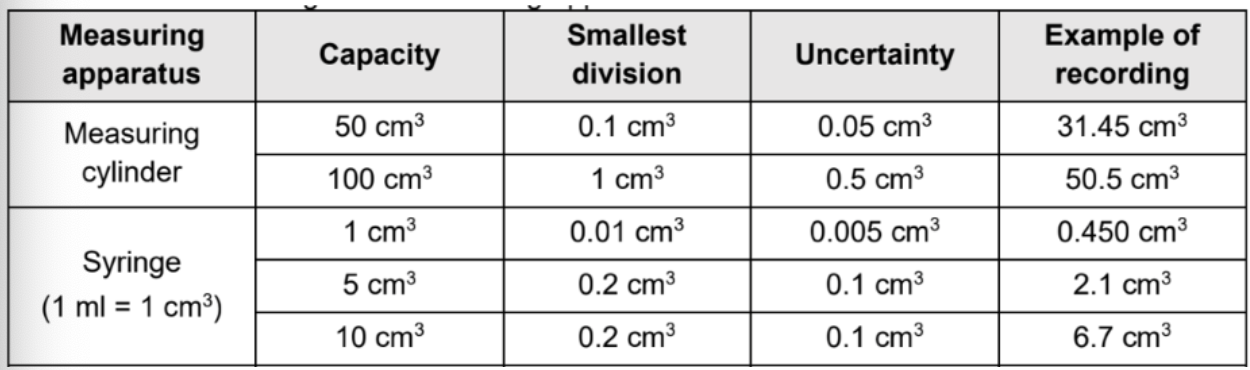
1ml = 1cm^3
State units of
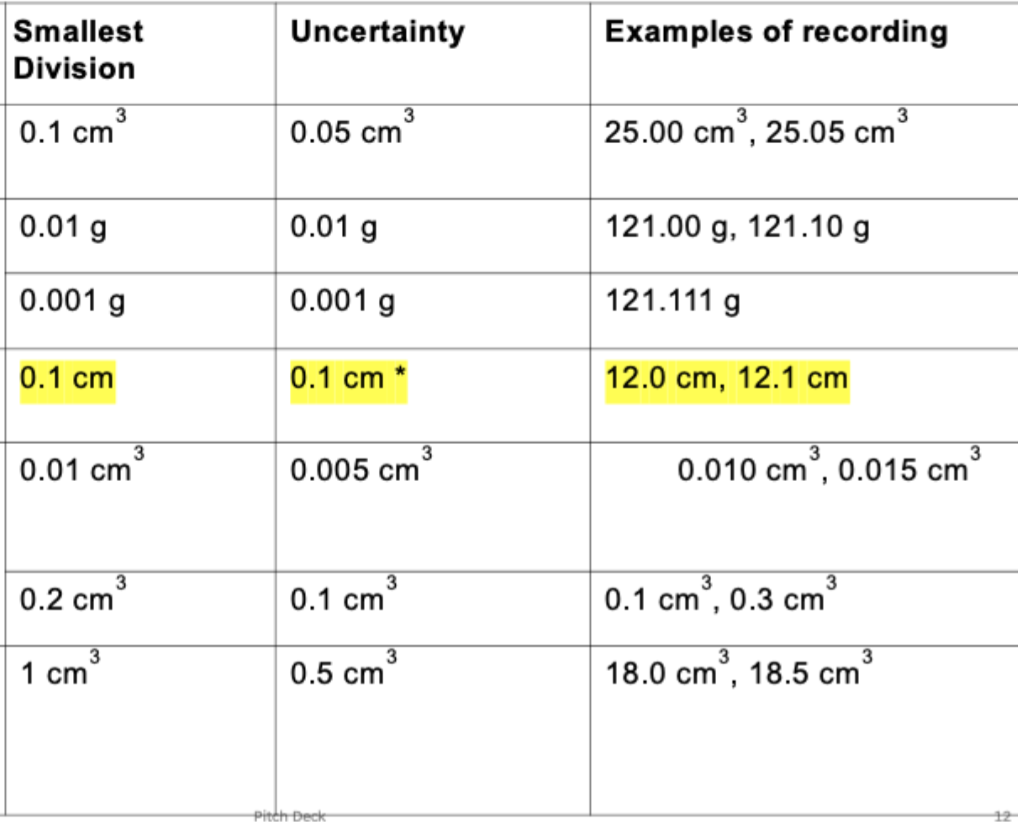
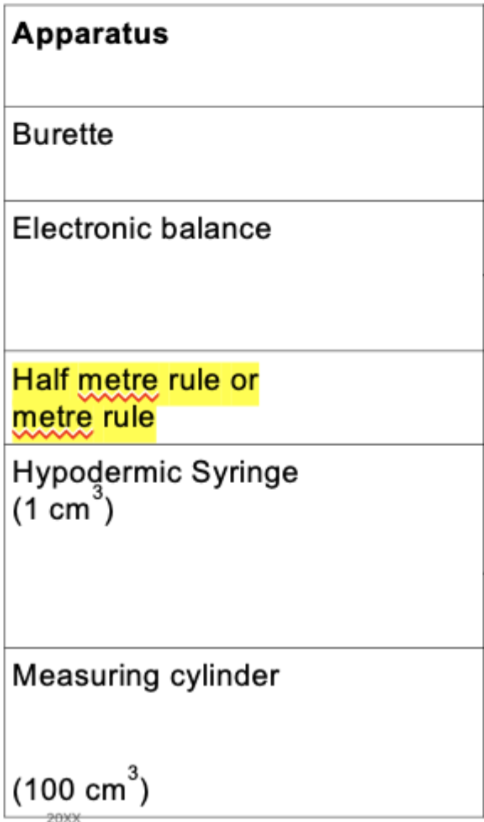
Why metre rule do not take to uncertainty value 0.05
Base value of syringes are fixed but for ruler it is not , so there is 2 uncertainties, 0.05 x2 = 0.1
Explain how you would expect result to be different
Use results recorded! (Eg. Colour of solution, pH) + Explanation
For % change : must put negative if final less than initial
(regardless whether it says % decrease) (it's not math) Eg. 19-25/25 x 100% = -24%
Eg. Inheritance : independent of gender/sex , discontinuous variation
Plant, what can you conclude about relationship between rate of bubbling and light intensity
Rate of bubbling increases with increasing light intensity , because light intensity is the limiting factor
After a while , the rate of bubbling remains constant even with increasing light intensity , light is no longer a limiting factor
Other factors such as pH or temp or CO2 conc is the limiting factor
Volume of gas collected within certain time table
Concentration of catalase / % | Volume of gas collected in 10s / cm^3 | Rate of gas production / cm^3/s |
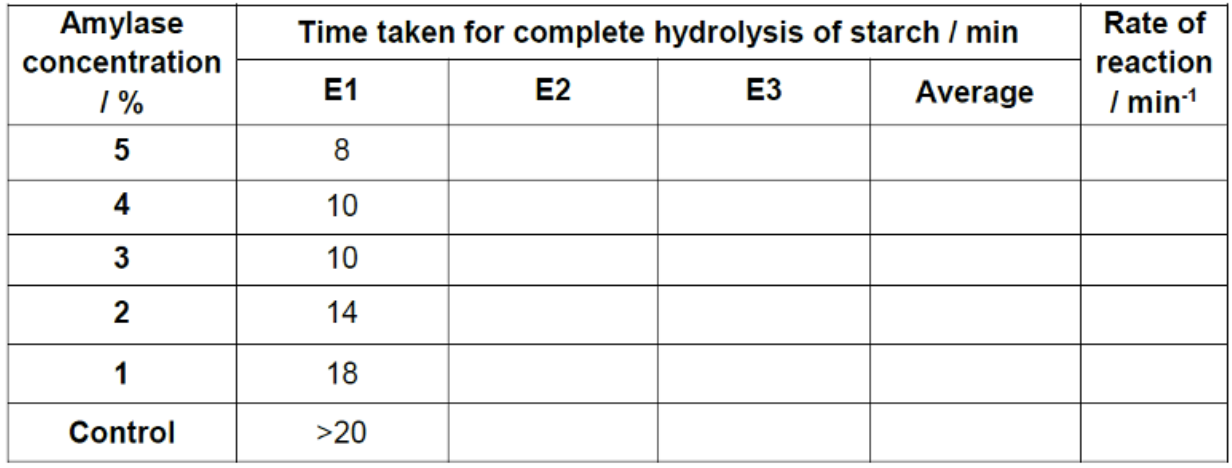
Rate of reaction table (time taken for complete hydrolysis of starch for diff amylase conc)
Observations
Include colour and clarity + initial and final appearance
Cloudy : light can still pass through -> mixture
Eg. Content changed from clear, blue solution to a cloudy, blue mixture suspended with a little reddish-brown precipitate
Eg. Content changed from a clear, blue solution to an opaque, orange mixture (NO orange or green ppt)
Give either the closest value or RANGE (don't try and estimate the value)
Explain which measurements is anomalous
Petri dish 2 as the number is an outlier amongst the other petri dish results. Exclude it from the mean / repeat experiment.
Explain why the use of agar blocks may not be suitable model for investigating diffusion
Size -> actual organisms are much smaller , SATVR greater
Shape -> different shapes -> diff SA
Agar blocks uses liquids while O2 and CO2 are gases diffusing into cells -> diff rate of diffusion
Explain why student calculated % change instead
To ensure change in mass of potato is proportional to initial mass of potato, allow valid comparison between potato in different NaCI solution as initial mass is not constant
Explain why student saying WP of potato is 3% is inaccurate (Even tho graph cuts x-axis at 3%)
Conclusion is only supported for onions left for 2 hours
Water potential of potatoes when left for 48 hours is 3.1% sodium chloride concentration
Intermediate concentrations (of sodium chloride) not tested (between 1% and 5% sodium chloride) -> less accurate results
Not all onion cells have the same water potential
There is an anomalous results of 5% on graph (shown on previous page)
Even if time in minutes, convert to seconds (ALWAYS WHOLE NUMBER FOR TIME)
Rate of reaction s-1 -> 1 dp
State units for these
Explain results obtained
Explain results obtained
Increasing concentration of ethanol causes an exponential increase in absorbance values
Compare systematic VS random error
Systematic: consistent and repeatable in the same direction every time the instrument is used
Eg. Line at 1.0 cm3 on the syringe actually measures a volume of 0.95 cm3 and not 1.0 cm3 -> dilution ratio between tubes stays proportionally consistent because the same 0.95 cm³ (instead of 1.0 cm³) is being used across every tube -> no effect on result
IF syringe is used to measure a single, one-off volume used (Eg. 1.0 cm³ of enzyme was added) -> will effect result
Random: error that causes readings to vary unpredictably (over or understate)
Safety precaution for beetle?
Beetle may carry pathogens. Wear gloves and use the forceps when handling. Wash hands thoroughly with soap after the experiment.