econ test 1-3
1/130
There's no tags or description
Looks like no tags are added yet.
Name | Mastery | Learn | Test | Matching | Spaced |
|---|
No study sessions yet.
131 Terms
Here are three things you could do if you do not attend your economics class: watch television with some friends (you value this at $25), read a good book (you value this at $17), or go to work (you could earn $20 during the economics class). The opportunity cost of going to your economics class is
a. $20, because this is the only alternative of the three where you would actually receive a monetary payment.
b. $17, because this is the lowest valued alternative forfeited.
c. $25, because this is the highest valued alternative forfeited.
d. $62, because this is the total dollar sum of the three forfeited alternatives.
$25, because this is the highest valued alternative forfeited.
Which of the following is a positive macroeconomics statement?
a. The central bank should increase the nation's money supply.
b.The increase in the nation's money supply helped push the nation's unemployment rate down in the short run.
c. Ford Motor Company's new advertising campaign ended up hurting General Motors' sales.
d. The local government ought to spend more on recreational facilities.
The increase in the nation's money supply helped push the nation's unemployment rate down in the short run.
Prior to attending college, Malik mis offered a lucrative four-year contract as an actor on a daytime soap opera. Assuming that acting and attending college are Malik's preferred alternatives and that he must choose between these two options, his opportunity cost of attending college after receiving the offer on the soap opera _______, making him ________ likely to attend college than before he received the offer.
a. increases; less
b. decreases; more
c. stays the same; equally likely
d. increases; more
increases; less
Explanation:
Opportunity cost = value of the next best alternative forgone.
Before the offer, the cost of attending college might have been smaller (e.g., forgone earnings or leisure).
After the lucrative acting offer, the value of the next best alternative (acting) increases.
Therefore, the opportunity cost of attending college increases, making him less likely to attend college.
*Decision making "at the margin" means making a choice based on
a. the total benefits
b. the total costs
c. comparing the total benefits and costs
d. comparing the additional benefits and costs
comparing the additional benefits and costs
Explanation:
Marginal analysis involves comparing additional (marginal) benefits and additional (marginal) costs of a decision.
Instead of looking at total costs or total benefits, you focus on the effect of one more unit or one more action.
Points that lie inside (or below) the PPF are
a. unattainable.
b. attainable and productive efficient.
c.attainable and productive inefficient.
d. attainable and neither productive efficient nor productive inefficient
c.attainable and productive inefficient.
Consider two points on a PPF: point A, at which there are 500 oranges and 100 apricots, and point B, at which there are 501 oranges and 95 apricots. If the economy is currently at point B, the opportunity cost of moving to point A is
a. 5 apricots.
b. 1 orange.
c. 95 apricots.
d. 500 oranges.
1 orange.
Explanation:
Moving from B → A:
Oranges decrease from 501 → 500 (lose 1 orange)
Apricots increase from 95 → 100 (gain 5 apricots)
Opportunity cost of gaining 5 apricots = 1 orange forgone
An increase in the quantity of resources available
a. shifts the PPF inward.
b. shifts the PPF outward.
c. moves the economy to a new point up along a given PPF.
d. moves the economy to a new point down along a given PPF.
? shifts the PPF outward ?
Explanation:
The PPF (Production Possibilities Frontier) shows the maximum possible output combinations given resources and technology.
If the quantity of resources increases, the economy can produce more of both goods.
This causes the entire PPF to shift outward.
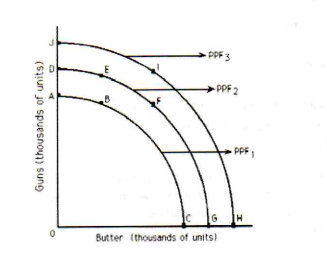
Refer to Figure 2-2. If the economy is operating at PPF2, then point inefficiency.
a. D
b. F
c. C
d. J
C

Refer to Figure 2-2. If the economy is operating at PPF2, a significant loss of the quantity of resources available could
a. move this economy from point D to point G on PPF2.
b. shift this economy to PPF1.
c. shift this economy to PPF3.
d. not affect this economy.
shift this economy to PPF1.
A PPF is bowed outward as a result of
a. constant opportunity costs.
b. increasing opportunity costs.
c. decreasing opportunity costs.
d. scarcity
increasing opportunity costs
Explanation:
A bowed-out (concave) PPF occurs when resources are not equally efficient in producing all goods.
As more of one good is produced, you give up increasing amounts of the other good.
This reflects increasing opportunity costs.
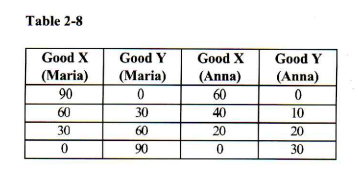
Refer to Table 2-8. For Anna, the opportunity cost of producing one unit of good X is _____ unit(s) of good Y.
a. 2.00
b. 1.00
c. 10.00
d. 0.50
0.50
Moving from producing 0 X → 20 X, Y decreases from 30 → 20, so 10 Y is given up for 20 X.
opportunity cost per unit of X = 10 ÷ 20 = 0.5 Y per X

Refer to Table 2-8. For Maria, the opportunity cost of producing one unit of good X is ___ unit(s) of good Y
a. 2.00
b. 1.00
c. 10.00
d. 0.50
1.00
Moving from producing 0 X → 30 X, Y decreases from 90 → 60, so 30 Y is given up for 30 X.
Opportunity cost per unit of X = 30 ÷ 30 = 1 Y per X

Refer to Table 2-8. Who has the comparative advantage in the production of good X?
a. Maria
b. Anna
c. Both Maria and Anna
d. Neither Maria nor Anna
Anna
Step 1: Recall comparative advantage
Comparative advantage = lower opportunity cost of producing a good.
Step 2: Calculate opportunity costs
Maria: 1 unit of X costs 1 Y
Anna: 1 unit of X costs 0.5 Y
Step 3: Compare
Anna has the lower opportunity cost of producing X.

Refer to Table 2-8. Who has the comparative advantage in the production of good Y?
a. Maria
b. Anna
c. Both Maria and Anna
d. Neither Maria nor Anna
Maria
Step 1: Recall comparative advantage
Comparative advantage = lower opportunity cost of producing a good.
Step 2: Opportunity cost of producing Y
Maria: 1 unit of Y costs 1 X (since 1 X costs 1 Y, inverse is the same)
Anna: 1 unit of Y costs 2 X (since 1 X costs 0.5 Y, then 1 Y costs 2 X)
Step 3: Compare
Maria has the lower opportunity cost of producing Y.
In an eight-hour day, Andy can produce either 24 loaves of bread or 8 pounds of butter. In an eight-hour day, John can produce either 8 loaves of bread or 8 pounds of butter. The opportunity cost of producing 1 pound of butter is
a. 1/3 hour for Andy and 1 hour for John.
b. 1 hour for Andy and 1 hour for John.
c. 3 loaves of bread for Andy and 1 loaf of bread for John.
d. 1/3 loaves of bread for Andy and 1 loaf of bread for John.
3 loaves of bread for Andy and 1 loaf of bread for John
Step 1: Calculate Andy’s opportunity cost
Andy: 8 pounds of butter = 24 loaves of bread → 1 pound of butter = 24 ÷ 8 = 3 loaves of bread
Step 2: Calculate John’s opportunity cost
John: 8 pounds of butter = 8 loaves of bread → 1 pound of butter = 8 ÷ 8 = 1 loaf of bread
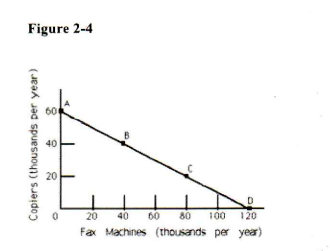
Refer to Figure 2-4. The opportunity cost of moving from point A to point B is
a. 60,000 copiers.
b. 40,000 copiers.
c. 20,000 copiers.
d. 40,000 fax machines.
20,000 copiers.
Which of the following illustrates the law of demand?
a. Jorge buys fewer pencils at $2 per pencil than at $1 per pencil, ceteris paribus.
b. Chen buys more ice cream at $4 per half-gallon than at $3 per half gallon, ceteris paribus.
c. Karissa buys fewer sweaters at $50 each than at $75 each, ceteris paribus.
d. Jim buys more books at $15 each than at $12 each, ceteris paribus.
Jorge buys fewer pencils at $2 per pencil than at $1 per pencil, ceteris paribus.
The law of demand states that, ceteris paribus, when the price of a good rises, the quantity demanded falls, and when the price falls, quantity demanded rises.
Analyze the options:
A: Jorge buys fewer pencils at higher price → ✅ Law of demand
B: Chen buys more at higher price → ❌ Violates law of demand
C: Karissa buys fewer sweaters at lower price → ❌ Incorrect (quantity demanded should rise when price falls)
D: Jim buys more books at higher price → ❌ Violates law of demand
An increase in the number of buyers in a particular market for a good will result in a ____________ for that good.
a. movement up along the demand curve
b. movement down along the demand curve
c. leftward shift in the demand curve
d. rightward shift in the demand curve
rightward shift in the demand curve
Explanation:
An increase in the number of buyers increases demand at every price.
This does not cause movement along the demand curve; it causes the demand curve itself to shift.
More buyers → rightward shift in the demand curve.
If people begin to favor science fiction novels to a greater degree than previously, the demand curve for science fiction novels
a. shifts rightward.
b. shifts leftward.
c. stays constant.
d. can shift either rightward or leftward.
shifts rightward
Explanation:
A change in consumer preferences that increases the desire for a good raises quantity demanded at every price.
This causes the demand curve to shift to the right.
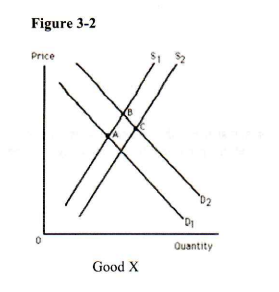
Refer to Figure 3-2. Assume that good X is a normal good. Suppose equilibrium moves from point B to point C.
Which of the following is consistent with the change in equilibrium?
a. An increase in resource prices, whereas income remains constant.
b. A decrease in resource prices, whereas income remains constant.
c. An increase in resource prices, whereas income decreases.
d. An increase in resource prices, whereas income increases.
A decrease in resource prices, whereas income remains constant
Movement down and to the right typically indicates:
Lower equilibrium price
Higher equilibrium quantity
If resource prices decrease, production becomes cheaper, shifting the supply curve rightward.
With income constant and good X being normal, the demand curve does not shift.
This explains lower price and higher quantity.
As the price of good A rises as a result of a decrease in the supply of good A, the demand for good B rises.
Therefore, goods A and B are
a. normal goods.
b. inferior goods.
c. substitutes for one another.
d. complements to one another.
substitutes for one another.
"As the price of apples goes up, the demand for apples goes down." The author of this statement
a. implies that price and demand are unrelated.
b. uses the word "demand" when he should use the word "supply."
c. uses the word "demand"when he should use the words "quantity demanded."
d. implies that demand and price have a direct relationship
uses the word "demand"when he should use the words "quantity demanded."
Explanation:
The law of demand states that as price rises, quantity demanded falls, holding other factors constant.
The statement incorrectly says “demand goes down”, but technically, the demand curve itself doesn’t change; only quantity demanded changes along the curve.
If the workers of a firm successfully negotiate an increase in wages, which of the following is most likely to happen?
a. The demand curve for the product the firm produces shifts rightward.
b. The demand curve for the product the firm produces shifts leftward.
c. The supply curve of the product the firm produces shifts rightward.
d. The supply curve of the product the firm produces shifts leftward.
The supply curve of the product the firm produces shifts leftward
Explanation:
Higher wages increase production costs for the firm.
When production becomes more expensive, the firm supplies less at each price.
This causes the supply curve to shift leftward.
Which of the following will not shift a supply curve?
a. A change in the price of relevant resources
b. A change in the good's own price
c. A change in the number of sellers
d. A change in per-unit costs brought about by a change in taxes
A change in the good's own price
Explanation:
Supply curve shifts occur due to changes in factors other than the good’s own price, such as:
Resource prices
Number of sellers
Taxes, technology, etc.
A change in the good’s own price causes movement along the supply curve, not a shift.
On a supply-and-demand diagram, consider a price for which the horizontal distance to the supply curve is shorter than the horizontal distance to the demand curve. There is a _________ at that price and the current price must be _______ the equilibrium price.
a. shortage; above
b. shortage; below
c. surplus; above
d. surplus; below
shortage; below
Explanation:
Horizontal distance to the curves measures quantity supplied vs. quantity demanded.
If distance to supply < distance to demand, then quantity supplied < quantity demanded → shortage.
Shortage occurs when the current price is below the equilibrium price.
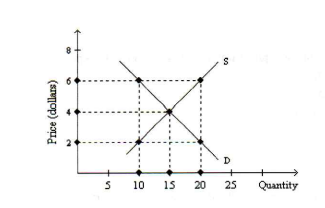
Refer to Figure 3-4. If this is a competitive market, price and quantity will gravitate toward
a. $6 and 10 units, respectively.
b. $6 and 20 units, respectively.
c. $4 and 15 units, respectively.
d. $2 and 15 units, respectively.
$4 and 15 units, respectively
*If the supply of and demand fora product decrease at the same time, then equilibrium
a. quantity and equilibrium price must both decline.
b. quantity must decline, but equilibrium price may either rise, fall, or remain unchanged.
c. price must fall, but equilibrium quantity may either rise, fall, or remain unchanged.
d. quantity must fall and equilibrium price must rise.
quantity must decline, but equilibrium price may either rise, fall, or remain unchanged.
Explanation:
Decrease in demand → lowers both equilibrium price and quantity.
Decrease in supply → raises equilibrium price but lowers quantity.
Effect on quantity: Both shifts reduce quantity → equilibrium quantity must fall.
Effect on price: The effects oppose each other → equilibrium price may rise, fall, or remain unchanged.
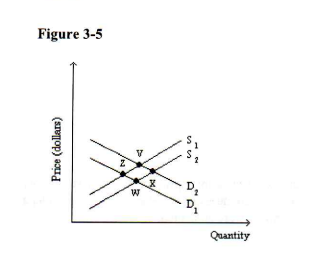
Refer to Figure 3-5. In the market shown, if equilibrium was originally at point Z and the new equilibrium is now at point V, this change may have been caused by
a. a decrease in consumers' income (assuming that this is an inferior good) and a simultaneous decline in technology in the production of this good.
b. an increase in consumers' income (assuming that this is an inferior good) and a simultaneous improvement in technology in the production of this good.
c. a decrease in consumers' income (assuming that this is an inferior good) and no change in supply.
d. an increase in consumers' income (assuming that this is an inferior good) and no change in supply.
a decrease in consumers' income (assuming that this is an inferior good) and no change in supply.
Explanation:
Movement in equilibrium is caused by shifts in demand, supply, or both.
Assume this is an inferior good:
A decrease in consumers’ income → increases demand for an inferior good.
If supply also declines (e.g., due to a decline in technology), this shifts the supply curve leftward, raising price and potentially affecting quantity.
The combination of higher demand and lower supply can produce the movement from Z to V.
Which of the following pairs of goods would be most likely to be complements?
a. Olive oil and vegetable oil
b. Peanuts and peanut butter
c. Airline tickets and rental cars
d. Hiking boots and tennis shoes
Airline tickets and rental cars
If price is on the vertical axis and quantity demanded is on the horizontal axis, why is a demand curve downward sloping (left to right)?
a. Because a demand curve is the graphical representation of the law of demand, which specifies an inverse relationship between price and supply, ceteris paribus.
b. Because a demand curve is the graphical representation of the law of demand, which specifies a direct relationship between price and quantity supplied, ceteris paribus.
c. Because a demand curve is the graphical representation of the law of demand, which specifies an inverse relationship between price and demand, ceteris paribus.
d. Because a demand curve is the graphical representation of the law of demand, which specifies an inverse relationship between price and quantity demanded, ceteris paribus.
Because a demand curve is the graphical representation of the law of demand, which specifies an inverse relationship between price and quantity demanded, ceteris paribus
Explanation:
A demand curve shows the relationship between price (vertical axis) and quantity demanded (horizontal axis).
According to the law of demand, as price rises, quantity demanded falls, and as price falls, quantity demanded rises, ceteris paribus.
This inverse relationship between price and quantity demanded is why the curve slopes downward.
A price ceiling is a government-mandated
a. minimum price below which legal trades cannot be made.
b. maximum price above which legal trades cannot be made.
c. minimum price above which legal trades cannot be made.
d. maximum price below which legal trades cannot be made.
maximum price above which legal trades cannot be made
One of the effects of a price floor (set above equilibrium price) is
a. a surplus.
b. higher-quality goods are produced.
c. more satisfied customers.
d. a shortage
a surplus
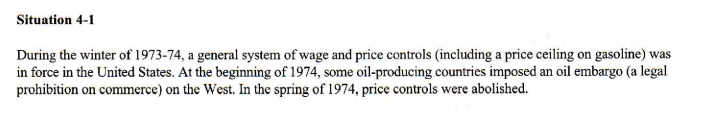
Refer to Situation 4-1. An economist would have most likely predicted that once price controls were abolished in the spring of 1974,
a. the price of gasoline would decline sharply.
b. the surplus of gasoline would go away.
c. the shortage of gasoline would go away.
d. the demand for gasoline would decrease.
the shortage of gasoline would go away
A minimum wage law (that sets the minimum wage above the equilibrium wage) can be expected to
a. clear the market for unskilled workers.
b. increase the number of unskilled workers employed.
c. increase the number of firms in those industries where the law is effective.
d. reduce the number of unskilled workers employed and/or reduce the number of hours worked by unskilled workers.
reduce the number of unskilled workers employed and/or reduce the number of hours worked by unskilled workers.
The space on the freeway is fixed at any instant of time. A supply curve that shows this is
a. perfectly horizontal.
b. upward sloping.
c. downward sloping.
d. perfectly vertical.
perfectly vertical
The demand for seats in 10 a.m. classes at the university is higher than the demand for seats in 8 a.m. classes. The supply of seats is fixed. If the university prices classes at the price required to achieve equilibrium at 10 a.m., there will be
a. a shortage at 8 a.m.
b. a surplus at 8 a.m.
c. equilibrium at 8 a.m.
d. disequilibrium at 8 a.m., but we cannot determine which typе.
a surplus at 8 a.m.
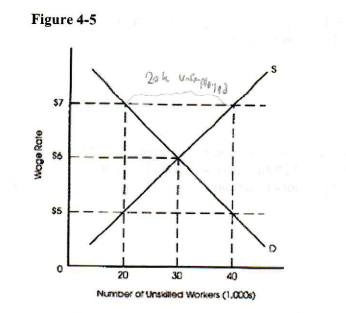
Refer to Figure 4-5. At a wage of $7, there will be a ______ of unskilled workers equal to ______ thousand workers.
a. shortage; 10
b. surplus; 20
c. surplus; 10
d. shortage; 20
surplus; 20
Residents of cities with a reputation for good weather, ceteris paribus,
a. pay a higher price for housing because the demand for housing is higher.
b. pay a higher price for housing because the supply of housing is higher.
c. pay a higher price for housing because the supply and demand for housing is higher.
d. pay the same for housing as they would in cities with a reputation for bad weather.
pay a higher price for housing because the demand for housing is higher
If a college sets its tuition _________ the equilibrium tuition, then it will have to use some form of nonprice-rationing device to determine who will be accepted for admission to the college.
a. above
b. below
c. equal to
d. equal to or above
below
The higher the price of medical care in general, the lower the ________ medical care and the ______specific items that make up medical care (such as, x-rays).
a. quantity demanded of; higher the demand for
b. demand for; higher the demand for
c. quantity demanded of; lower the demand for
d. demand for; higher the quantity demanded of
quantity demanded of; lower the demand for
The price of good B has a pattern such that P = $20 on Monday through Thursday of every week, and P = $25 on Fridays. If speculators begin participating in the market for good B, their actions will likely lead to a(n) ______ in the price of good B on Monday through Thursday and a(n) _______ in the price of good B on Friday.
a. increase; increase
b. increase; decrease
c. decrease; increase
d. decrease; decrease
increase; decrease
Explanation:
Speculators buy low and sell high.
On Monday–Thursday, price is lower ($20) → speculators buy, increasing demand → price rises.
On Friday, price is higher ($25) → speculators sell, increasing supply → price falls.
An American computer is priced at $1,200. If the exchange rate between the U.S. dollar and the Mexican peso is
$0.09 = 1 peso, approximately how many pesos would a Mexican buyer pay for the computer?
a. 13,333 pesos
b. 108 pesos
с. 133.50 pesos
d. 15,075 pesos
13,333 pesos
As the dollar price of the Mexican peso falls, the ________ Mexican goods will be for Americans to purchase and the _______ Mexican goods Americans will buy; thus ______ pesos will be demanded.
a. less expensive; more, more
b. more expensive; fewer, fewer
c. more expensive; more, fewer
d. less expensive; more, fewer
? less expensive; more, more
Explanation:
If the peso falls in value relative to the dollar, Mexican goods become cheaper for Americans.
Cheaper goods → Americans buy more Mexican goods.
To buy more Mexican goods, Americans demand more pesos to complete transactions.
If it takes 118 Japanese yen to buy one dollar, then how many dollars does it take to buy one euro?
a. $0.0085
b. $1.18
c. $0.85
d. There is not enough information to answer the question.
There is not enough information to answer the question
A decrease in U.S. demand for foreign assets would be expected to cause:
a. a decrease in the supply of foreign currency and a decrease in the equilibrium value of foreign currency.
b. a decrease in the demand for foreign currency and a decrease in the equilibrium value of foreign currency.
c. a decrease in the demand for foreign currency and an increase in the equilibrium value of foreign currency
d. a decrease in the supply of foreign currency and an increase in the equilibrium value of foreign currency
a decrease in the demand for foreign currency and a decrease in the equilibrium value of foreign currency.
*1. Suppose that 1983 is the base year for the Consumer Price Index (CPI) and in 2019 the CPI is 254. What does
this "254" mean?
a. What cost $100 in 1983 on average cost 254 times as
much in 2019.
c. What cost $100 in 1983 on average cost 100/254 (or 0.39)
times as much in 2019.
b. What cost $100 in 1983 on average cost
$254 more in 2019.
d. What cost $100 in 1983 on average cost
$154 more in 2019.
What cost $100 in 1983 on average cost
$154 more in 2019.
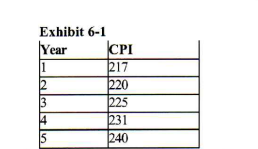
Refer to Exhibit 6-1. Prices rose by _____ percent from Year 1 to Year 2.
a. 1.38 b. 0.14
c. 1.29 d. 1.94
1.38
If the CPI is 100 in the base year and 106 in the current year, how much did prices rise between the base year
and the current year?
a. 6 percent b. 106 percent
c. 1.06 percent d. 0.06 percent
6 percent
The inconvenience associated with reducing money holdings to avoid the inflation tax is called:
a. menu costs b. shoeleather costs
c. variable yardstick costs d. fixed costs
shoeleather costs
The movie "Return of the Jedi" earned $264 million in 1983 when it was released. The CPI in 1983 was 97.8 and the CPI in 2012 was 226.665. Approximately how much did the movie earn in 2012 dollars?
a. $590 million b. $612 million
c. $2.12 million d. $123 million
$612 million
2012 dollars = 264 × (226.665 / 97.8)
226.665 / 97.8 ≈ 2.318
264 × 2.318 ≈ 612
Answer: b. $612 million
The value of the consumer price index (CPI) is always equal to _____ in the base year
a. 7 b. 10
c.100 d. 1,000
100
In a hyperinflation
a. people hold as little money as possible
c. people continue to hold the same
amount of money
b. people hold as much money as possible because financial
assets lose their value rapidly.
d. some people hold more money and some hold less
people hold as little money as possible
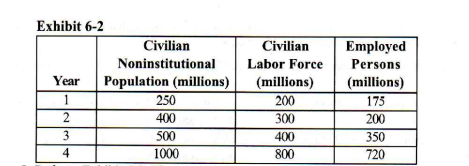
Refer to Exhibit 6-2. The unemployment rate in year 2 is
a. 75 percent. b.33 1/3 percent.
c. 50 percent. d. 66 2/3 percent.
33 1/3 percent

Refer to Exhibit 6-2. The labor force participation rate in year 3 is
a. 12 1/2 percent. b. 70 percent.
c. 80 percent. d. 30 percent.
80 percent
In many large retail stores, price markdowns are now determined by computer. The "middle managers" who used to make these decisions personally became _______ unemployed.
a. frictionally b. structurally
c. naturally d. cyclically
structurally
Jones lost his job in industry A, but he has skills that can be transferred to industry B (which is currently hiring). Smith lost a job in industry C, but his skills cannot be transferred to industry B or to any other industry. Jones is_______ unemployed and Smith is _______unemployed.
a. structurally; frictionally b. structurally; structurally
c. frictionally; frictionally d. frictionally; structurally
frictionally; structurally
Among the ways to be classified as unemployed by the Bureau of Labor Statistics, a person must be not working,
a. have been actively looking for work within the past four weeks, and currently be available for work
b. and currently be available for work, regardless of whether one is actively looking for work or not
c. and be waiting to be called back to work from a permanent layoff
d. and activity looking for work within the past year
have been actively looking for work within the past four weeks, and currently be available for work
The unemployment rate equals the
a. number of employed persons divided by the number of unemployed persons
b. number of unemployed persons divided by the civilian non-institutional population.
c. number of unemployed persons divided by the civilian labor force.
d. sum of unemployed persons and discouraged workers divided by the civilian labor force.
number of unemployed persons divided by the civilian labor force.
Unemployment that arises as a result of the time it takes for unemployed people to locate a job utilizing their transferable skills is called ________ unemployment.
a. structural b. cyclical
c. natural d. frictional
frictional
Persons in the civilian labor force fall into one of two categories:_______ or ________
a. job leaver; job loser
c. employed; unemployed
b. entrant; reentrant
d. discouraged workers; encouraged workers
employed; unemployed
Persons who are retired or engaged in own-home housework are considered to be in which of the following categories?
a. in the civilian labor force
c. employed
b. not in the labor force
d. unemployed
not in the labor force
*Some economists believe that because the government the unemployment rate is biased _____ discouraged workers as unemployed, the unemployment rate is biased _______.
a. counts; upward
b. counts: downward
c. does not count; upward
d. does not count; downward
does not count; downward
The expenditure approach to measuring GDP sums
a. consumption, investment, government purchases, and net exports.
b. sales, revenues, income, and wages.
c. profits, compensation of employees, consumption, and investment.
d. net exports, consumption, wages, and
salaries.
consumption, investment, government purchases, and net exports.
*Real GDP is GDP
a. in current-year prices.
b. in base-year prices.
c. in GDP-prices.
d. in that year's prices.
in base-year prices
Disposable income is
a. equal to GDP minus the capital consumption allowance.
b. that portion of personal income that can be used for consumption and saving.
c. the sum of all payments to suppliers of the factors of production.
d. equal to national income.
that portion of personal income that can be used for consumption and saving.
*To macroeconomists, investment is mainly the purchases of goods and services
a. by businesses.
b. to hold as wealth, such as gold coins or art.
c. to hold as wealth, such as stocks and bonds.
d. by the government.
by businesses
Interest is the return to
a. land b. entrepreneurship
c. labor d. capital
capital
*According to Okun's rule of thumb, if the economy produces at an annual rate of $10 trillion, then an increase in the rate of unemployment from 5.5 percent to 6 percent would be expected to cause income in the economy
to:
a. rise by $200 billion b. fall by $200 billion
c. fall by $100 billion d. rise by $100 billion
fall by $100 billion
Okun’s rule of thumb:
A 1 percentage point increase in unemployment → 2% decrease in GDP.

Unemployment increases from 5.5% to 6.0% = 0.5 percentage point increase
→ GDP decreases by 1%.

GDP = $10 trillion

1% of $10 trillion = $0.1 trillion = $100 billion
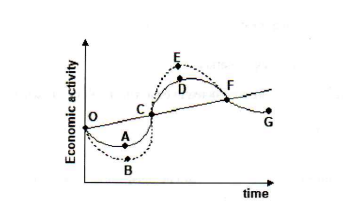
Refer to Figure 1. A movement from D to G represents
a. trough b. peak
c. recession d. expansion
recession

Refer to Figure 1. Which point represents a peak:
a. A b. B
c. C d. D
D
The circular flow diagram shows:
a. the movement of expenditures and factor payments through the economy.
b. how national income is distributed to individuals.
c. how national income changes over time.
d. the movement of goods from one business to another.
the movement of expenditures and factor payments through the economy.
Two ways of measuring Gross Domestic Product are the _______ approach and the _______ approach.
a. expenditure; income
b. expenditure; national product
c. national product; income
d. net national product; personal income
expenditure; income
Net exports equals
a. exports divided by imports
b. the sum of exports and imports
c. exports minus imports
d. exports during the year
exports minus imports
The standard definition of "recession" is
a. a period of a positive frictional unemployment rate.
b. two consecutive quarters of falling Real GDP.
c. the lowest point in a business cycle. approach and the
d. a period of negative inflation.
two consecutive quarters of falling Real GDP
When computing national income, which of the following is not included in compensation of employees?
a. wages and salaries paid to employees
b. employers' contributions to Social Security and employee benefit plans
c. the monetary value of fringe benefits, tips, and paid vacations
d. income earned by self-employed individuals
income earned by self-employed individuals
*** The typical U.S. business cycle, measured peak to peak, lasts approximately
a. 4 to 5 years. b. 8 to 10 years.
c. 1 to 3 years. d. 6 months to 2 years.
4 to 5 years
For a neo Malthusian model, the key is that _________ keeps being added to a fixed amount of ______
a. population; natural resources b. natural resources; land
c. population; land d. capital; natural resources
population; natural resources
Growth usually leads to decreased birth rates because:
a. pollution reduces the fertility of the population.
c. immigration crowds out endogenous population growth
b. men and women are too tired to have kids.
d. the opportunity cost of having children rises.
the opportunity cost of having children rises
According to the Solow (or Neoclassical or Classical) growth model, poorer countries should:
a. grow at the same rate as richer countries b. grow at an ever increasing rate
c. grow faster than richer countries d. grow slower than richer countries
grow faster than richer countries
The Solow or Neoclassical growth theory emphasized how ______ contribute to growth.
a. capital b. technological changes
c. government policies d. factors limiting population growth
capital
_______ occurs when the presence of a less efficient technology blocks the adoption of a more efficient
technology.
a. Network externalities. b. Positive externalities
c. Learning by doing d. Technological lock-in
Technological lock-in
*The range of laws, rules, and regulations that define the allowed forms of use and transfer of resources is called structure of the economy. the
a. monetary b. property rights
c. microeconomic d. macroeconomic
property rights
Neoclassical or Solow growth theory treats technology as an_______variable, and new growth or endogenous growth theory treats technology as an ________
a, exogenous; endogenous variable
b. endogenous; exogenous variable
c. endogenous; endogenous variable, as well
d. exogenous; exogenous variable, as well
exogenous; endogenous variable
The key idea of the Malthusian model of economic growth was:
a. technological development b. diminishing marginal product of labor
c. diminishing marginal product of capital d. diminishing marginal product of land
diminishing marginal product of labor
Which of the following is an example of a network externality?
a. Pollution
b. Your neighbor using deodorant
c. Others owing a telephone making it more useful to other people owing them
d. Others benefiting from technological breakthrough
Others owing a telephone making it more useful to other people owing them
The fact that _________ is the only movie ever made in Esperanto is good evidence that English is a superior language in terms of culture. The reason Prof. Davis gave for thinking that Esperanto/English was not a good example of technological lock-in was ________________.
a. Dungeons and Dragons; that English is easier b. Incubus; that English is easier grammatically
grammatically.
c. Dungeons and Dragons; English has a history allowing greater cultural opportunities
d. Incubus; English has a history allowing greater cultural opportunities
Incubus; English has a history allowing greater cultural opportunities
All of the following were periods of recession or depression except:
a. 1930s b. 1893
c. Late 1990s d. The two months at the start of COVID
Late 1990s
The Nobel Prize in Economics this year was awarded to researchers who studied:
a growth b. the minimum wage
c. econometrics d. recessions and depressions
growth
The interest rate effect is one of the
a. reasons why an AD curve is downward-sloping.
b. shifters of an AD curve.
c. reasons why a short-run aggregate supply curve can be derived
d. shifters of a short-run aggregate supply curve.
reasons why an AD curve is downward-sloping.
Individuals' expectations of lower future prices is a
a. rightward shifter of the AD curve.
b. leftward shifter of the AD curve.
c. reason for moving up along a given AD curve.
d. reason for moving down along a given AD curve.
leftward shifter of the AD curve.
As the interest rate rises, the cost of a given investment project _______ and businesses invest ______
a. rises; more b. rises; less
c. falls; more d. falls; less
rises; less
When the interest rate rises, the cost of financing an investment project increases, making some projects less profitable. As a result, businesses tend to invest less because fewer projects meet the required return. In short, higher interest rates → higher costs → lower investment.
A rise in foreign real national income tends to raise U.S. ______, shifting the U.S. AD curve to the ____.
a. exports; left
b. exports; right
c. imports; left
d. imports; right
exports; right
Changes in which of the following factors shifts the AD curve?
a. net exports
c. supply shocks
b. prices of nonlabor inputs
d. productivity
net exports
Business optimism about future sales tends to_______ investment expenditures, shifting the AD curve to the _______.
a. increase; left b. increase; right
c. decrease; left d. decrease; right
increase; right
A decrease in the money supply may _____ total expenditures and thus _______ aggregate demand.
a. raise; raise b. raise; lower
c. lower; raise d. lower; lower
lower; lower
The short-run aggregate supply curve is
a. downward sloping.
b.upward sloping
c. vertical.
d. horizontal.
upward sloping
An increase in the price of nonlabor inputs
a. shifts the AD curve leftward.
b. shifts the SRAS curve leftward.
c. is the same thing as a beneficial supply shock.
d. shifts the AD curve rightward
shifts the SRAS curve leftward.
An increase in the price of a nonlabor input such as oil will cause
a. a movement down the SRAS curve. b. a movement up the SRAS curve.
c. a leftward shift in the SRAS curve. d. a rightward shift in the SRAS curve.
a leftward shift in the SRAS curve
An increase in labor productivity shifts the
a. AD curve rightward. b. AD curve leftward.
c. SRAS curve leftward. d. SRAS curve rightward.
SRAS curve rightward.
A simultaneous rise in aggregate demand and fall in short-run aggregate supply will definitely
a. a raise the price level, but there is not enough information to know how Real GDP will change.
b. lower Real GDP, but there is not enough information to know how the price level will change.
c. raise the price level and Real GDP.
d. raise Real GDP, but there is not enough information to know how the price level will change.
a raise the price level, but there is not enough information to know how Real GDP will change