ECON TEST
1/67
There's no tags or description
Looks like no tags are added yet.
Name | Mastery | Learn | Test | Matching | Spaced |
|---|
No study sessions yet.
68 Terms
Aggregate Labour Force diagram
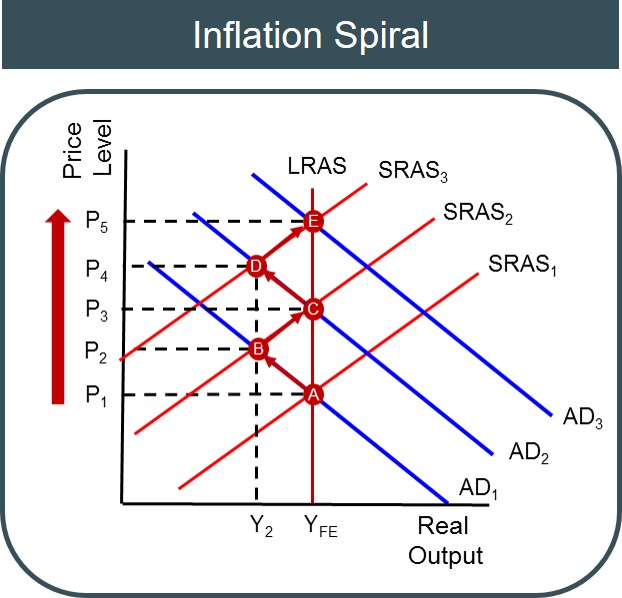
a continuous rise in prices that is sustained by the tendency of wage increases and cost increases to react on each other
Inflationary spiral (and Diagram)
a downward economic cycle characterized by declining price levels and lower production and occurs during periods of recession or depression.
Deflationary spiral (and Diagram)
A demand-side policy using changes in government spending and/or direct taxation to influence aggregate demand and thus growth, employment and prices.
Fiscal policy
A demand-side policy using changes in the money supply or interest rates to achieve economic objectives relating to output, employment, and inflation.
Monetary policy
A GDP trough is the lowest point of real GDP during a business cycle
Trough
A goal of macroeconomic policy that aims at fully utilizing the scarce factor of production labour. Full employment exists when the economy is producing at its potential level of real output and thus there is only natural unemployment (the AD-AS model considers the AD and AS curves together).
Full employment
A kind of long-term unemployment that arises from a number of factors including: technological change; changes in the patterns of demand for different labour skills; changes in the geographical location of industries; labour market rigidities.
Structural UnE
A measure of the overall level of prices in an economy
GDP deflator
A period of rapid economic growth where Gross Domestic Product (GDP) expands much faster than its estimated trend rate, leading to a positive output gap
Boom
A phase of the economic cycle where a country's real GDP grows for two or more consecutive quarters, leading to increased employment, consumer spending, and overall economic activity
Expansion
A set of policies that aim to increase an economy's productive capacity that relies on a greater role for the government; these include expenditures on infrastructure, education, health care, research and development, and all industrial policies.
Interventionist SS policies
A simplified illustration that shows the flows of income and expenditures in an economy.
Circular flow diagram & Components
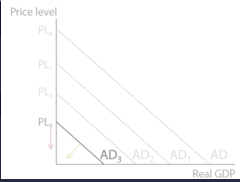
A sustained decrease in the average price level of a country.
Deflation
A sustained increase in the average level of prices.
Inflation
Adjusted to inflation
Real
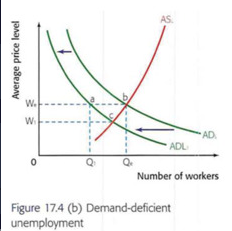
Arises when the equilibrium level of real output is less than potential output as a result of a decrease in AD.
deflationary Gap - Diagram
The portion of disposable income left after paying for essential living expenses, available for spending on non-essential goods, services, or saving.
Discretionary income
The amount of income households have left after paying taxes, available for spending and saving.
Disposable income
Economic Growth - Low Unemployment - Price Stability - Balance of Payments Stability - Redistribution of Income / Equity - Environmental Sustainability
4-6 macro objectives
Income not spent on domestic goods and services. It includes savings, taxes, and import expenditure.
Leakages/ withdrawals
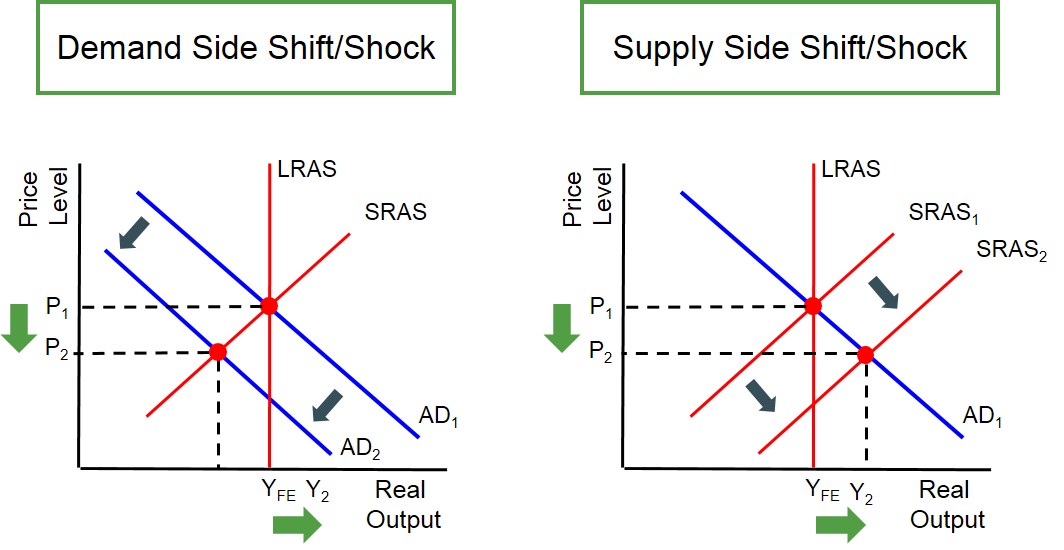
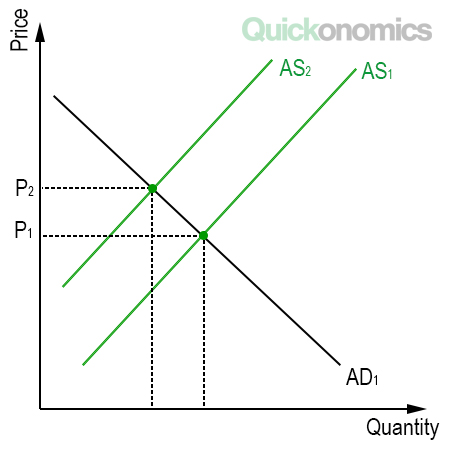
A result of increased production costs (typically because of rising money wages or rising commodity prices) and illustrated by a leftward shift of the SRAS curve.
Cost-push inflations (and Diagram)
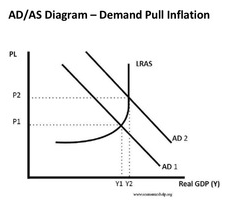
Caused by increases in aggregate demand.
Demand-Pull inflation (and Diagram)
Institutionally built-in features (like unemployment benefits and progressive income taxation) that tend to decrease the short-term fluctuations of the business cycle without the need for governments to intervene.
Automatic Stabilisers
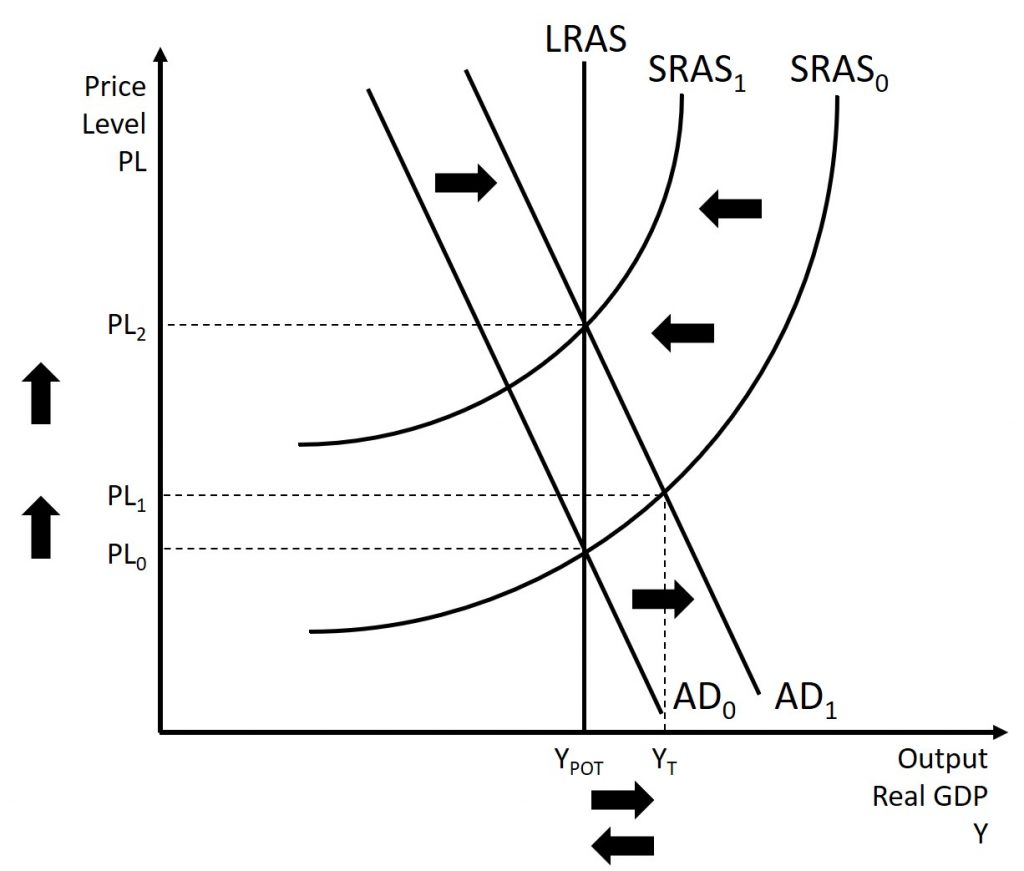
LRAS is horizontal → upward sloping → vertical. Wages & prices sticky downwards → unemployment can persist. Demand-side policies can boost output & reduce unemployment in recession. Output can increase without inflation until full capacity is reached.
LRAS is vertical at full employment (output fixed in long run). Wages & prices are flexible → economy self-corrects. Demand-side policies only affect price level (cause inflation). Output determined by supply-side factors.
Not adjusted to inflation
Nominal
Occurs when real GDP falls for at least two consecutive quarters.
Recession
Planned spending on domestic goods and services at different average price levels, per period of time. Consists of consumption, investment and government expenditures plus net exports.
AD (and components)
How efficiently inputs (like labor or capital) are used to produce output, often expressed as output per worker or output per hour worked.
Productivity
Refers to increases in real GDP over time.
Growth
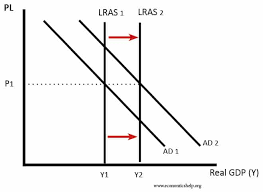
Refers to an increase in the economy's productive capacity and potential output, achieved by improving efficiency, technology, skills, and the availability of resources.
SS growth (and Diagram)
Government measures aimed at increasing the productive capacity of the economy by improving efficiency, labor productivity, and incentives to work, save, and invest. They can be market-based (e.g., tax cuts, deregulation) or interventionist (e.g., education, infrastructure investment).
Supply side policies
A rate of inflation that a central bank aims to achieve and maintain, usually to ensure price stability, guide expectations, and support sustainable economic growth.
Target inflation
Taxation where the fraction of tax paid decreases as income increases. The average tax rate decreases. All indirect taxes are regressive.
Regressive tax
Taxation where the fraction of tax paid increases as income increases. The average tax rate increases.
Progressive tax
Technological, Geographical, Skills-Based,
3 Types of st. Une
Is the total tax paid divided by total income, showing the proportion of income that goes to taxes on average.
HL: Average rate of Tax
The average, sustainable rate at which an economy can increase its real GDP without causing major problems like inflation or trade issues, reflecting growth in its overall productive capacity
Trend rate of Growth
The business cycle stage following a recession that is characterized by a sustained period of improving business activity
Recovery
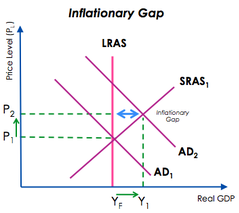
The case where equilibrium real output exceeds potential output as a result of an increase in AD.
Inflationary Gap - Diagram(s)
The cost of borrowing money or the reward for saving money over a period of time expressed as a percentage.
Interest (rates)
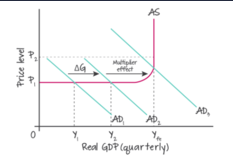
The idea that an increase (or, more generally, a change) in any injection will lead to a greater increase (change) in real GDP or national income because an increase in spending generates additional income that leads to further spending, and thus more income. Its size depends on the size of the withdrawals from the circular flow, as these reflect income not spent on domestic output.
Multiplier effect diagram
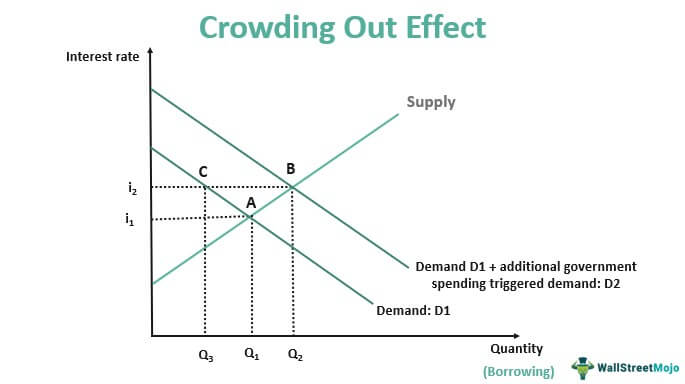
The idea that expansionary fiscal policy is not very effective in increasing aggregate demand because the increased borrowing needs of the government to finance the increased expenditures could lead to increased interest rates. Thus, reducing private sector investment, consumer spending, and other components of AD.
Financial Crowding-out & Diagram
The income earned by all national factors of production independently of where they are located over a period of time; it is equal to GDP plus factor income earned abroad minus factor income paid abroad.
GNP(GNI)
Made up of the employed and the unemployed.
Labour force
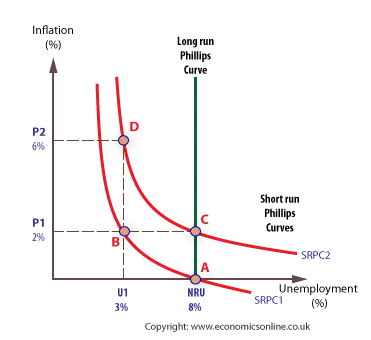
The LRAS is vertical at the natural rate of unemployment (NAIRU). In the long run, there is no trade-off between inflation and unemployment because wages and expectations adjust. Attempts to keep unemployment below the natural rate only lead to accelerating inflation, while unemployment always returns to its natural level.
HL LR Phillips Curve (and Diagram)

Is the percentage of tax paid on an additional unit of income, showing how much tax increases as income rises.
HL: Marginal rate of Tax
The rate of unemployment that occurs when the economy is producing at its potential output or full employment level of output. It is equal to the sum of structural, frictional, and seasonalunemployment.
Natural Rate Unemployment
The short-term fluctuations of real GDP around its long-term trend (or potential output).
Business cycle & Diagram
The SRAS shows an inverse relationship between inflation and unemployment in the short run. When unemployment falls, inflation tends to rise; when unemployment rises, inflation tends to fall. This trade-off occurs because higher demand reduces unemployment but creates upward pressure on wages and prices.
HL SR Phillips curve (and Diagram)
The sum of all past budget deficits minus any budget surpluses; the total amount the government owes to domestic and foreign creditors.
Debt
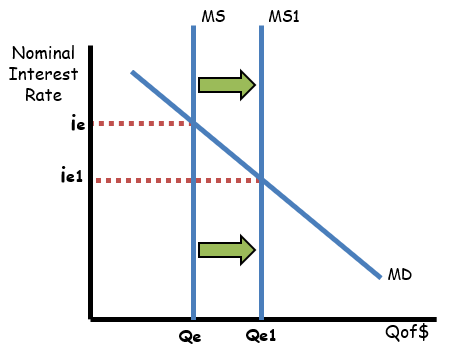
The total amount of money available at a particular time, consisting of currency plus checking accounts.
Money Supply/ demand diagram for setting IRs
The value of all final goods and services produced within an economy over a period of time, usually a year or a quarter.
GDP
These are government measures that rely on free-market incentives to increase efficiency and productivity, such as reducing taxes, deregulation, privatization, and reducing trade union power.
Market based SS policies
Delays between an economic problem arising, policymakers responding, and the policy's effects being felt. They occur in three stages: recognition lag (time to realize the problem exists), implementation lag (time to pass and apply policies), and impact lag (time before the policy actually affects the economy).
Time lags
Unemployment of individuals who are in-between jobs, as people quit to find a better job or to move to a different location.
Frictional UnE
Unemployment that arises when people are out of work because their usual job is out of season; for example, agricultural workers during winter months.
Seasonal UnE
Unemployment that is a result of a decrease in aggregate demand and thus of economic activity; it occurs in a recession.
Cyclical/demand deficient UnE
Wages and prices are slow to fall even when demand decreases or unemployment rises.
'Sticky downwards'
When a person (who is above a specified age and is available to work) is actively looking for work, but is without a job.
Unemployment
When government expenditures exceed government (tax) revenues usually over a period of a year.
Deficit
When interest rates rise, asset values (like bonds, stocks, housing) tend to fall, reducing household wealth and spending. When interest rates fall, asset values usually rise, increasing wealth and boosting consumption.
Wealth effects (from IR change)
When interest rates rise, bond prices fall and existing bondholders lose wealth, discouraging spending. When interest rates fall, bond prices rise, increasing bondholder wealth and encouraging spending.
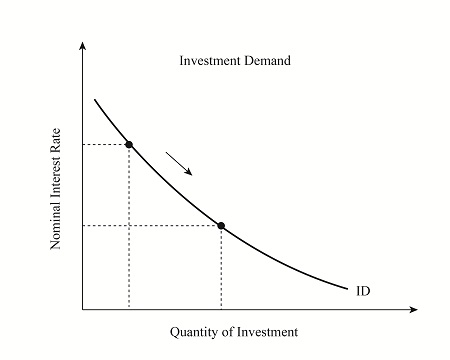
Price effects (from IR change) & Investment D diagram
When interest rates rise, savers earn more income from their savings, encouraging spending, while borrowers face higher costs and reduce consumption. When interest rates fall, savers earn less income and cut spending, while borrowers benefit from lower costs and spend more.
Income effects (from IR change)
When interest rates rise, saving becomes more rewarding, so consumers substitute away from current spending towards saving, while investment falls because borrowing is more expensive. When interest rates fall, saving is less attractive, so consumers substitute towards current spending, and investment increases as borrowing becomes cheaper.
Substitution effects (from IR change)
When the government revenue exceeds the expenditures for that year
Surplus
When the average price level continues to rise but at a slower rate so that the rate of inflation is positive but lower.
Disinflation