Unit 1 Reading Section C
1/11
There's no tags or description
Looks like no tags are added yet.
Name | Mastery | Learn | Test | Matching | Spaced | Call with Kai |
|---|
No analytics yet
Send a link to your students to track their progress
12 Terms
What do graphs and charts allow you to do?
Visualize relationships and perform complex calculations quickly.
What is a nomogram and give an example?
A type of graph chart used to solve complex problems with multiple variables. Example: American Wire Gauge chart.
What performance charts should you know how to interpret?
Brake horsepower charts and fuel consumption charts.
Define bar graph.
A graph used to show relationships between different values. Each value in a bar graph is represented by a bar of an appropriate length.
Define broken-line graph.
A graph that represents the way in which values change. The horizontal axis of the graph represents one value, and the vertical axis represents another value. Straight lines are used to connect points that show true values at each plotted point.
Define pictograph.
A graph that uses symbols or pictures to represent numbers.
Define pie chart.
A graph drawn in the shape of a circle and divided into pieces like a pie to convey data or proportions.

Determine the minimum wire size of a single cable in a bundle carrying a continuous current of 20 ampers, 10 feet from the bus to the equipment in a 28-volt system with an allowable 1-volt drop.
No. 12 wire
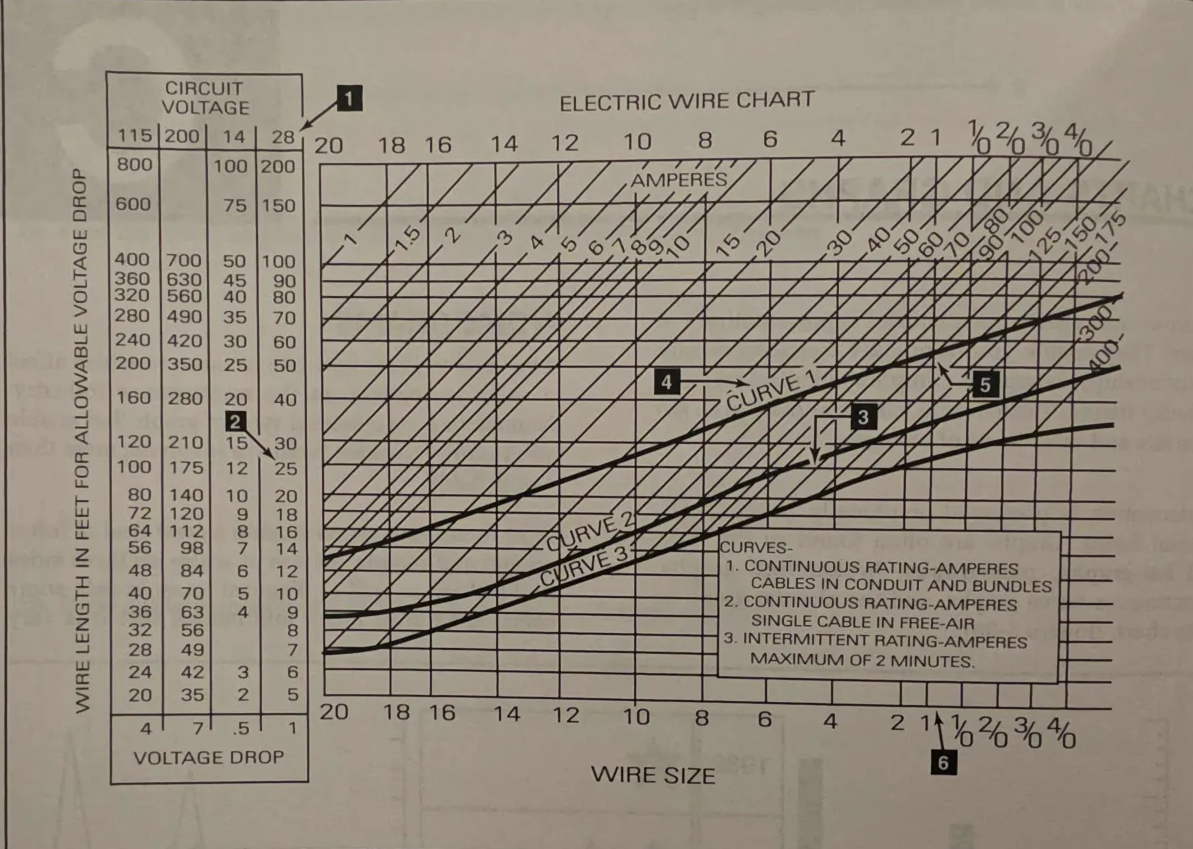
A 28-volt installation has a requirement for a unit drawing 20 amps located 10 feet from the bus bar. The unit requires no more than one volt drop and the wire must be in a bundle. What is the smallest AWG size you can use?
12 AWG

Using the information in question 2, what is the maximum distance the unit could be located away from the bus bar without changing wire size?
26 feet
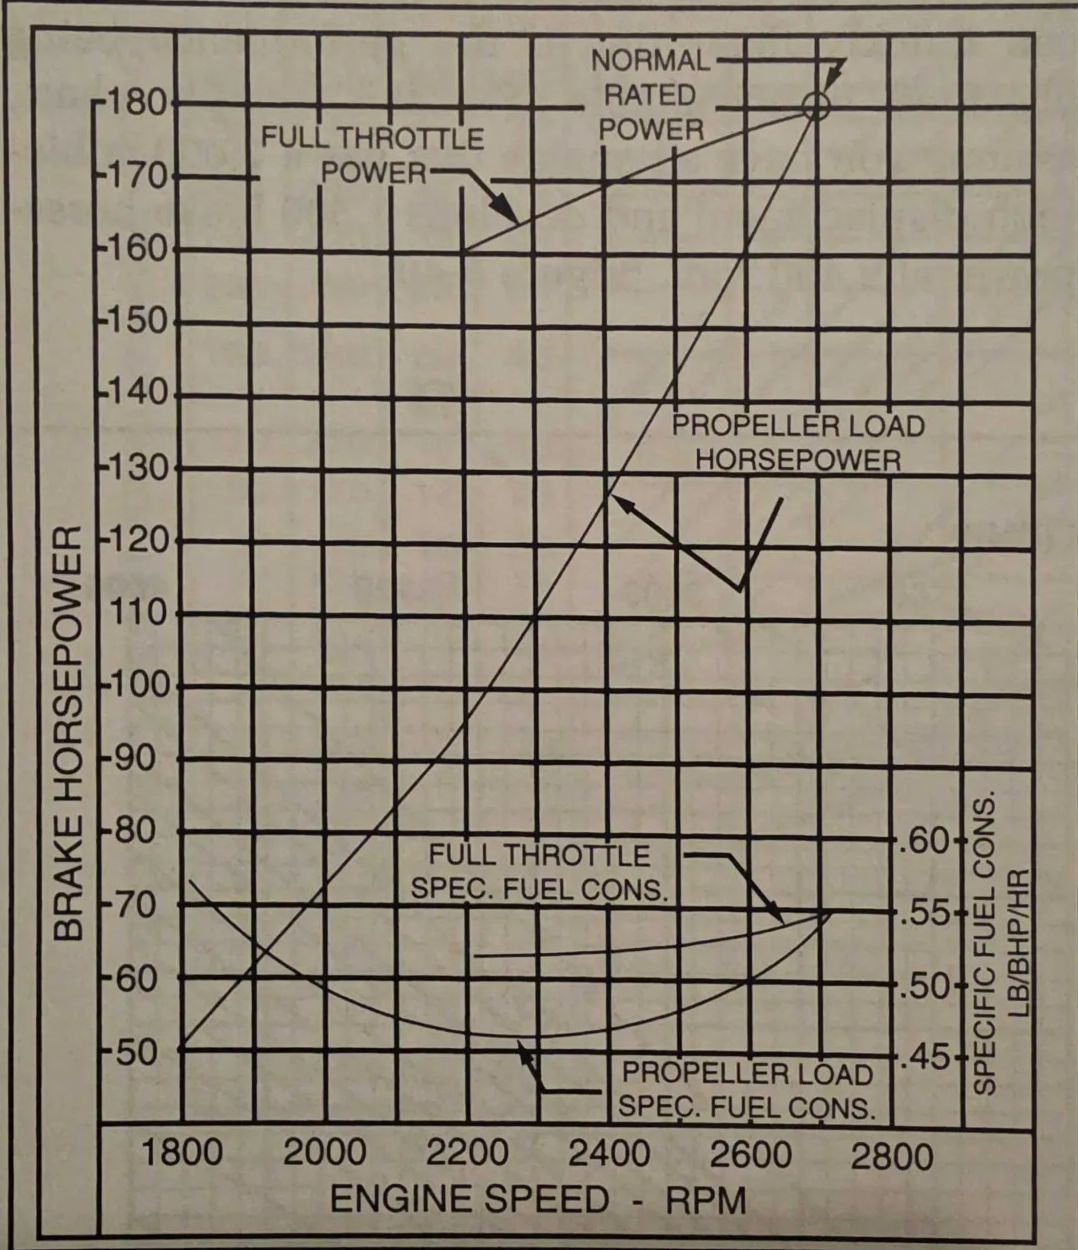
An engine cruising at 2250 rpm will develop ______ horsepower and burn __________ lbs of fuel per horsepower per hour. Use the chart in Figure 5-41.
103, .46

Question Above RPM: 2250
With a 10% increase in horsepower, the engine in the question above will operate at __________ rpm and burn __________ lbs of fuel per hour.
2,340, 52