STATISTICS FLASH CARDS
1/29
There's no tags or description
Looks like no tags are added yet.
Name | Mastery | Learn | Test | Matching | Spaced |
|---|
No study sessions yet.
30 Terms
STATISTIC
A branch of mathematics which involves collecting organizing summarizing and analyzing data, it also involves drawing conclusions, making predictions from sample data and inferring sample results to the population
DESCRIPTIVE STATISTICS
A branch of statistics that includes collecting organizing and summarizing data
INFERENTIAL STATISTICS
A branch of statistics that includes analyzing data. It also involves drawing conclusions and/or making predictions from sample data to the population using probability.
RESEARCH QUESTION
A clearly defined question researches would like to answer
POPULATION
all subjects of interest (students, grades, fruits, ect)
SAMPLE
A subset of the population (EX: the population is using 2000 test subjects. A sample would use 10.)(A sample can be any amount but it’s not the same amount as the population)
RANDOM
each subject has an equal chance of being selected
REPRESENTATIVE
each subject is representative of the population
SIMPLE RANDOM SAMPLE
A sample in which each subject of the population has an equal chance of being selected
STRATIFIED SAMPLE
A sample in which subjects of the population are first divided into strata, then subjects are randomly selected from each Stratum
CLUSTER SAMPLE
A sample in which clusters of subjects are randomly selected from the population
SYSTEMATIC SAMPLE
A sample in which every xth subject of the population is randomly selected
CONVINCE SAMPLING
A sample in which the subjects of the population are selected conveniently
NONRESPONSE BIAS
bias that occurs when subjects do not respond to the questionnaire (survey)or cannot be contacted
RESPONSE BIAS
bias that occurs when a question is poorly worded, or when an interview can influence the subjects’ response
UNDERCOVERAGE BUAS
bias that occurs when representative subjects are not included in the sample selection process
VARIABLE OF INTEREST
A characteristic of the population
QUALITATIVE DATA
Data that can be categorized
QUANTITIVE DATA
Data that can be quantified
DISCRETE
quantitative values that are accountable
CONTINUOUS
quantity values that are measurable
BLIND
A technique where the subjects do not know whether they receive the treatment or placebo
DOUBLE BLIND
A technique were needed the subjects, nor the experimener(s) know which subjects received the treatment or placebo
FREQUENCY DISTRIBUTION
A table listing the possibilities of the variable of interest obtained from the sample along with their corresponding frequencies.
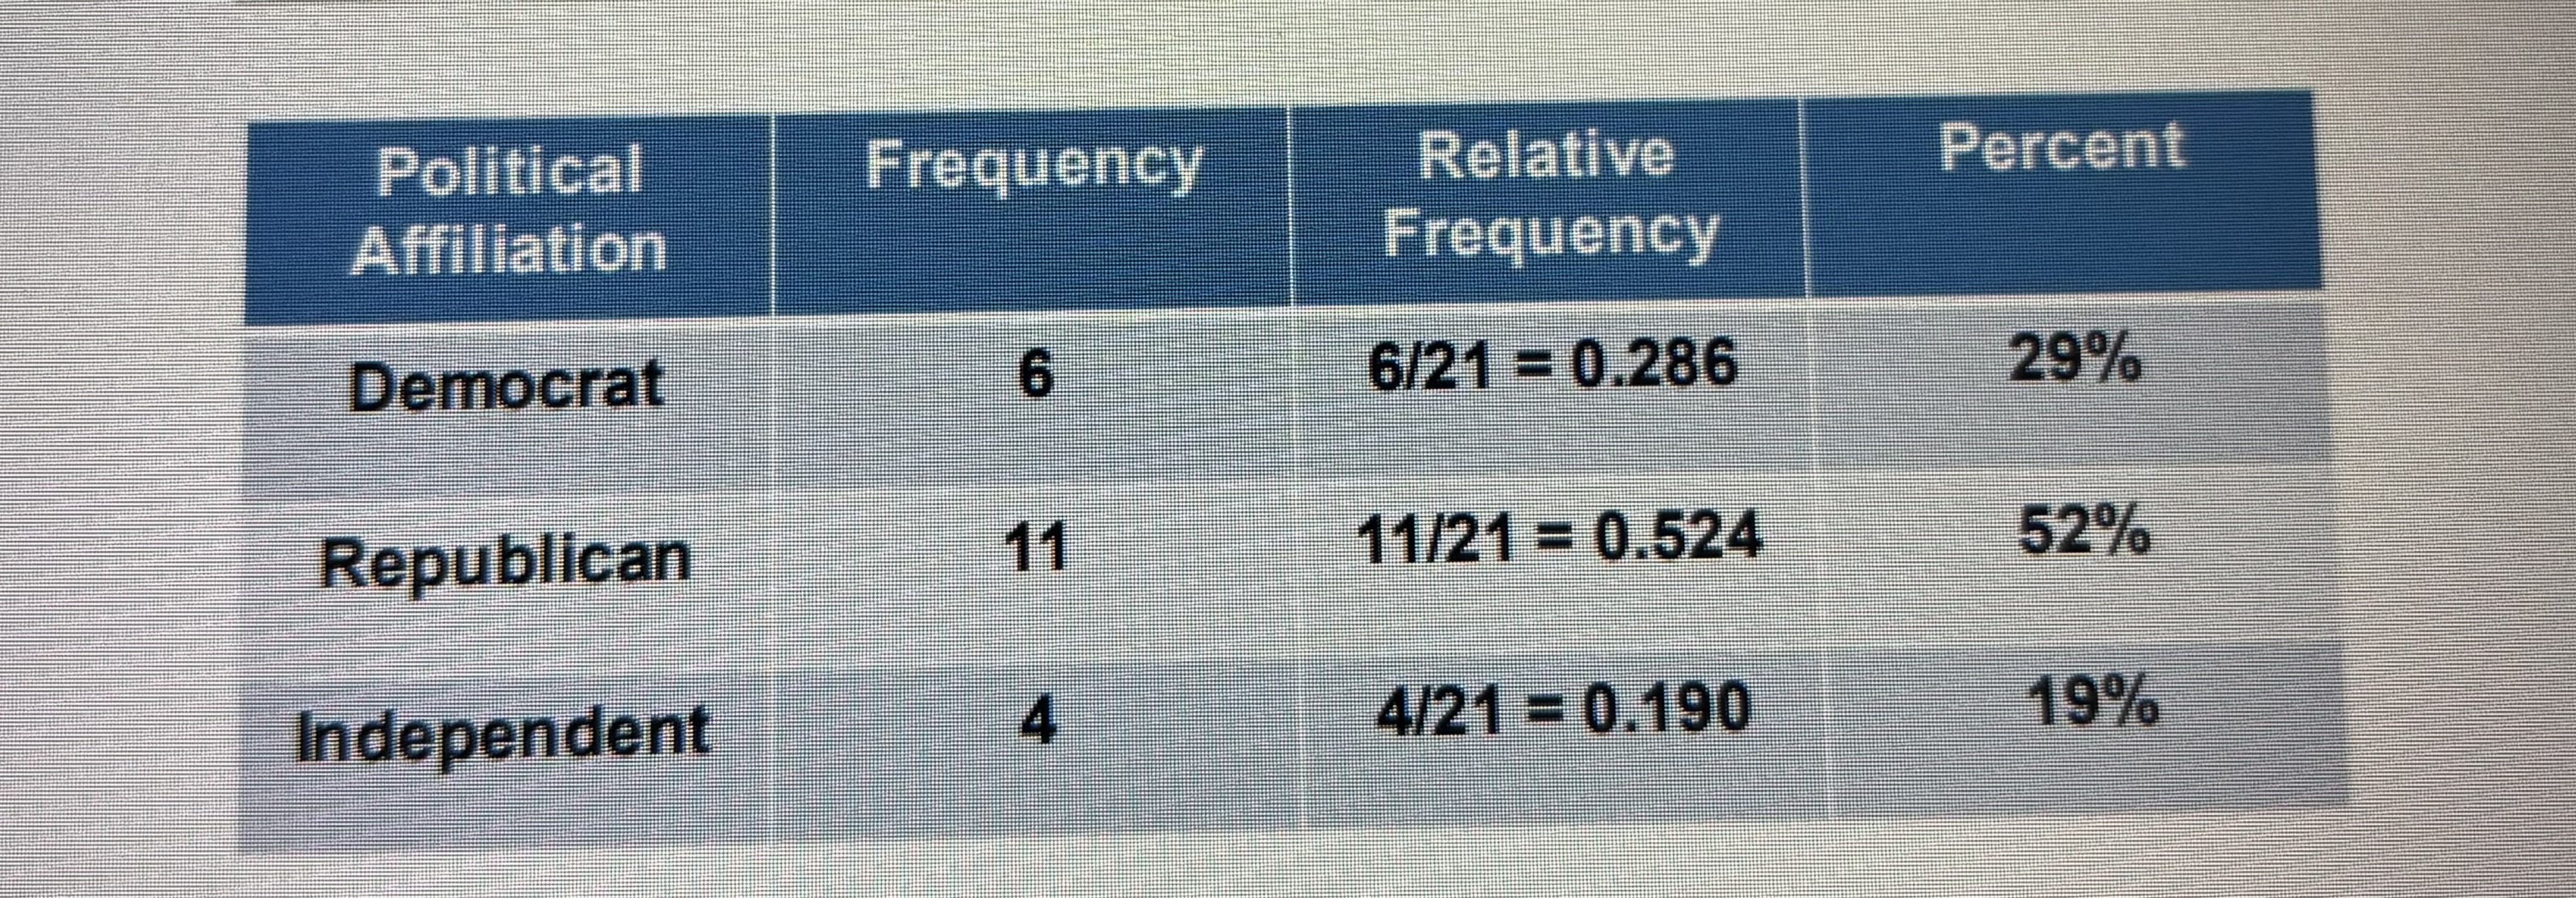
RELATIVE FREQUENCY
The frequency of each category divided by the same size (n)
RELATIVE FREQUENCY= frequency/sample size
PARAMETER
A numerical summary gathered from a population
STATISTIC
any miracle summary gathered from a sample
MEAN
A value that is calculated by summoning the values of the observations and dividing by the total number of observations
MEDIAN
A value that lies in the middle of the data. it divides the data set into two equal parts
MODE
The most frequently occurring observation