DSS Lection 5 Modeling and Analysis
 Call Kai
 Learn
Learn Practice Test
 Spaced Repetition
 Match
Match Flashcards
 Knowt Play
1/23

Earn XP
Description and Tags
This set of flashcards covers the fundamental concepts of computerized decision support, including model types (static, dynamic, deterministic, probabilistic), specific structures like decision tables and trees, and analysis techniques for Decision Support Systems.
Name | Mastery | Learn | Test | Matching | Spaced | Call with Kai | Chat |
|---|
No analytics yet
Send a link to your students to track their progress
24 Terms
Models in Decision Support Systems (DSS)
The foundation of a DSS that helps decision-makers understand situations, predict outcomes, and choose the best alternatives by simplifying complex problems and supporting what-if analysis.
Algorithm-based models
Models that represent a set of instructions used to perform specific tasks such as sorting numbers, performing calculations, or searching for information.
Statistic-based models
Mathematical models that embody statistical assumptions concerning sample data generation, helping to make predictions and understand patterns in data-generating processes.
Linear programming model
A mathematical optimization technique used to achieve the best outcome, such as profit maximization or cost minimization, under a set of linear constraints like resources, machinery, or labor.
Graphical model
A probabilistic model where a graph expresses the conditional dependence structure between random variables.
Quantitative models
are mathematical frameworks employed to analyze and predict outcomes by representing real-world situations through numerical variables and their relationships
Qualitative models
represent the physical and logic relationships among the elements of the system describing the reality, such as, conceptual or semantic models
Simulation model
• is a digital prototype of a physical model to predict its performance in the real world
• helps understand early on whether components and systems, including their control units, will meet their specifications
Static Models
Models representing a single photograph of a situation at a single interval of time, usually repeatable and representing a steady state.
• Optimal operating parameters
• Unvarying
• Primary tool for process design
Dynamic Models
Time-dependent models that represent changing situations and varying conditions by generating and using trends. Occurrence may not repeat.
Heuristics
A modeling category used to find a good enough solution using rules, often representative of expert systems or heuristic programming.
Impact Evaluation Model (IEM)
A framework used to measure whether a program, policy, or project actually caused a change in outcomes by comparing what happened vs what would have happened without the intervention.
Inputs
Resources and activities such as cost, efficiency, overhead, unit costs, staffing ratio, and participation.
Outputs
Efficiency, staff moral, waiting time, accident rate, customer satisfaction, service quality
Intermediate outcomes
Staff moral, cost/benefit, client result
Final Outcomes
Community outcome, impact, value-added, social return on investment, well-being, “so what”, social capital.
Modeling with spreadsheets
The use of software like Microsoft Excel to build mathematical or operational models using formulas, tables, and what-if analysis.
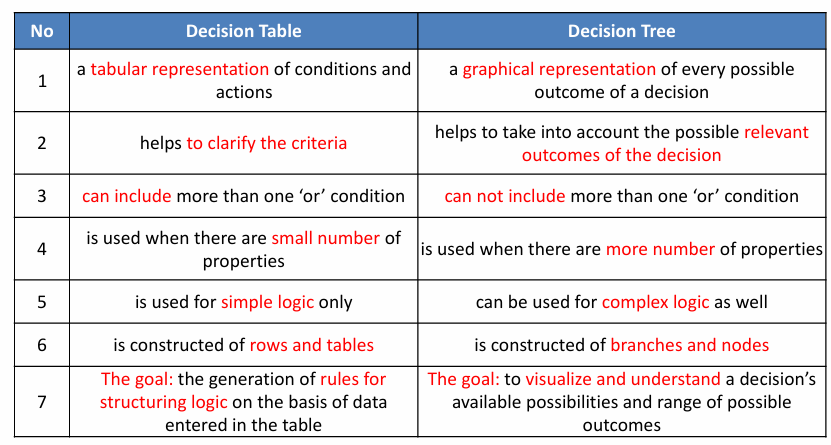
Modeling with Decision table
A decision table is created by listing all the relevant conditions (variables or inputs) and all the relevant actions on the left side of the table.
• Every possible combination of values of the variables is listed in a separate column.
• Each column is typically called a rule.
• A rule describes the action, or actions, that should be carried out for a specific combination of values of the variables.
A decision table always used whenever the processing logic is very complicated and involves multiple conditions.
§ Multiple criteria decision analysis
§ Features include:
– Decision variables (alternatives)
– Uncontrollable variables
– Result variables
§ Applies principles of certainty, uncertainty, and risk
Modeling with Decision table - Benefits and Drawbacks
Benefits:
1.Visualization of cause and effect relationships in the table.
2.Easy to understand.
3.A complex table can be readily broken down into simpler tables.
4.Tables are formatted consistently.
5.Suggestions of possible actions need to be taken from the summarized outcomes of a situation.
6.Semi-standardized languages might be used.
7.Table users are not necessarily known how to use a computer.
Drawbacks:
1. Decision tables are not well suited to large-scale applications. There is a requirement of splitting huge tables into smaller ones to eliminate redundancy.
2. The complete sequence of actions is not reflected in the decision tables.
3. A partial solution is presented
Modeling with Decision tree
A graphical representation of relationships using a branching method to demonstrate all possible outcomes of a decision.
§ Multiple criteria approach
§ Demonstrates complex relationships
§ Cumbersome, if many alternatives
Nodes of a Decision Tree
Decision Nodes, Chance Nodes, and Terminal Nodes.
Modeling with decision tree - Benefits and Drawbacks
Benefits:
1. A decision tree is simple to comprehend and use.
2. New scenarios are simple to add.
3. Can be combined with other decision-making methods.
4. Handling of both numerical and categorial variables.
5. The classification does not require many computations.
6. Useful in analyzing and solving various business problems.
Drawbacks:
1. They are inherently unstable, which means that a slight change in the data can have a result in a change in the structure of the optimal decision tree, and they are frequently wrong.
2.These are less suitable for estimation tasks where the outcome required is the value of a continuous variable.
3.The alternative options perform better with the same data. A random forest of decision trees can be used as a replacement but it is not as straightforward to comprehend as a single decision tree.
4.Calculations can become quite complicated, especially when several values are uncertain and/or multiple outcomes are related.
Difference between decision table and decision tree
Deterministic models
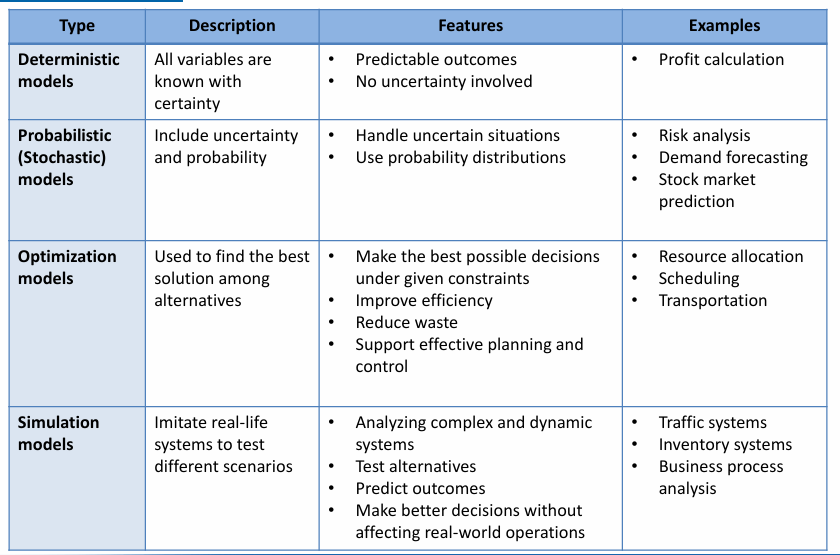
Models where all variables are known with certainty, resulting in predictable outcomes such as profit calculation.
Probabilistic (Stochastic) models
Models that include uncertainty and probability distributions to handle risk analysis and demand forecasting.
Sensitivity Analysis
What-if Analysis
Goal seeking Analysis
Sensitivity
• Assesses impact of change in inputs or parameters on solutions
• Allows for adaptability and flexibility
• Eliminates or reduces variables
• Can be automatic or trial and error
What-if
Assesses solutions based on changes in variables or assumptions
Goal seeking
• Backwards approach, starts with goal
• Determines values of inputs needed to achieve goal
• Example is break-even point determination
Mathematical models
Mathematical models are the most widely used because they provide precise and analytical solutions to business problems.
These models use mathematical relationships, formulas, and equations to solve problems.
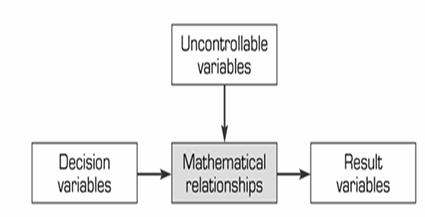
They link decision variables, uncontrollable variables, parameters, and result variables together:
– Decision variables describe alternative choices.
– Uncontrollable variables are outside decision-maker’s control.
– Fixed factors are parameters.
– Intermediate outcomes produce intermediate result variables.
– Result variables are dependent on chosen solution and uncontrollable variables.
Classification of mathematical models
Simulations
Simulation methodology
§ Imitation of reality
§ Allows for experimentation and time compression
§ Descriptive, not normative
§ Can include complexities, but requires special skills
§ Handles unstructured problems
§ Optimal solution not guaranteed
§ Probabilistic independent variables
– Discrete or continuous distributions
§ Time-dependent or time-independent
§ Visual interactive modeling
– Graphical
– Decision-makers interact with simulated model
– may be used with artificial intelligence
§ Can be objected oriented
7 steps of the simulation methodology
Problem definition
Construction of model
Testing and validation
Design of experiment
Experimentation
Evaluation
Implementation