STAT 2600 Midterm 3
1/57
Earn XP
Description and Tags
Name | Mastery | Learn | Test | Matching | Spaced | Call with Kai |
|---|
No analytics yet
Send a link to your students to track their progress
58 Terms
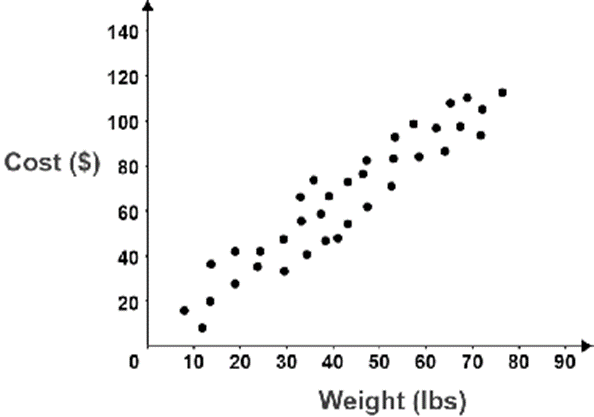
Suppose you gather a random sample of package shipping costs from a variety of stores in the local area. There appears to be a strong, positive, linear association between the weight of the package and the cost to ship it. A 95% confidence interval for the slope parameter of the best-fit line is (1.1, 1.9). What is the appropriate interpretation of this interval?
There is a 95% probability that the true slope parameter is between 1.1 and 1.9 pounds per dollar.
For every 1 pound increase in weight, we are 95% confident that the average cost increases by between $1.10 and $1.90.
There is a 95% probability that the true slope parameter is between 1.1 and 1.9 dollars per pound.
For every 1 dollar increase in cost, we are 95% confident that the average weight increases by between 1.10 and 1.90 pounds
For every 1 pound increase in weight, we are 95% confident that the average cost increases by between $1.10 and $1.90.
Suppose we determine the best fit line for a scatter plot is y = 10.58 - 0.02x . Further inferential analysis of the slope parameter reveals a 95% confidence interval between -0.045 and 0.005. What does this confidence interval indicate about the linear association between the variables x and y?
There is definitely a positive association between the two variables.
It is plausible there is no association between the variables.
There is definitely a negative association between the two variables.
It is plausible there is no association between the variables.
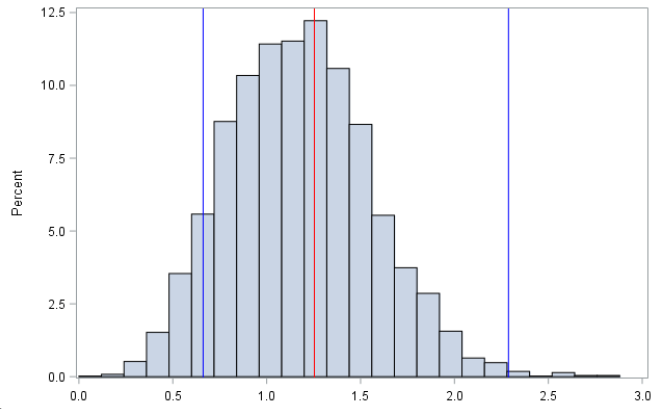
Imagine we construct a bootstrap resampling distribution for the slope parameter of a simple linear regression model and obtain the histogram below. The red line indicates the point estimate for the slope and the blue lines define the bounds of a 95% confidence interval. Does this distribution indicate an association between the variables in the model?
Yes, because 0 is not in the interval.
No, because 0 is not in the interval.
No, because 1 is in the interval.
Yes, because 1 is in the interval.
Yes, because 0 is not in the interval.
In a criminal trial by jury, the burden of proof required of the prosecution is beyond a reasonable doubt. However, the burden of proof required of a police officer to detain and question a suspected criminal is only a reasonable suspicion. In the context of inferential statistics, the burden of proof is known as the _________.
p-value
level of significance
null hypothesis
test statistic
level of significance
In a criminal trial by jury, the prosecution must provide evidence of the defendant's guilt (alternate hypothesis). In the context of inferential statistics, the evidence in favor of the alternate hypothesis is called the _________.
confidence
level of significance
null distribution
test statistic
test statistic
A null distribution depicts the expected range and frequency of values for a ________ assuming the _________ hypothesis is true.
statistic, alternate
parameter, alternate
statistic, null
parameter, null
statistic, null
The first three steps of a hypothesis test are:
1. Formulate the hypotheses
2. Choose a significance level
3. Calculate a test statistic
What is the next step?
Select a confidence level
Determine the null distribution
Compute a p-value
Choose the best hypothesis
Determine the null distribution
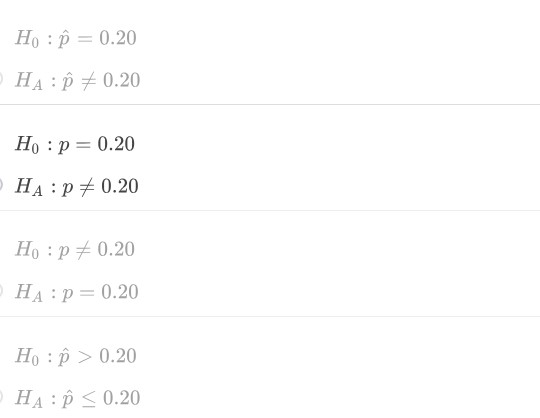
Suppose the M&M candy company's website states that 20% of the pieces in each bag are blue. You do not believe this is the correct proportion and buy a bunch of bags of M&Ms to test your suspicion. What are the appropriate hypotheses for your test?
Ho: p=0.2
HA: P=/= 0.2
Imagine we conduct a hypothesis test on the true proportion of restaurants in New York City that fail health code inspections. Our null hypothesis is that the true proportion is equal to 0.50, while the alternate hypothesis is that the true proportion is greater than 0.50. After completing the test on a random sample of restaurants, we obtain a test statistic of 0.52 and a p-value of 0.17. What is the appropriate interpretation of this p-value?
There is a 17% chance we would observe a sample proportion of 0.52 (or greater) if the true proportion is 0.50.
There is a 52% chance we would observe a sample proportion of 0.17 (or greater) if the true proportion is 0.50.
There is a 50% chance we would observe a sample proportion of 0.52 (or less) if the true proportion is 0.17.
There is a 52% chance we would observe a sample proportion of 0.50 (or less) if the true proportion is 0.17.
There is a 17% chance we would observe a sample proportion of 0.52 (or greater) if the true proportion is 0.50.
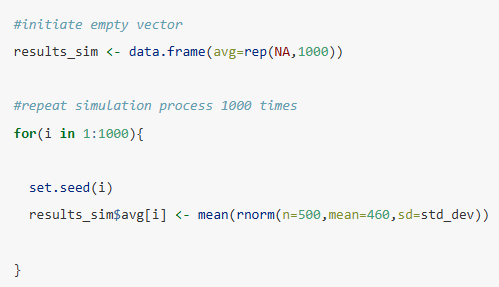
As part of a hypothesis test on the true mean exam score at a local university, we construct a simulated null distribution using the code below. Based on this code, what type of distribution are we assuming for the null?
Binomial
Uniform
Standardized
Normal
Normal
Suppose we complete a hypothesis test on the true mean height (inches) of players in the Women's National Basketball Association (WNBA). Our hypotheses are,
Ho: u = 73
HA: u > 73
The test includes a significance level of 0.05 and a p-value of 0.10. What is the appropriate conclusion for this test?
We have proven that the true mean height is 73 inches.
We have proven that the true mean height is greater than 73 inches.
We have sufficient evidence to suggest the true mean height is greater than 73 inches.
We have insufficient evidence to suggest the true mean height is greater than 73 inches.
We have insufficient evidence to suggest the true mean height is greater than 73 inches.
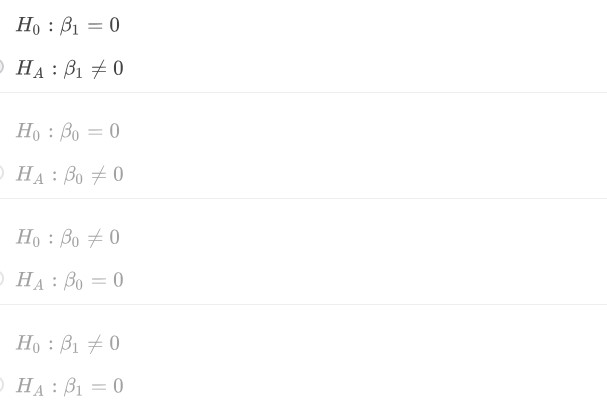
Imagine you gather a random sample of arm lengths (x) and body weights (y) for students across campus. You want to determine if there is evidence of a linear association between these two variables using a hypothesis test on the best-fit line y=Bo+B1x. What are the appropriate hypotheses for this test?
Ho: B1 = 0
HA: B1 =/= 0
During a hypothesis test on the slope parameter of a simple linear regression model, we select a significance level of a = 0.05. Had we instead selected a significance level of a = 0.01, we would have required __________ evidence in favor of the alternate hypothesis and thus been __________ likely to reject the null hypothesis.
weaker, more
stronger, less
weaker, less
stronger, more
stronger, less
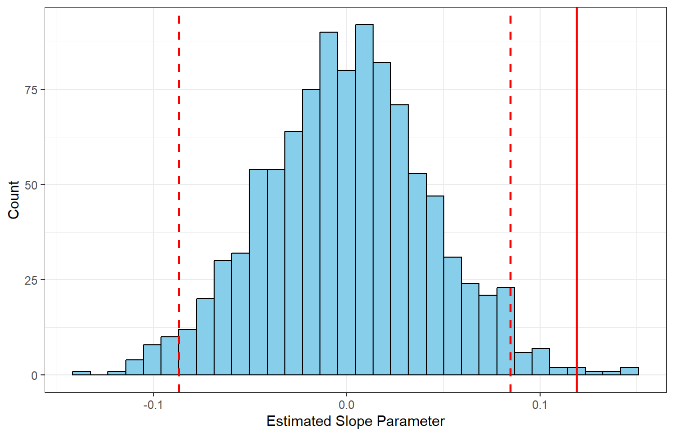
Imagine we conduct a hypothesis test on the slope parameter of a simple linear regression model. In the randomized null distribution depicted below, the dashed lines represent significance thresholds and the solid line represents the observed slope. Which of the following statements is TRUE?
The p-value is smaller than the significance level.
The p-value and significance level cannot be compared in this plot.
The p-value is larger than the significance level.
The p-value is equal to the significance level.
The p-value is smaller than the significance level.
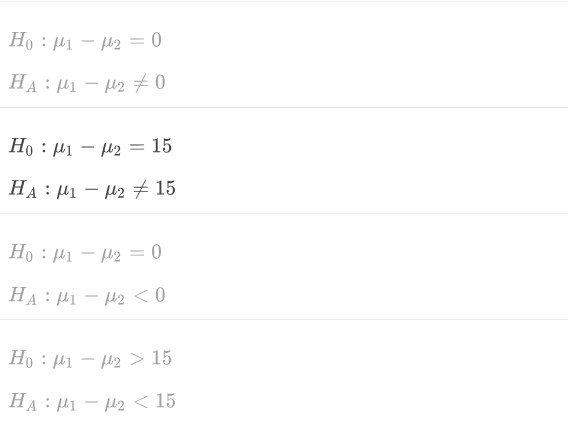
In professional boxing, fighters in the middleweight division weigh 160 pounds and fighters in the light heavyweight division weigh 175 pounds. Suppose a friend claims that the difference in body weight between the average light heavyweight (u1) and the average middleweight (u2) is not what the requirements dictate. What are the appropriate hypotheses to test this claim?
Ho: u1 - u2 = 15
HA: u1 - u2 =/= 15
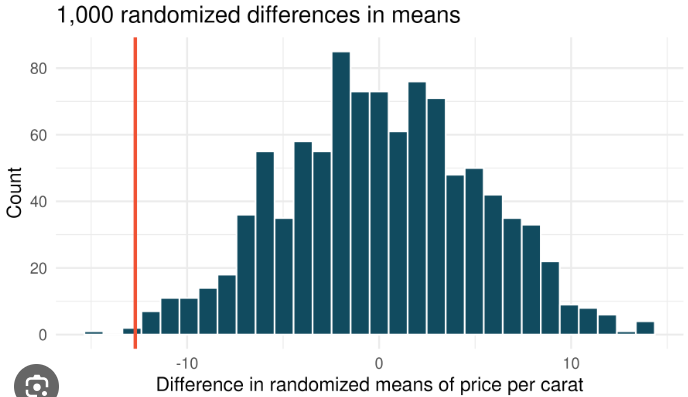
Suppose you are in the market to purchase a diamond ring and trying to choose between two jewelry stores. You read a news article that claims Shane Co. charges a lower average price per carat (u1) than that of Zales (u2). Based on random samples of sales from both stores, you generate the randomized null distribution below to test the alternate hypothesis HA: u1 - u2 < 0. The solid red line in the graphic represents the observed difference in sample means. If the significance threshold for your test was set at -15, then what should be your conclusion?
Fail to reject the null hypothesis
Accept the alternate hypothesis
Accept the null hypothesis
Reject the null hypothesis
Fail to reject the null hypothesis
Suppose we wish to solve the problem described below using a statistical learning model. Does the problem statement suggest a supervised or unsupervised learning approach?
Biomedical research on human blood cells produces thousands of predictor variables that describe cell characteristics. Scientists may be interested in carefully combining many of these variable values in order to reduce the total number of predictors under consideration, while not losing too much valuable information.
Unsupervised
Supervised
Unsupervised
Suppose we wish to solve the problem described below using a statistical learning model. Does the problem statement suggest a supervised or unsupervised learning approach?
Sports analysts often build models to predict the performance of players in future games. Imagine we want to predict the number of touchdown passes achieved by each starting quarterback in the upcoming weekend based on their performance in previous games.
Unsupervised
Supervised
Supervised
Suppose we wish to solve the problem described below using a statistical learning model. Does the problem statement suggest a regression or classification approach?
Biostatisticians often build models to predict whether a patient has contracted a certain disease. Imagine we want to predict whether or not a patient has COVID based on a variety of symptoms and characteristics.
Classification
Regression
Classification
Suppose we wish to solve the problem described below using a statistical learning model. Does the problem statement suggest a regression or classification approach?
Business analysts want to predict the average wait time for customers at Starbucks based on the time of day and number of items ordered.
Regression
Classification
Regression
The following statement describes a particular type of statistical learning model. Does the description suggest a parametric or nonparametric approach?
We want to predict y based on its association with another variable x by estimating the following function: y = B0 + B1x + B2X²
Parametric
Nonparametric
Parametric
The following statement describes a particular type of statistical learning model. Does represent the predictor or the response variable in this model?
We want to predict y based on its association with another variable x by estimating the following function: y = B0 + B1x + B2X²
Response
Predictor
Predictor
In the development of a linear regression model, we estimate the parameters of the model using _______ data and then evaluate the prediction accuracy of the model using _______ data.
nonparametric, parametric
training, testing
testing, training
parametric, nonparametric
training, testing
When a prediction model is tested using the same data with which it was trained, there is a risk of overestimating its accuracy on future data. We refer to this phenomenon as ________.
splitting
overfitting
validation
extrapolation
overfitting
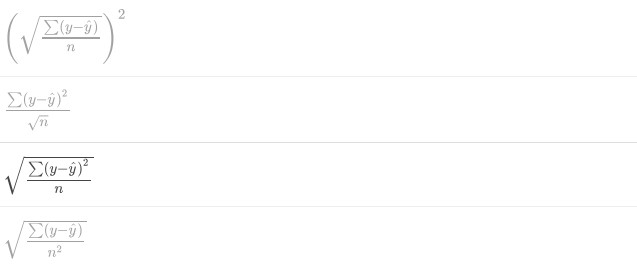
The primary metric used to test the accuracy of a regression model is root mean squared error (RMSE). Suppose we have a testing set comprised of n values for the response variable y which we predict with y-hat. Which of the following equations represents RMSE?
c

The code below is designed to split a data frame called penguins2 into training and testing sets. The data frame consists of 1,000 rows and 10 columns. Imagine we only want to use 20% of the data for testing. Which of the options is appropriate to fill in the blank after size=?
floor(0.20*nrow(penguins2))
800
floor(0.75*nrow(penguins2))
250
800
Suppose we construct a regression model to predict the resting heart rate (beats per minute) of local residents based on age, body mass index, and income level. After using our model to predict a testing set, we obtain a RMSE of 5 bpm. We want to compare this accuracy to that of a null model. In this context, the null model consists of always predicting the ________ .
mean heart rate in the training set
maximum heart rate in the testing set
mean heart rate in the testing set
maximum heart rate in the training set
mean heart rate in the training set
Multiple linear regression models differ from simple linear regression models in that they include more than one __________.
predictor
response
predictor
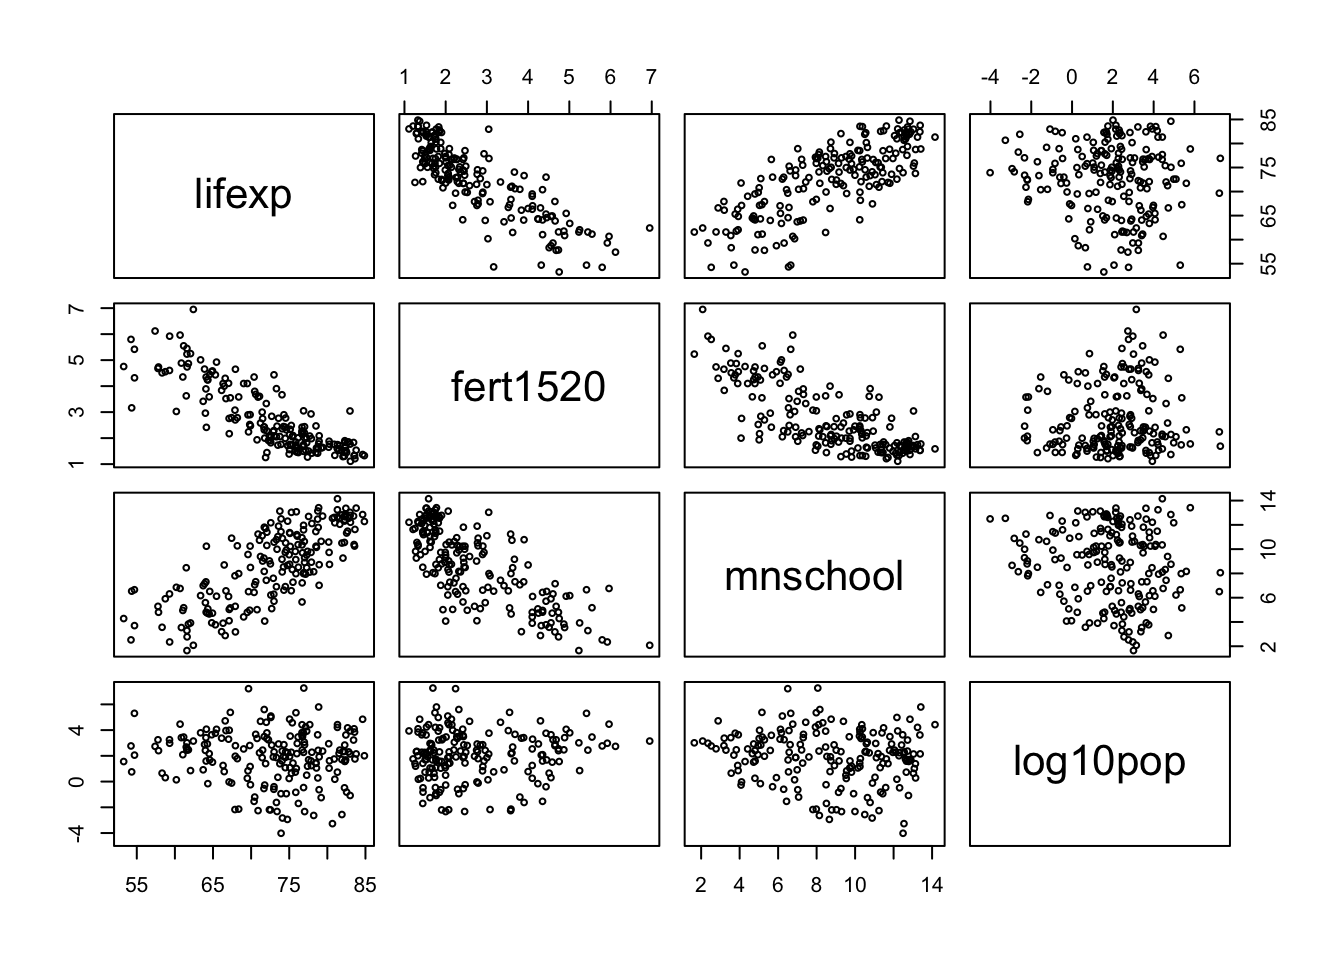
Imagine you are asked to develop a multiple linear regression model to predict life expectancy (lifexp). Based on the scatter plot matrix below, which of the three predictor variables appears to be the least helpful in predicting life expectancy?
log10pop
mnschool
fert1520
log10pop
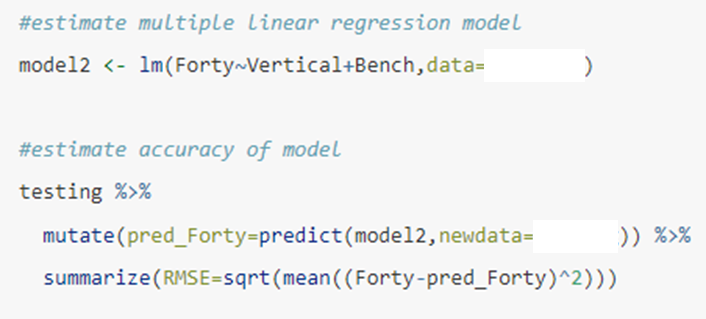
After splitting a sample into training and testing sets, imagine you estimate and evaluate the multiple linear regression model (model2) shown below. Which data set should be referenced in the blank boxes after data= and newdata= ?
testing, training
training, testing
training, testing

Imagine you estimate the multiple linear regression model below to predict the prevalence of heart disease (as a %) within a given community. Your predictor variables are the percentage of the population that bikes to work and the percentage that smoke. What heart disease prevalence would you predict for a community where 50% of people bike to work and 10% of people smoke?
21.90%
8.22%
14.98%
6.76%
6.76%
Suppose you estimate a multiple linear regression model to predict the sale price (dollars) of a home based on its area (square feet) and age (years). Then you evaluate the accuracy of the model against a testing set and obtain a RMSE of 25,225. What is the proper interpretation of this value?
The sale prices in the testing set differ from the mean sale price by $25,225.
We expect the model to predict the sale price of a home to within $25,225, on average.
We expect the model to predict the area of a home to within 25,225 square feet, on average.
The model requires 25,225 observations in the testing set to produce the required accuracy
We expect the model to predict the sale price of a home to within $25,225, on average.
When evaluating the accuracy of a multiple linear regression model, we should always compare the root mean squared error (RMSE) to that of the null model. The null model consists of always predicting the ________ response value in the __________ set.
mean, training
mean, testing
minimum, testing
minimum, training
mean, training
Suppose we have a simple linear regression model with a single categorical predictor variable. That categorical variable must consist of ________ level(s).
three
zero
two
one
two
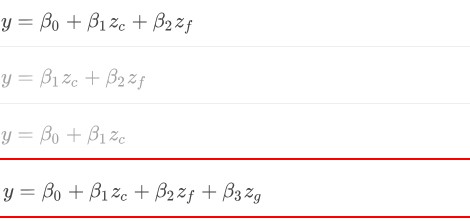
We are asked to construct a multiple linear regression model to predict the average number of rebounds for basketball players based on their position. In this case, position is a categorical predictor that consists of three levels: center, forward, and guard. Let represent y the number of rebounds and zc, zf, zg be binary variables that are equal to 1 if a player is a center, forward, or guard, respectively. Which of the following is the appropriate model for this scenario?
y= B0 + B1zc + B2zf
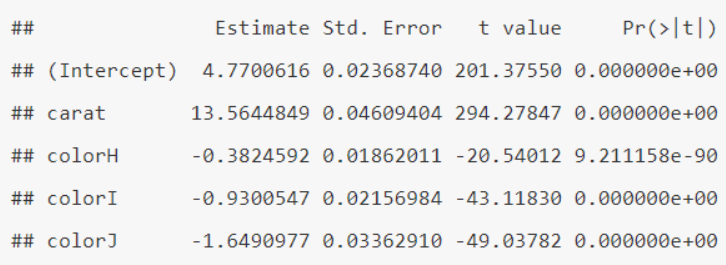
Suppose you estimate a multiple linear regression model to predict the cube-root price of a diamond based on its carat (numerical predictor) and its color (categorical predictor). What price (rounded to nearest dollar) would you predict for a 0.5 carat diamond with H color?
$1,199
$1,394
$1,542
$971
$1,394
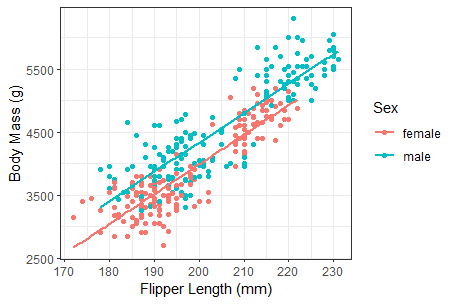
Suppose we want to construct a multiple linear regression model to predict the body mass of a penguin based on its flipper length (numerical) and its biological sex (categorical). Based on the scatter plot below, which statement best describes the association between variables?
As flipper length increases, body mass tends to decrease. However, on average, females have a higher body mass than males.
As flipper length increases, body mass also tends to increase. However, on average, males have a higher body mass than females.
As flipper length increases, body mass tends to decrease. However, on average, males have a higher body mass than females.
As flipper length increases, body mass also tends to increase. However, on average, females have a higher body mass than males.
As flipper length increases, body mass also tends to increase. However, on average, males have a higher body mass than females.
Suppose we want to construct a multiple linear regression model to predict the body mass (y) of a penguin based on its flipper length (x) and a binary indicator (z) of whether it is a biological male. Thus, you want to estimate the parameters of the following equation:
y = B0 + B1x + B2z
The scatter plot below depicts the training data you will use. Based on this plot, what would you expect to obtain for the sign of the parameter estimate B2?
Positive
Negative
Positive
Suppose we want to construct a multiple linear regression model to predict the body mass (grams) of a penguin based on its flipper length (millimeters) and its biological sex (1=male, 0=female). We train the model and evaluate its accuracy on a test set, resulting in a root mean squared error (RMSE) of 354. What should we compare this error to as an assessment of the model's predictive value?
The RMSE obtained when we always predict the average flipper length in the training set.
The RMSE obtained when we always predict the average flipper length in the testing set.
The RMSE obtained when we always predict the average body mass in the training set.
The RMSE obtained when we always predict the average body mass in the testing set.
The RMSE obtained when we always predict the average body mass in the training set.
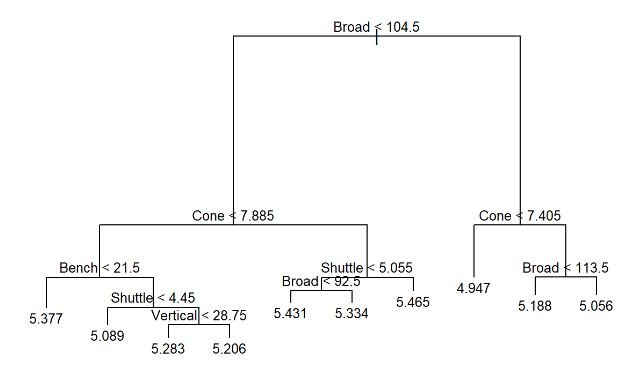
The decision tree below represents a regression model for predicting forty-yard dash time (seconds) based on broad jump (inches), vertical jump (inches), bench press (reps), cone drill (seconds), and shuttle run (seconds). Using this model, what forty-yard dash time would you predict for a player with the following characteristics: broad jump (102), vertical jump (29), bench press (23), cone drill (7.8), and shuttle run (4.5)?
5.334 seconds
5.188 seconds
5.206 seconds
5.089 seconds
5.206 seconds
At each branch of a regression tree, we choose the predictor variable and decision threshold that provide the _______ reduction in ________.
maximum, error
minimum, error
minimum, leaves
maximum, leaves
maximum, error
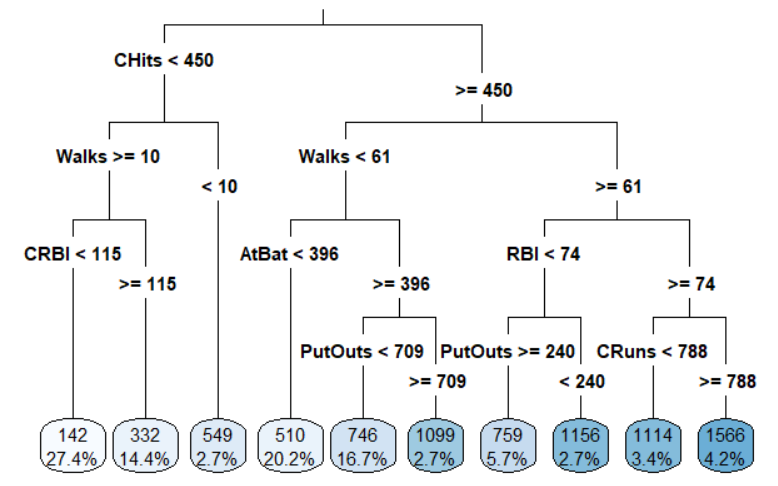
The decision tree below represents a regression model for predicting the average salary (thousands $) of a baseball player based on their performance statistics. The percentages listed in the leaves at the bottom of the tree indicate the proportion of the training data with the associated characteristics. Based on this model, what salary would you predict for a player with the following statistics: 380 at-bats (AtBat), 50 walks (Walks), and 475 career hits (CHits)?
$332,000
$510,000
$1,099,000
$1,114,000
$510,000
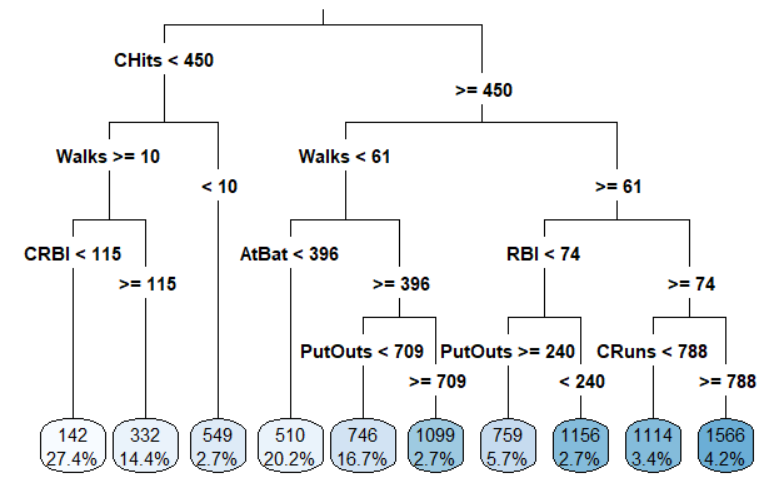
The decision tree below represents a regression model for predicting the average salary (thousands $) of a baseball player based on their performance statistics. The percentages listed in the leaves at the bottom of the tree indicate the proportion of the training data with the associated characteristics. Based on this model, what salary would you predict for a player with the following statistics: 515 at-bats (AtBat), 75 walks (Walks), 68 runs batted in (RBI), 100 fielder outs (PutOuts), 285 career runs batted in (CRBI), 450 career hits (CHits), and 340 career runs (CRuns)?
$1,156,000
$332,000
$1,566,000
$746,000
$1,156,000
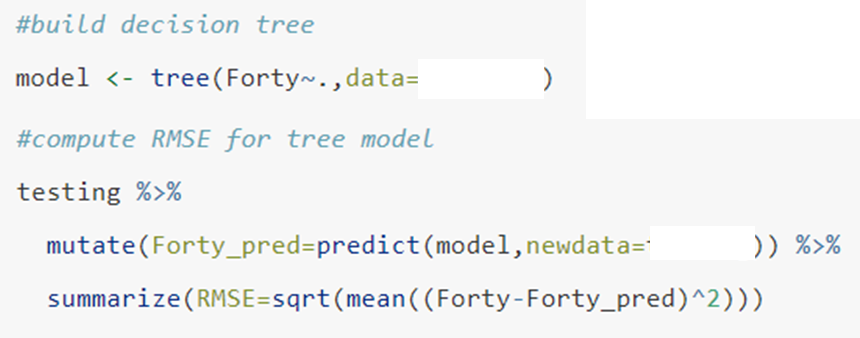
Imagine you are asked to construct a regression tree to predict the forty-yard dash time of a football player based on other performance characteristics. You obtain a random sample of player in a data frame called combine. You then split the the sample into training and testing sets. The code below estimates and evaluates the model. Which data frames should you choose in the blank boxes?
training, combine
training, testing
testing, training
combine, testing
training, testing
Suppose we construct a classification model to predict a penguin's sex (male or female) based on its body mass. We have a training set of 400 penguins consisting of 220 females and 180 males. We also have a testing set of 100 penguins for which 52 are female and 48 are male. What is the classification error rate (CER) of the null model in this scenario?
52%
55%
48%
45%
48%
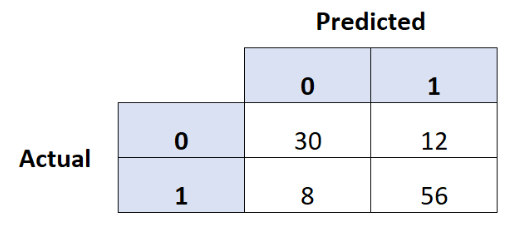
Imagine we use a multiple logistic regression model to predict whether a hockey team wins (1) or loses (0) a total of 106 games. We summarize the results of our predictions in the confusion matrix below. What is the overall accuracy of our model?
88%
71%
81%
79%
81%
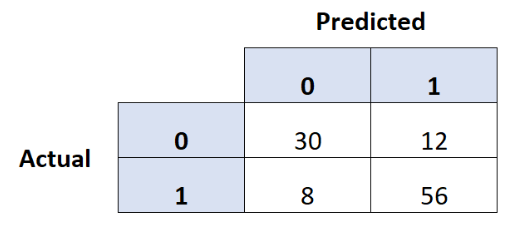
Imagine we use a multiple logistic regression model to predict whether a hockey team wins (1) or loses (0) a total of 106 games. We summarize the results of our predictions in the confusion matrix below. What is the false positive rate of our model?
21%
19%
13%
29%
29%
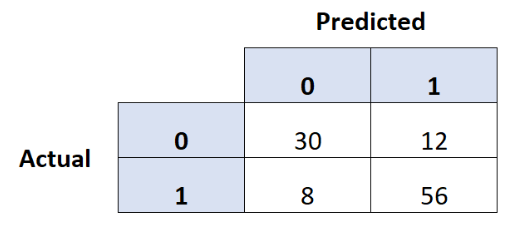
Imagine we use a multiple logistic regression model to predict whether a hockey team wins (1) or loses (0) a total of 106 games. We summarize the results of our predictions in the confusion matrix below. What is the negative predictive value of our model?
29%
21%
79%
71%
79%
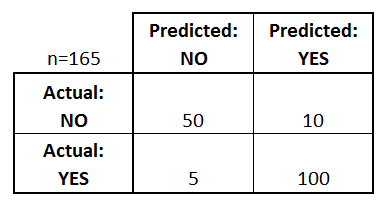
Suppose you classify a testing set consisting of 165 observations with possible response values of Yes (1) or No (0). Based on the confusion matrix below, what is the false omission rate (FOR) of your model?
17%
6%
5%
9%
9%
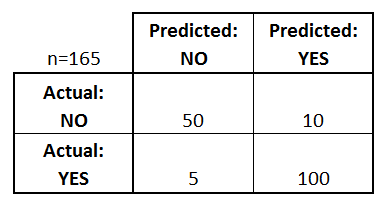
Suppose you classify a testing set consisting of 165 observations with possible response values of Yes (1) or No (0). Based on the confusion matrix below, what is the false negative rate (FNR) of your model?
10/110
5/105
10/60
5/55
5/105

Suppose we estimate a multiple logistic regression model and obtain the output below. The binary response variable indicates whether a person defaults (1) on a bank loan or not (0). The predictors include years of employment, years at current address, debt-to-income ratio, and credit card debt (in $K). Based on this model, what proportion of borrowers are predicted to default when they have the following characteristics: EMPLOY=5, ADDRESS=15, DEBTINC=0.3, and CREDDEBT=5.
0.639
0.257
0.841
0.418
0.418

Suppose we estimate a multiple logistic regression model and obtain the output below. The binary response variable indicates whether a person defaults (1) on a bank loan or not (0). The predictors include years of employment, years at current address, debt-to-income ratio, and credit card debt (in $K). Based on this model, what classification would you assign for a borrower with the following characteristics: EMPLOY=2, ADDRESS=4, DEBTINC=0.5, and CREDDEBT=8.
Not Default
Default
Default
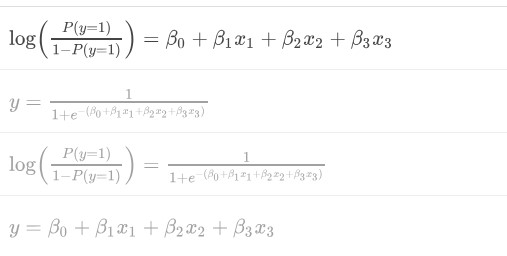
Imagine we want to predict a binary response y that is equal to 1 when a hockey team wins a game and 0 otherwise. We construct a multiple logistic regression model based on three predictors x1, x2, x3. Which function below is a valid representation of the multiple logistic regression model?
a
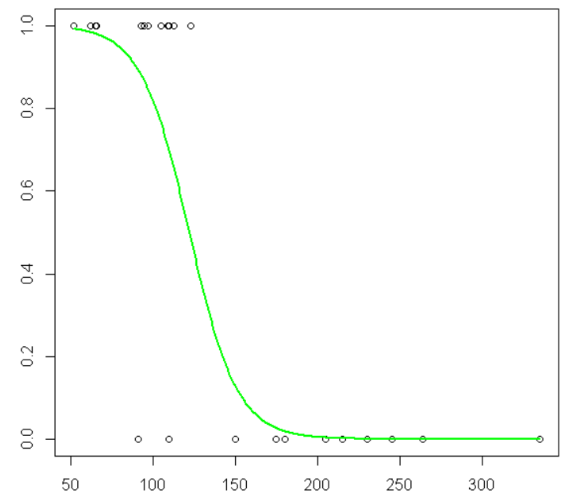
Prior to estimating a multiple logistic regression model with two numerical predictors, you construct the scatter plot below. The plot displays the logistic association between the first predictor (x1) and the binary response (y). Which of the following statements about this predictor variable is TRUE?
The estimated coefficient (B1) for x1 will be negative.
As x1 increases, the proportion of y values equal to 1 also tends to increase.
As x1 increases, the proportion of observations with decreases by B1.
The estimated coefficient (B1) for x1 depends on the value of x2.
The estimated coefficient (B1) for x1 will be negative.
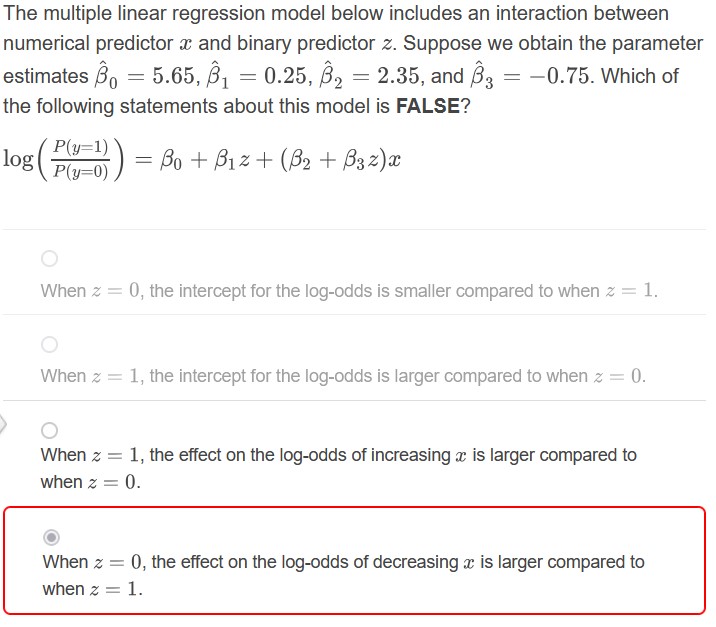
c
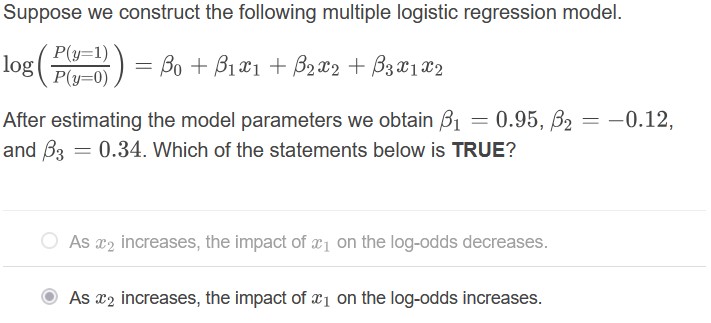
b
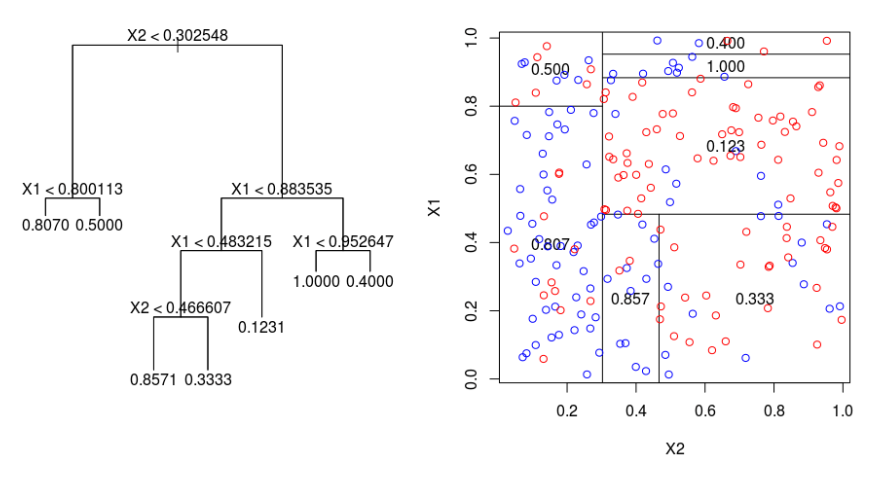
Below we have a classification tree and the associated segmentation of the predictor space. Our goal is to predict a binary response that is equal to blue (1) or red (0) based on two predictors X1 and X2. What blue proportion would you predict for an observation with X1=0.5 and X2=0.45?
0.857
0.333
0.123
0.807
0.123
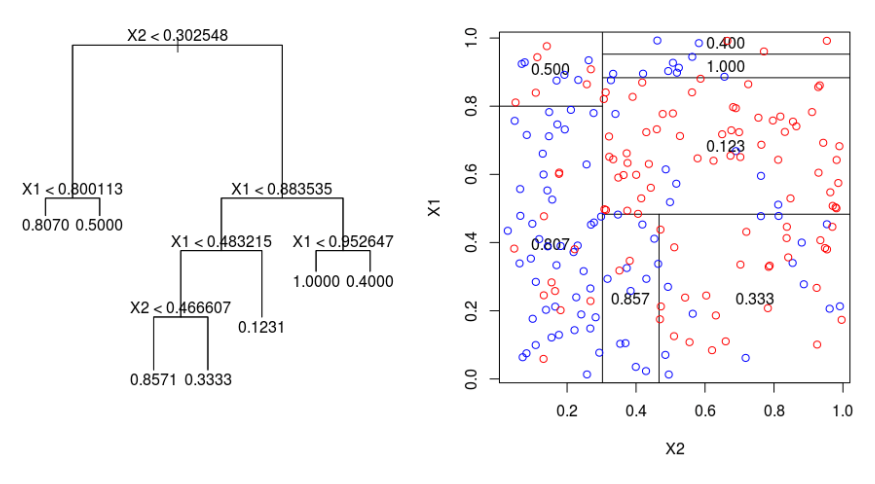
Below we have a classification tree and the associated segmentation of the predictor space. Our goal is to predict a binary response that is equal to blue (1) or red (0) based on two predictors X1 and X2. Based on a classification threshold of 0.50, what color would you predict for an observation with X1=0.96 and X2=0.63?
Red
Blue
Red