TOPIC 1: A tour of Labor markets
1/50
There's no tags or description
Looks like no tags are added yet.
Name | Mastery | Learn | Test | Matching | Spaced | Call with Kai |
|---|
No study sessions yet.
51 Terms
Where is the data coming from ?
The European Labor Force survey (EU - LFS)
key to understand employment trends, unemployment rates and the demographics of the labor force within the EU
Sampling rates in the various countries vary between 0,2 and 2,1%
updated every week (accurate to last week)
The EU LS key elements
Diverse participation: covers various countries with varying labor market dynamics, from the high employment rates in Nordic countries to the unique challenges Southern European economies face
Adaptability: The EU-LFS incorporates various ad-hoc modules to address emerging labor market issues, such as the rise of gig economy jobs (free-lance jobs commonly facilitated through digital platforms or apps), teleworking trends, and the impact of technological advancements on employment.
Educational Insights: The survey provides detailed data on educational attainment and its correlation with employment, offering valuable insights into how education levels influence labor market outcomes across regions.
Policy Impact: Data from the EU-LFS play a crucial role in shaping policies, including initiatives aimed at reducing youth unemployment, promoting gender equality in the workplace, and enhancing mobility.
Working age population (WAP or potential workers)
people between 15 and 65
excluded from WAP =military, hospitalized, jail
Type of variable for population
Stock variable
Labor force
employed (E) (hold a paid full time or part time job; worked for at least 1 paid hour in the last week)
unemployed (U) (without a job willing to work and actively looking for a lob; people who have found a job and are waiting to start are also considered unemployed)
Working age not in the labor (potential non active workers)
* A person is actively seeking work if she/he: |
• Has been in contact with a public or private employment office with the object of finding work. |
• Has sent a candidature directly to employers. |
• Has inquired via personal contacts, unions, etc. |
• Has put an ad up or answered newspaper ads. |
• Has participated in a test, competition or interview in the context of a contracting process. |
• Etc. |
Stock variable
if measured at a point in time
Flow variable
If measured over a period of time
Inflows => increase a stock
Outflows => decrease stock
Inflows/outflows of working population
Working population going up, causes ?
immigration (just need to be between 15 and 65)
Working population going down, causes ?
Emmigration (decrease also the population and unemployment or employment based on the case)
Subgroups of WAP
labor force: (SUM of unemployed and employed people)
Not in the labor force persons (or inactive persons) are without a paid job and not actively searching for one. People are considered inactive if they do not want to work or can't work.
This includes:Full-time students of working age (regardless of working status)
Discouraged workers
Retirees under retirement age
Homemakers and stay-at-home parents
Individuals with long-term illnesses or disabilities
Volunteers
Wealthy individuals not seeking employment
People on sabbatical or career break
Retired person
A retired person can be part of the working-age population if they fall within the age range typically defined for that group (e.g., 15-
65 years old).If someone retires early but is still within the working-age range (e.g., 55 years old), they are part of the working-age population but may not be part of the labor force (because they are not working or actively seeking work).
If someone is above the working-age limit (e.g., 65 years old or older), they are no longer part of the working-age population, regardless of what they do.
So, whether a retired person is part of the working-age population depends on their age relative to the working-age definition.
Graphic review

Unemployment rate
The unemployment rate (UR) is the percentage of the labor force (LF) that was unemployed (U) (jobless + searching on the week before the survey)
0 ≤ Ur = U/LF = U/ U+E ≤ 1
=> ratio between 2 stock variables (unemployment and labor force)
=> Unemployment or labor force cannot be negative (numerator subset of the denominator)
=> U = 0 E >0 (good cause unemployment low and very close to 0, however not to good cause no change to search for better jobs and not trying to improve their working situation)
=> E = 0
=> healthy level of unemployment = frictional unemployment
Inflows/outflows of population
Inflows of pop => immigration & birth
Outflows pop => emmigration & death
Net flow
inflows of x / outflows of x
capital = stock variable
change of stock = flow
GDP ↑ => ↓Ur U↓

Negative relationship => counter cyclical
GDP ↑ => ↑
Positive relationship => Pro cyclical
DU (discourage unemployment) ↑
↓GDP, U↓, E=,Er=, LF↓, WAP=,POP=, Ur↓, ↓LFPR
=> often happen in period of recession
Employment rate
The employment rate (ER) is the percentage of the working-age population (WAP) that was employed (E) (at least 1 hour of paid work on the week before the survey)
0 ≤ Er = E/ WAP ≤ 1
=> E subset of the WAF
=> E = 0 ; U = LF ; Ur = 1
=> E = WAP ;U = 0 => LF = E ;Ur = 0
drop in gdp
drop in Er
drop in Ur
=> could represent increase in discouraged worker
Labor force participation rate (LFPR)
The Labor-force participation rate (LFPR) is the percentage of the working-age population (WAP) that was in the labor force (LF = U + E) on the week before the survey.
0 ≤ LFPR = LF/ WAP = E+U/WAF ≤ 1
=> LFPR = 0 ;U=E=0
=> LFPR = 1 = WAP
Tendency of drop in LFPR, causes ?
Schooling (seeking high education, start working later)
older people (>65) exit LF and WAP and become only pop, demographic change in the population
Unemployment in macroeconomics
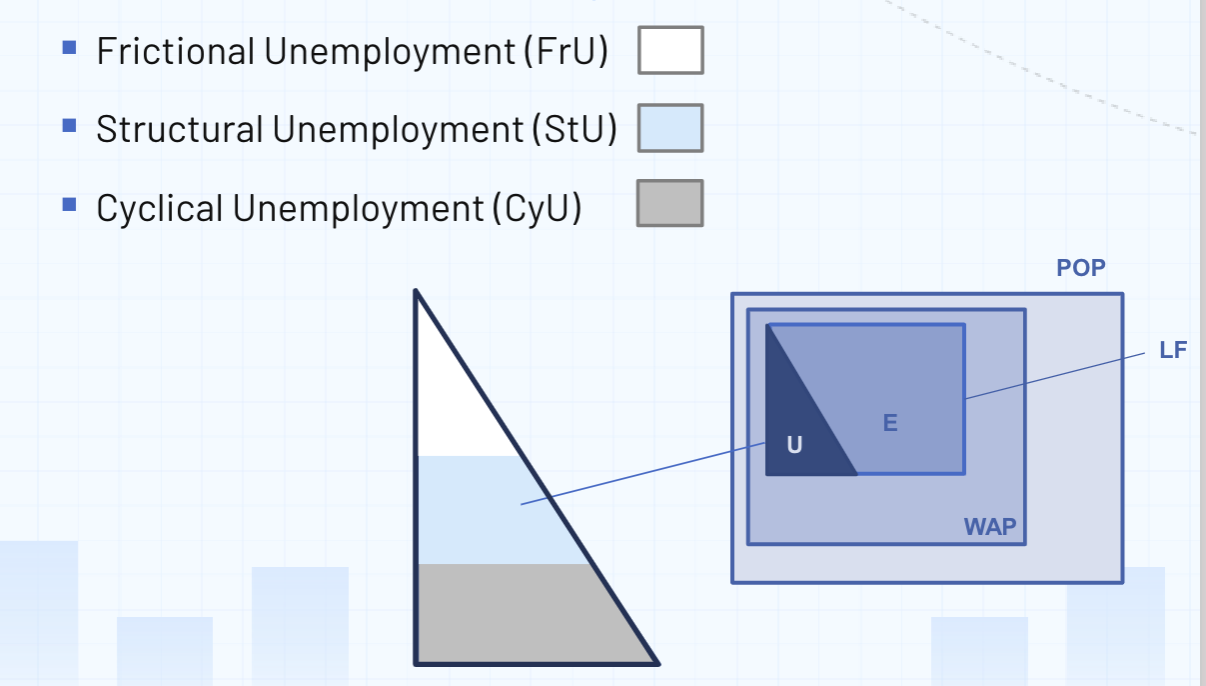
Frictional Unemployment
It happens when people are temporarily between jobs. It occurs as
workers voluntarily leave a job to search for another or are fired due to personal or business-specific reasons, enter job market for the first time.This type of unemployment is usually short-term and is considered a natural part of a healthy economy.
In general, unemployment is frictional when a job search should, in a
‘short’ period, leads to a job match. Examples:i. A recent college graduate searching for first job after completing
degree.ii. A teacher moving to a new city and looking for a new teaching position.
iii. A software developer who quit their current job to find a better-paying
position at another company.iv. A parent re-entering the workforce as a store clecrk after taking time
off to care for their children.
Structural unemployment
It occurs when workers' skills do not match the jobs available in the
economy. This can be caused by technological advancements, changes in industries, or geographic mismatches between workers and employers.It is typically a long-lasting kind of unemployment that can lead to
emigration, discouraged unemployment, requalification and
retraining…often via public help or public fundings. Examples:i. A factory worker who lost their job because the factory adopted automation and now requires workers with robotics skills.
ii. A travel agent unable to find work because most people now book their trips online.
iii. A coal miner struggling to find a job as the economy shifts towards renewable energy industries.
iv. A typewriter repair technician who became unemployed due to the near-universal adoption of computers.
v. A textile worker in a rural area where the factory closed, with no similar jobs available nearby.
Cyclical unemployment
Cyclical unemployment happens during periods of economic downturns or recessions when there is not enough demand for goods
and services, leading companies to lay off workers.It may be long-term (depending on the duration of recession) and may
lead to short-term and temporary emigration.Any (fiscal or monetary) policy that is able to ‘flatten’ the business cycle would reduce (or eliminate) cyclical unemployment. Examples:
i. A construction worker laid off because fewer homes are being built during a recession.
ii. A retail store employee who loses their job because consumer spending decreases during an economic slowdown.
iii. An airline pilot who is temporarily unemployed due to a drop in air travel during an economic crisis.
iv. A hotel receptionist who is let go because fewer tourists are traveling during an economic downturn.
Discourage unemployment
when people don't count themselves as unemployed in the formal statistics for labor market, but they would rather work if they were hoping to find work.
Underemployment
occurs when a person is employed but would like and
be available to work more hours (many underemployed are part-time
workers).
Seasonal unemployment
occurs at different times of the year due to seasonal patterns affecting the labor market (ski instructors work related to the holiday). It is considered part of structural unemployment
Natural unemployment (NU)
the sum of Frictional unemployment and Structural Unemployment. The associated rate of unemployment is known as NAIRU (Non-Accelerating Inflation Rate of Unemployment)
Natural unemployment and NAIRU
NU = FrU + StU => 0 ≤ NAIRU = NU/LF (x100) ≤ 1
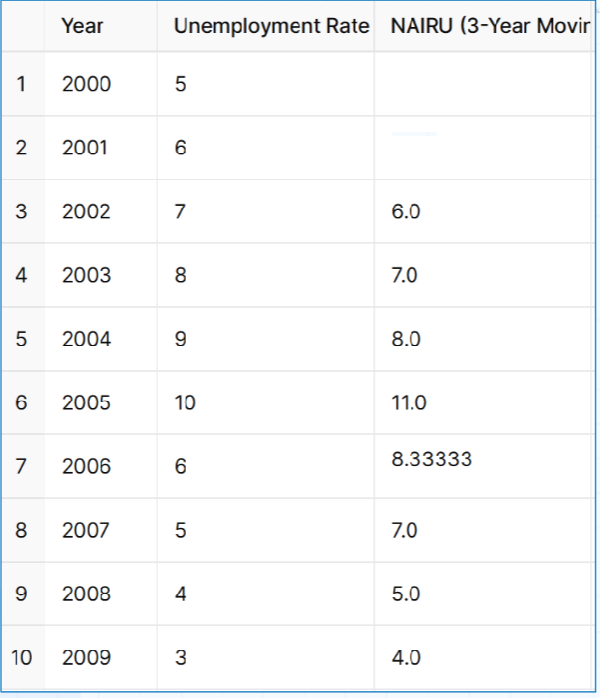
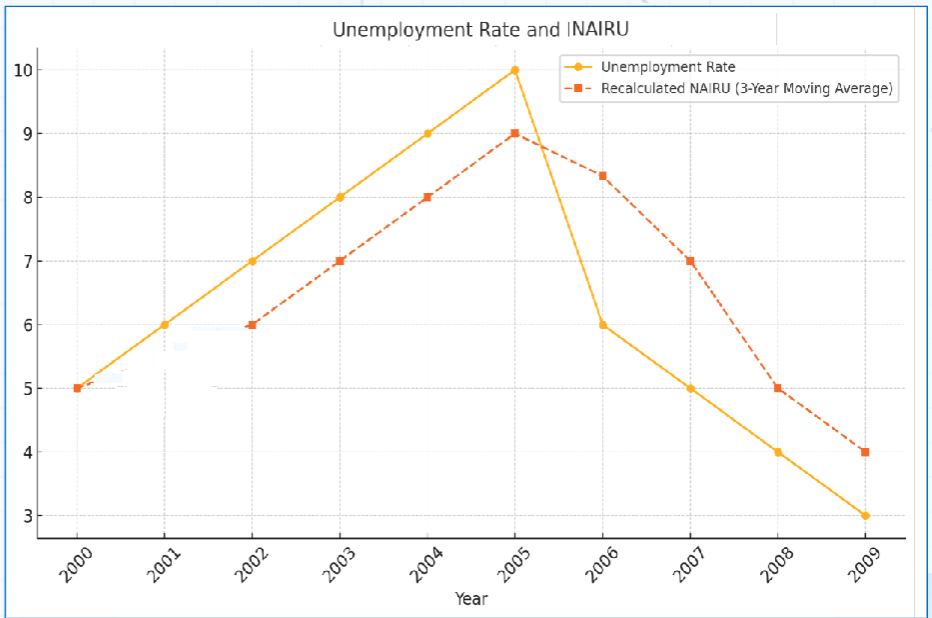
NAIRU as a moving average
NAIRU = NU/LF > RU => CyU < 0
By expressing unemployment as number of hours of labor that were
not supplied to the economy by unemployed (rather than as number of
people), cyclical unemployment is allowed to be negative, and NAIRU is
allowed to exceed total unemploymentIn practice, The NAIRU (Non-Accelerating Inflation Rate of
Unemployment) can be calculated as a moving average of the
unemployment rate. A moving average smooths fluctuations in the
data, providing a better estimate of the long-term equilibrium
unemployment rate that is consistent with stable inflation.To compute the NAIRU as a moving average, we calculate the average unemployment rate over a rolling time window (e.g., 3, 5 years, etc.).
The size of the window depends on the desired level of smoothing.
Example NAIRU
NAIRUt+2 = (RUt + RUt+1 + RUt+2)/3
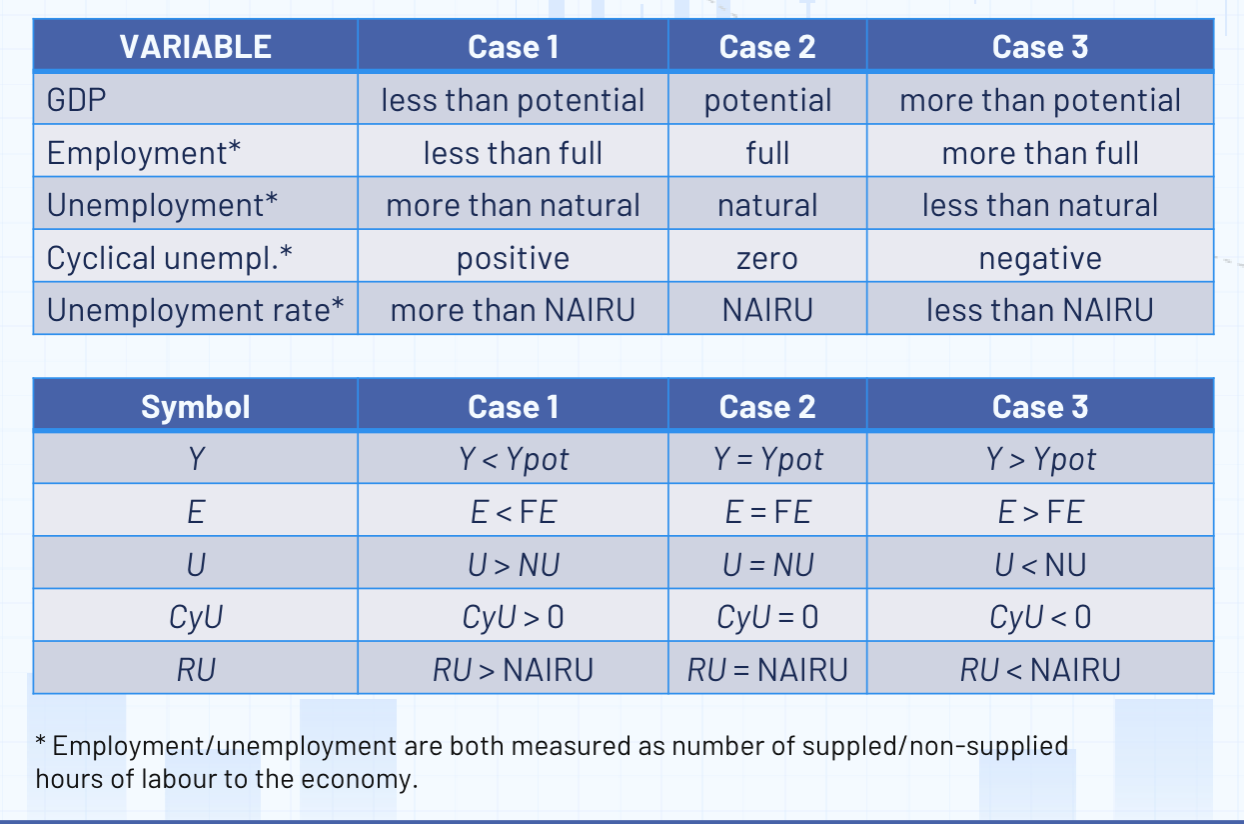
Key relationships
Competitive labor market assumptions
Many Employers and Workers:
single employer or worker can influence wages (wage takers).
Wage is determined by supply and demand.
Perfect Information:
Workers know all job opportunities.
Employers are aware of worker availability and skills.
Homogeneous Labor:
All workers in the market are considered identical in skills and productivity. Typically, low-skilled and low-quality labor.
Free Entry and Exit:
Firms can enter or leave the labor market without restrictions.
Workers can freely switch jobs.
Labour supply
=> Represents the total number of (or the total number of hours that) workers are willing and able to work at different wage levels, given their preferences and constraints.
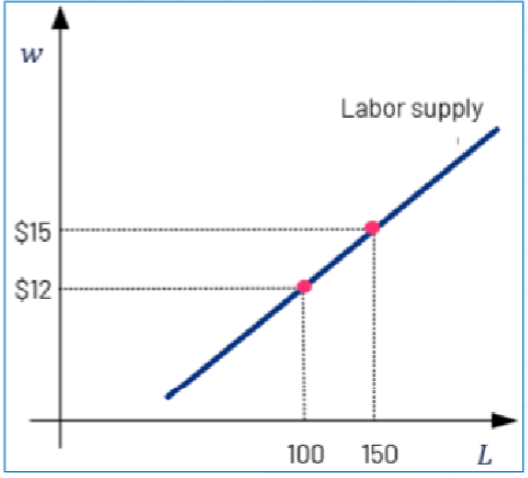
Supply curve
=> may be linear but typically are not
Wage Rate: The unit price of labor (1 hour, 1 month, 1 person, etc.). Higher wages typically increase the incentive to work, up to a point.
UpwardSloping: At lower wages, the substitution effect dominates, and workers supply more labor.
BackwardBending:At higher wages, the income effect dominates, and labor supply might be decreasing.
Wage Rate
The unit price of labor (1 hour, 1 month, 1 person, etc.).
Labor Demand
=> Represents the total number of (or the total number of hours that) workers that are demanded by firms at different wage levels, given their technology and their costs of production.
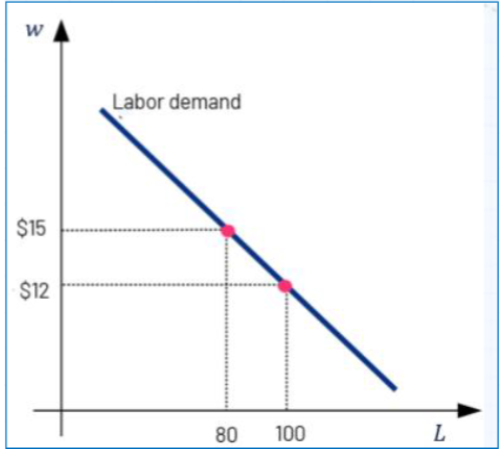
Demand curve
Demand curves may be linear but typically are not.
Wage Rate: The unit price of labor (1 hour, 1 month, 1 person, etc.). Higher wages typically decrease the need to hire labor. In particular if labor can be replaced by cheaper inputs of production (such as machines, or technology).
DownwardSloping:At all wages, greater salaries shrink a firm's profit. Companies replace labor with cheaper inputs (foreign labor, machines, etc.)
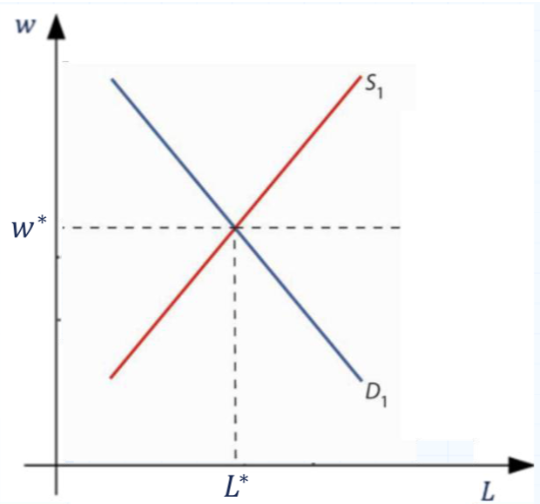
Equilibrium in labor market
In labor market => auctioneer => individual in charge of setting the wage that equals the quantity demanded and the quantity supplied of labor
=> the wage and quantity are called equilibrium wage and equilibrium quantity(or equilibrium employment)
=> supply increase => shift to the right => Wage lower => quantity trade of labor increase
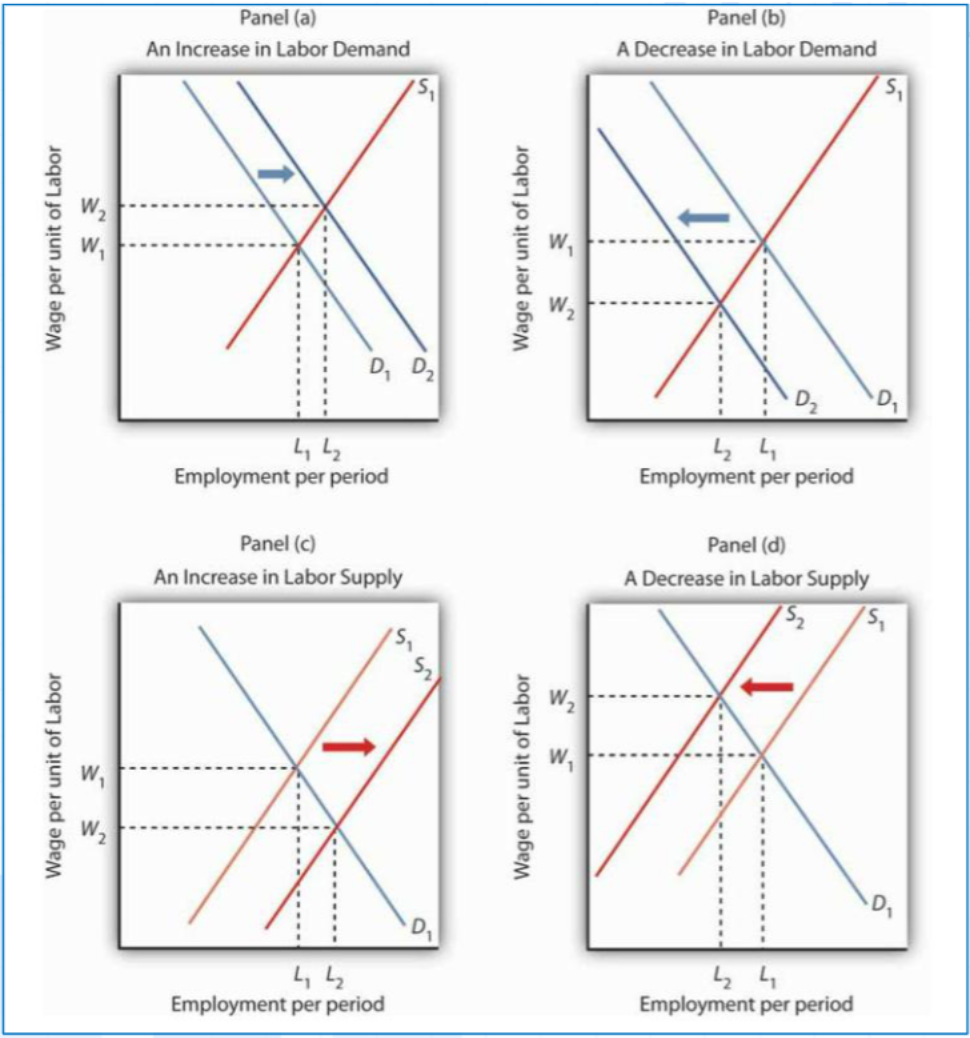
Main causes of shifts in labor supply curve (labor supply increases or decreases for each and all wage rate levels)
Change In the number of suppliers (potential workers), mainly due to emigration/immigration and/or change in population composition or level of education.
Change in preferences towards working (either in general or in the particular market)
The business cycle
Main causes of shifts labor demand curve (labor demand increases or decreases for each and all wage rate levels)
Change in the numbers of demanders(firms).
Change in costs of production (oil shocks, interest rates, etc.)
Change in technology used to produce output
Shifts in labor curves
If wage w* is free to adjust, it will decrease based on the excess demand or supply that occurs in the market as a consequence of shifts in either the demand and/or the supply curve for labor.
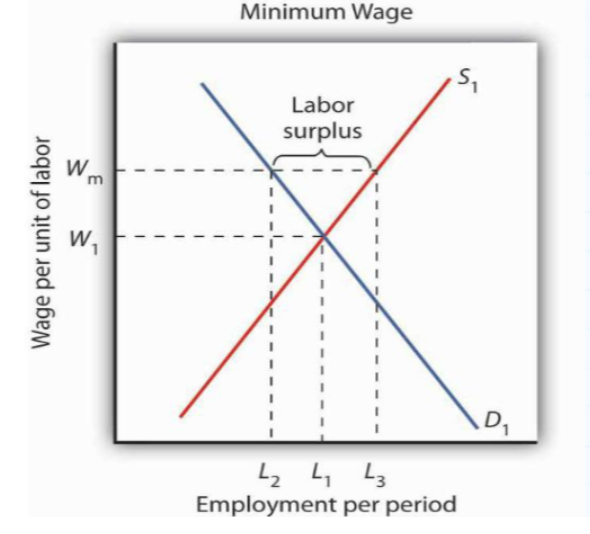
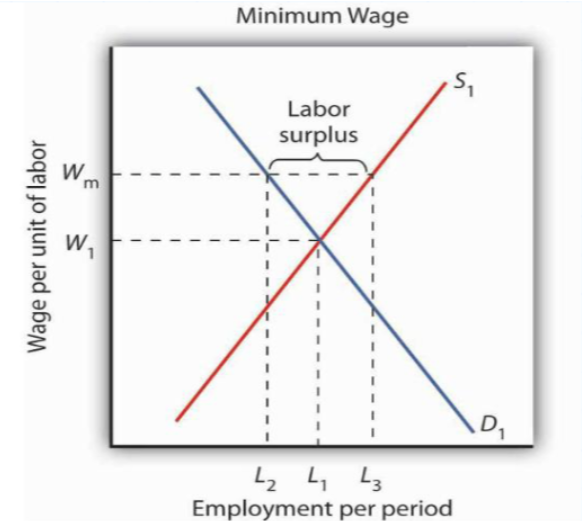
Wage control (minimum wage)
The government may respond to a decrease in labour demand (ex: decrease price of oil) or a decrease in labor supply (ex:immigration) by preventing wages from plunging. This typically leads to a minimum wage law (imposing a price floor set above the equilibrium wage, wm = w*.
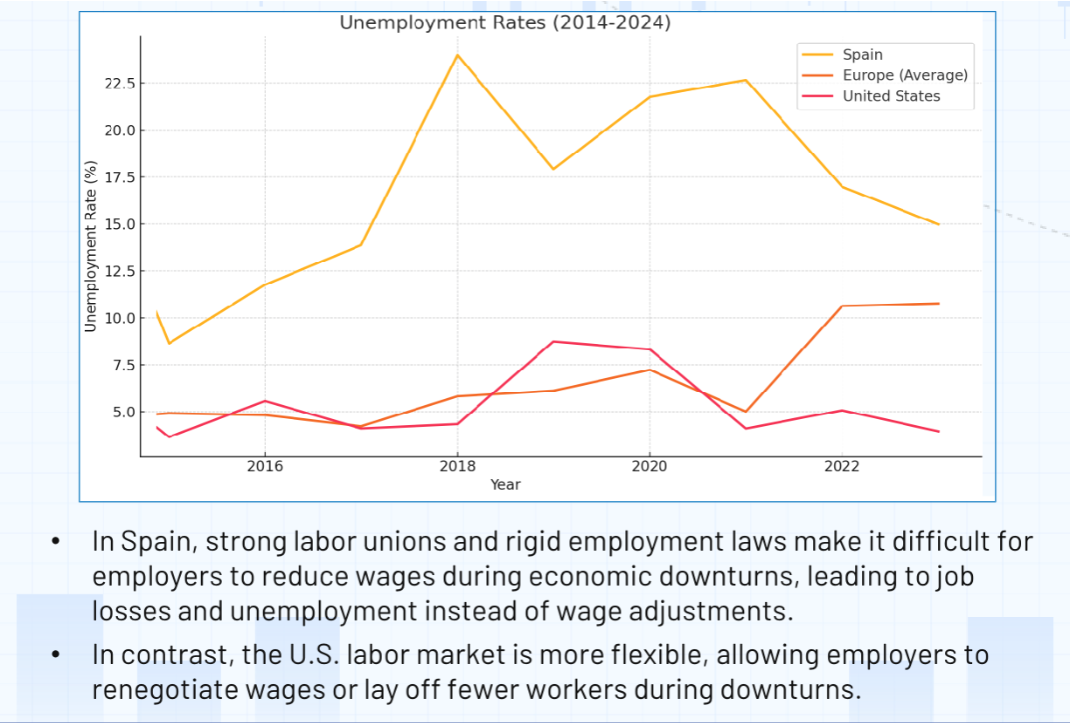
Wage rigidity
Wage rigidity refers to the resistance of wages to adjust (in particular downward) even in the face of economic conditions that would typically warrant such a decrease. This rigidity can be nominal, where wages are inflexible in monetary terms, or real, where wages are inflexible once adjusted for inflation.
Rigidity as a theory for unemployment
The sticky wage theory: economic hypothesis theorizing the pay of employed workers tends to have a slow response to the changes in the performance of a company or of the broader economy. Sources of wage rigidity:
Worker’s unionization and collective bargaining
Minimum wages laws
Labor contract long duration
Efficiency wages*
*Firms may pay wages the market clearing wage to ensure that employees work hard to avoid losing their jobs
Rate of unemployment ex
Overview
Aggregate of the population:
Working Age Population (WAP): all individuals aged 15 - 65, excluding active military and institutionalised persons
Labor Force (LF) or Active population: Employed (E) + Unemployed (U) (actively seeking work)
Working Age Population not in the labor force: discourage workers, students, retirees, and homemakers…
Indicators:
Employment Rate (Er): E/WAP x 100
Unemployment rate (Ur): U/LF x 100
Labor Force Participation Rate (LFPR): LF/WAP x 100
Data Source: EU -LFS for tracking trends in employment, unemployment , and education’s impact
Overview unemployment
Macroeconomics classification:
Frictional: Temporary transitions, graduates seeking jobs.
Structural: Skill mismatches or geographical factors automation impact
Cyclical: Demand shortfall during recessions
Special types of ‘Unemployment’:
Seasonal: Tied to industries like tourism
Underemployment: Part- Time workers seeking full time roles.
Natural rate (NAIRU): (Frictional+structural) rate of unemployment
Economic Implications: Policies targeting structural and cyclical issues are crucial for stability
Overview labor markets
Supply and Demand of Labor:
Labor Supply: Upward sloping but can bend back due to income effects
Labor Demand: Downward sloping due to costs and substitutions
Equilibrium in Labor Markets:
Equilibrium balance wage(w*) and employment (L*)
Shifts due to technological changes, population shifts, or policy interventions.
Overview wage rigidity
Wage Rigidity:
Causes: Unions, minimum wages, and contracts
Consequences: Persistent unemployment during economic downturns