Macro Final Exam Review
1/144
There's no tags or description
Looks like no tags are added yet.
Name | Mastery | Learn | Test | Matching | Spaced |
|---|
No study sessions yet.
145 Terms
what are the major types of unemployment
what can we learn from unemployment data
types of unemployment
structural, frictional, cyclical
interpreting unemployment
ways to look at unemployment/shortcomings
unemployment
you are not called unemployed if you don’t have a job
1) not have a job
2) prove that you actively looked for a job in the last four weeks
when a worker who is not currently employed is searching for a job without success
U3
BLS
bureau of labor statistic measures unemployment
Unemployment rate (u)
the percentage of the labor force that is unemployed
unemployed/labor force * 100
structural unemployment
unemployment caused by changes in the industrial makeup of the economy
-arises due to structural changes in the economy
cause: creative destruction
ex: work in a video store and the store goes out of business and you are now unemployed
ex: decline in bookstore leading to job losses in the book sale industry
creative destruction
when the intro of new products and tech leads to the end of other industries and jobs
-sign of a healthy growing economy
ex: book sales
ways to reduce structural unemployment
-workers must retrain, reeducate, relocate, or change expectation abt work and pay
-the gov can help with training programs or relocation subsidies
Luddites
somebody who is actively against tech/someone who doesn’t know or learn how to use it
nineteenth-century english textile workers
-destroyed automated looms that could be operated cheaply to produce clothing
Goal- trying to protect themselves from structural unemployment
Question to think abt- the industrial revolution left many ppl structurally unemployed. What are the trade-offs of tech progress and structural unemployment?
frictional unemployment
unemployment caused by delays in matching available jobs and workers
(frictions in the hiring process- the process isn’t instantaneous)
-no matter how healthy the economy, there is always frictional unemployment
ex: recent college grads
Causes of frictional unemployment
info availability
-any factors that shorten job searches also decrease frictional unemployment
gov policies
-any factors that lengthen the job search process increase frictional unemployment
Cyclical Unemployment
unemployment caused by economic downturns
-causes greatest concern among policymakers and economists
Cause- an unhealthy economy
EX- unemployment due to covid
Natural Rate of Unemployment
Natural rate of unemployment: typical unemployment rate that occurs when the economy is growing normally
(insert screenshot from pp)
The natural rate of Unemployment and Full-Employment Output
Full employment output- output by an economy with no cyclical unemployment
(insert pic)
Population breakdown: Work-eligible population
civilian, non-institutionalized, and age 16 or older
Labor force
people who are employed or are actively seeking work
-accounts for just 25 percent of Americans
Unemployment rate (u)
the percentage of the labor force that is unemployed
Labor Force Participation Rate (LFPR)
The percentage of work-eligible population that is in the labor force
US unemployment rate and recessions (1970-2021)
There is always some unemployment, but when the economy is in a downturn (shaded area), cyclical unemployment increases
US labor force participation rate (1995-2021)
In the past two decades, the LFPR has decreased and is expected to keep doing so as baby boomers retire
Trends in the US Labor force participation (1950-2020)
Since 1950 the proportion of men in the labor force has steadily declined, and the LFPR of women, despite significantly increasing since 1950, has also decreased in the past decade
Shortcomings of using the Unemployment Rate
1) it can be too narrow
2) it doesn’t reveal who is unemployed
3) It is a lagging indicator
Unemployment rate can be too narrow
those who are not working, have looked for a job in the past 12 months and are willing work, but have not sought employment in the past four weeks
-referred to as a marginally attached workers
-EX: PhD student bagging groceries
underemployed workers: those who have part-time jobs but would prefer to work full time
-EX: person who works in the mornings but would like to work all day
A broader measure of US labor market problems (2000-2021)
In recessions, more people become discouraged and underemployed, increasing the gap between U-3 (officially unemployed) and U-6 (employed + discouraged and underemployed workers
Does not reveal who is unemployed
Lagging indicator
usually changes AFTER the economy as a whole changes so it doesn’t have much predictive power
EX: average duration of unemployment
EX: change in the price index
leading indicator
helps us predict what’s coming and will usually change BEFORE the economy as a whole does
EX: average weekly hours for manufacturing
EX: building permits
Unemployment rate Conclusions
monitoring as an indicator of macroeconomic health
-helps us gauge labor market conditions
-can be misleading and incompletely, since it lags behind economic activity and doesn’t account for unemployment and discouraged workers
-includes different types of unemployment, some worse than others
-Can be influenced by government policy. This seems to have played a big part in propping up rates in the aftermath of the 2008 recession
time deposit
(fixed deposits/certificates of deposit) locking a saving in for a certain amount of time. (can’t withdraw the money for a certain amount of time) (more time=more interest)
market
interest rates
equilibrium
supply
income and wealth
time preferences
consumption smoothing
demand
productivity of capital
investor confidence
gov borrowing
Loanable Funds Market
The market where savers supply funds for loans to borrowers
Includes places such as:
- stock exchange
-Investment banks
-mutual fund firms
-commercial banks

What do firms need to borrow?
-Most businesses cannot fund capital and other investment purchases with cash alone
-without the loanable funds market, much investment would be impossible and production and GDP would falter

Where do firms get their funds from?
every dollar borrowed requires a dollar saved
lenders can’t lend money they don’t have
Savings provides funds for lenders to lend

_____________________________________________
Ch 6 summary
Loanable funds markets channel funds from savers to borrowers.
Supply of loanable funds: household savings
•Suppliers provide the funds for firms to expand through investment.
Demand for loanable funds: firms borrowing to invest
Equilibrium in this market determines the level of savings, investment, and interest rates.
Savings → Borrowing → Investment → Growth
Financial Markets and Securities
Financial Markets
• Financial intermediaries
• Direct and indirect
financing
Financial Tools
• Bonds
• Stocks
• Treasury securities
• Home mortgages
Financial Intermediaries
• Borrowers and lenders come together in financial markets.
• Financial intermediaries are firms that help to channel funds
from savers to borrowers.
• Example: banks
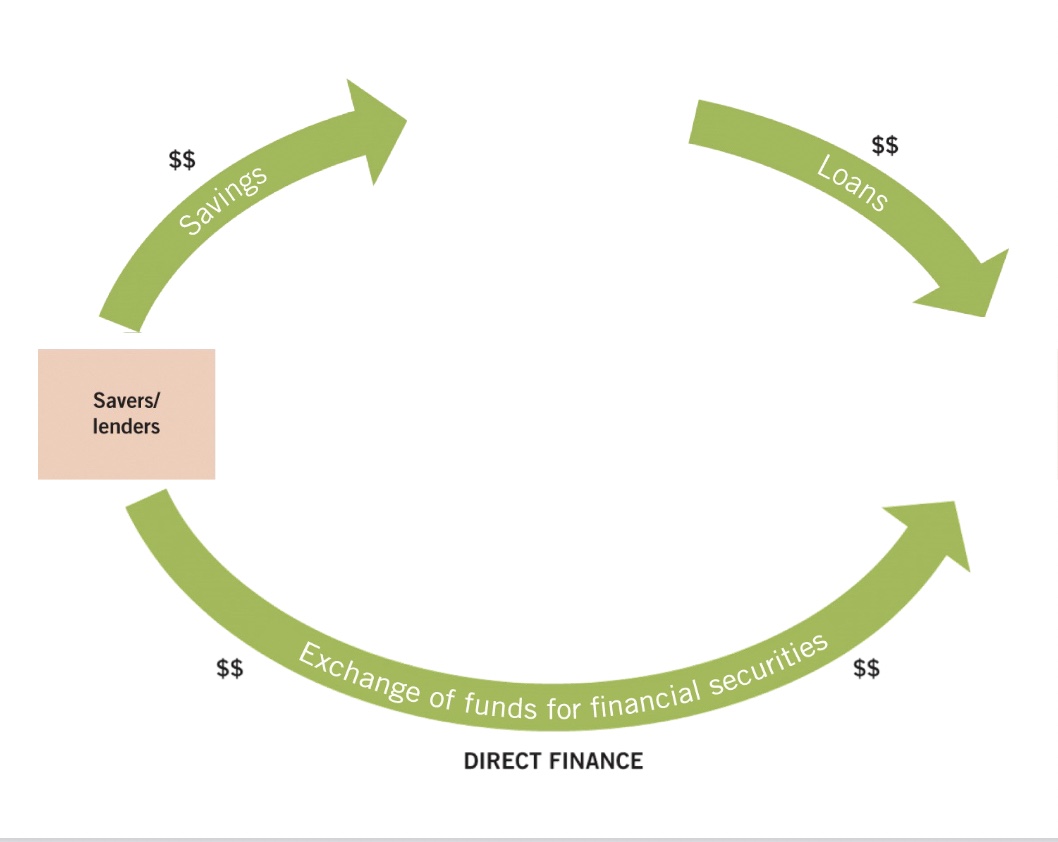
Direct Finance
• When borrowers go directly to savers for
funds
• Firms sell a security (stock or bond)
directly to the public in exchange for funds
Indirect Finance
• When savers lend funds to financial
intermediaries, which then loan these funds
to borrowers
Direct vs indirect finance
Financial Tools
Tools used in financial markets:
• Bonds
• Stocks
• Treasury securities
• Home mortgages
• Private-sector securities
Bonds
a formal IOU, a contract specifying who owes how much and a date for payment.
Firms will issue bonds to the public in order to borrow money and use those funds for investment.
This is an example of direct finance.
What 3 important pieces of info do bonds contain
Bonds contain three important pieces of information:
1. The name of the borrower
2. The repayment date
• This is also known as the maturity date.
3. The amount due at repayment
• Also referred to as the face value or par value
• It is the bond’s value at maturity.
Interest Rates
Bond prices are generally quoted in interest rates.
The interest rate on a bond is the growth rate of the
original funds invested.
• Bond buyers (savers) want the highest interest rates
(greatest return on their money).
• Bond sellers (borrowers) want the lowest interest rates
(lowest cost for borrowing money).
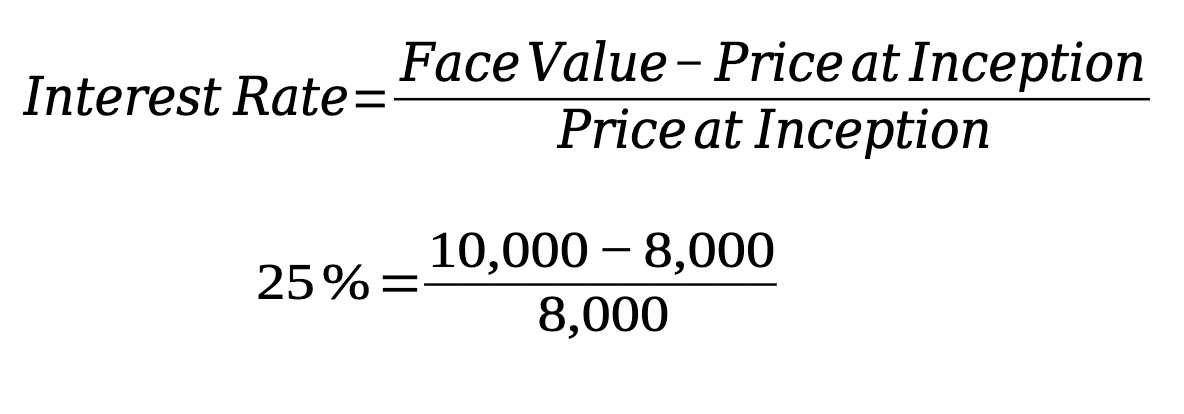
Interest rates formula example
if you buy a bond for $8,000 and one year later, it is worth
$10,000, the interest rate is 25%.
𝐼𝑛𝑡𝑒𝑟𝑒𝑠𝑡 𝑅𝑎𝑡𝑒=
𝐹𝑎𝑐𝑒 𝑉𝑎𝑙𝑢𝑒 − 𝑃𝑟𝑖𝑐𝑒 𝑎𝑡 𝐼𝑛𝑐𝑒𝑝𝑡𝑖𝑜𝑛
𝑃𝑟𝑖𝑐𝑒 𝑎𝑡 𝐼𝑛𝑐𝑒𝑝𝑡𝑖𝑜𝑛
25 % = 10,000 − 8,000
8,000
Bond Principles
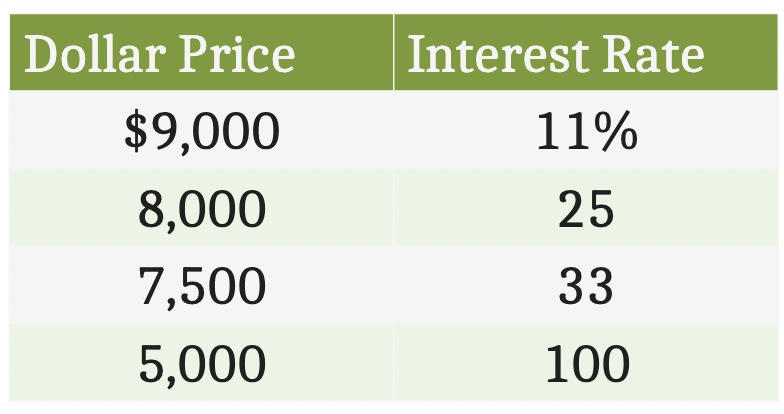
The dollar price of a bond determines its interest rate (and vice versa).
The dollar price and the interest rate have a negative relationship.
Example: Consider that a $10,000 bond is being offered.
-Inverse relationship between the price at which u buy the bond and interest rate of the bond
Default risk
Default risk is the risk that the borrower will not pay the face value of a bond on the maturity date.
The greater the risk of default, the lower the price (and higher the interest rate) of the bond.
Bond interest rates rise with default risk.Two possible outcomes for the bond:
• The borrower pays maturity value of the bond to lender.
• The borrower defaults on the loan (lender gets $0 back).
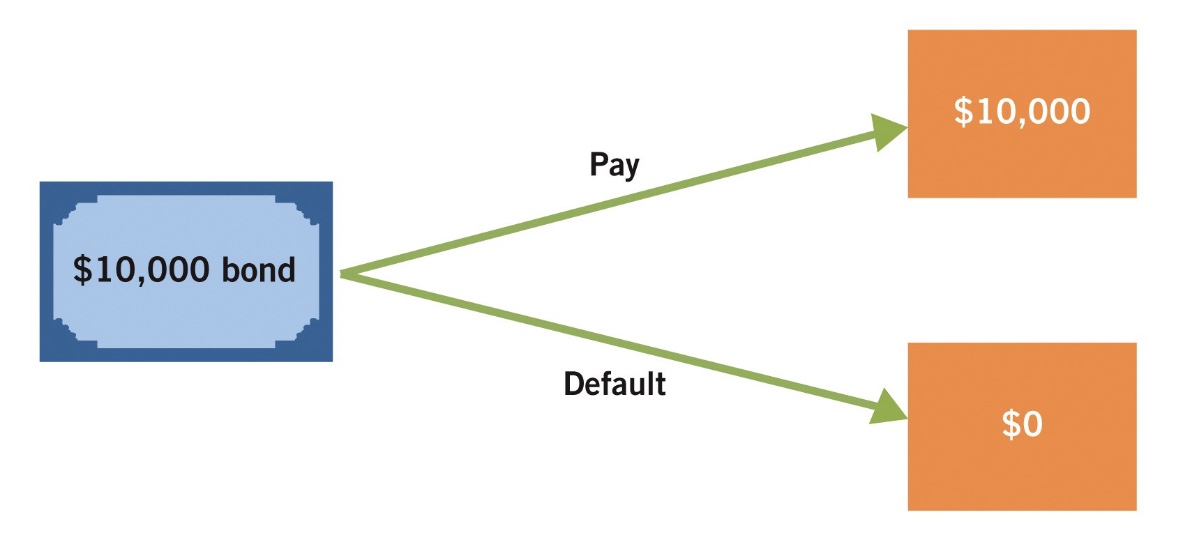
Bond ratings and default risk
Default risk is very important for bondholders, but it is very difficult for typical consumers to judge the risk of default or even one firm.
Rating agencies
evaluate the default risk of all borrowing entities and give a grade showing the likelihood of defaulting.
Examples:
• Moody’s
• Standard and Poor’s (S&P)
• Fitch
Price falls when bonds are downgraded
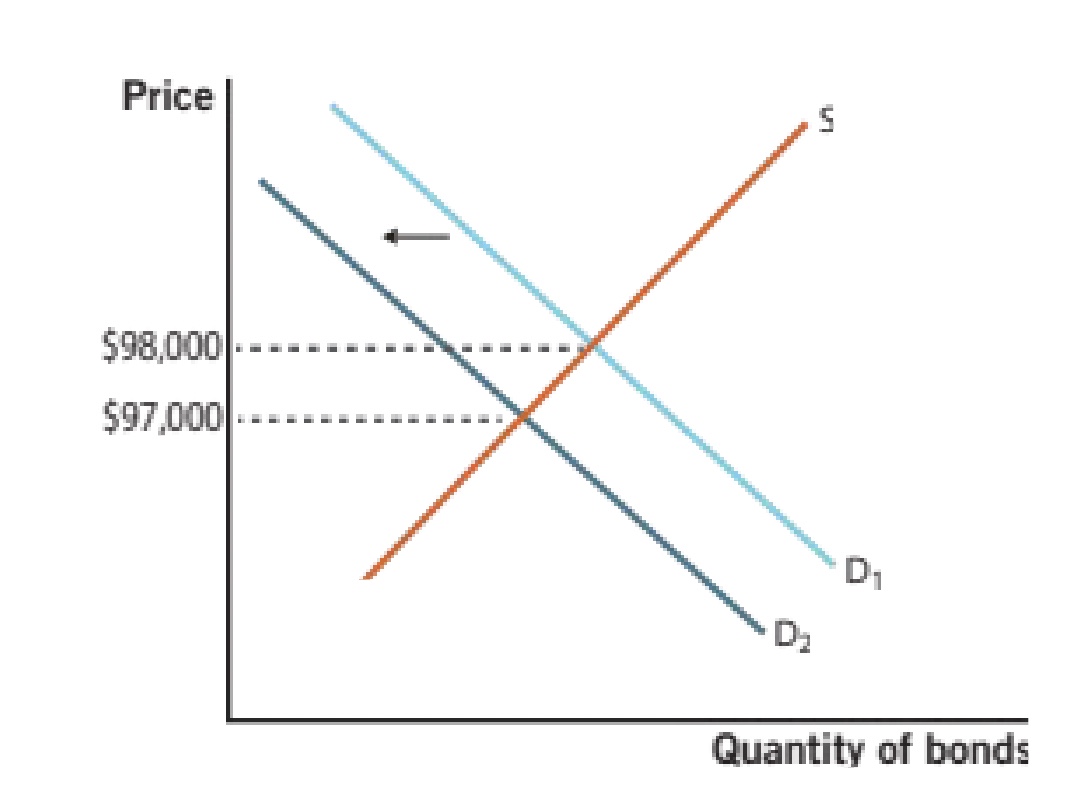
Stocks
In addition to issuing debt through bonds, firms can also sell part of their ownership.
Stocks are ownership shares in a firm.
• Shareholders have some influence in the operations of the firm.
Firms might prefer to sell part of their ownership because they can sell shares and move forward without the burden of debt from having to pay back a bond in the future.
Secondary Markets
are markets in which securities are traded after their first sale.
They are important because they enable firms to sell bonds at higher prices (lower interest rates) since demand for assets increases when they can be resold.
Stock markets are secondary markets.
• New York Stock Exchange (NYSE)
• National Association of Securities Dealers Automated
Quotations (NASDAQ)
Secondary Markets Make Securities More Valuable
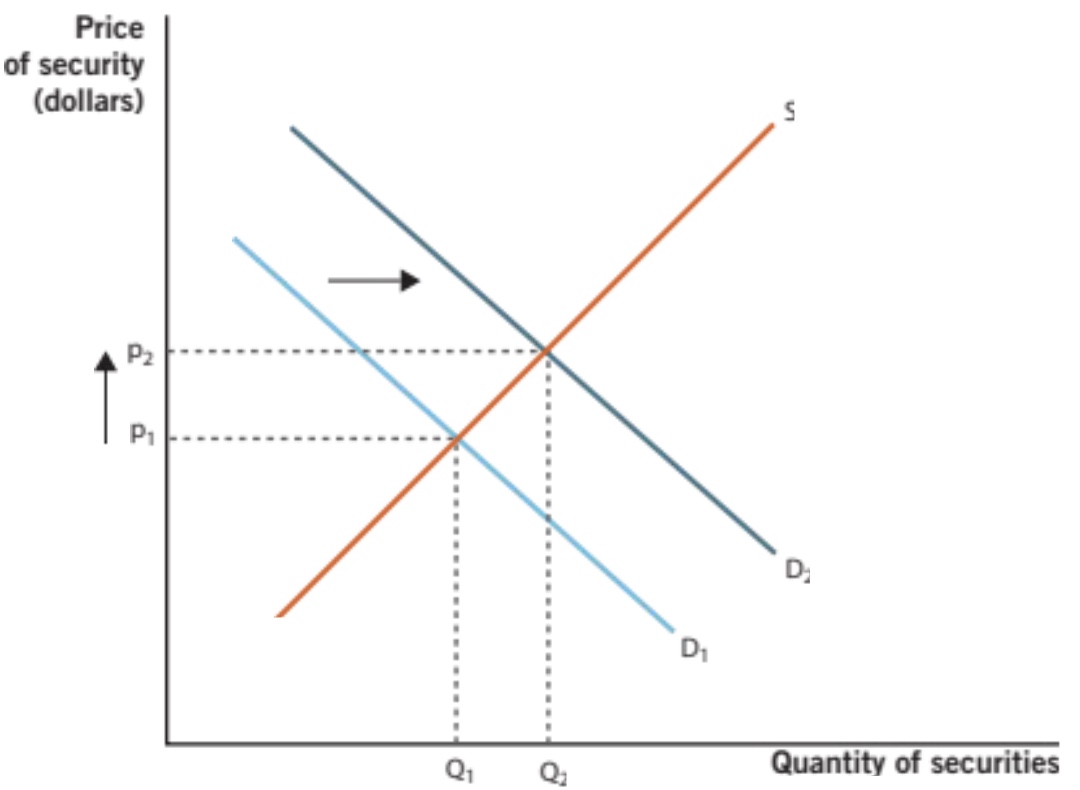
Treasury Securities
• Treasury securities are the bonds sold by the U.S. government to pay for the national debt.
• The interest rate is determined by auctions.
• Low risk
• Active secondary market
when the interest rate rises ppl who put their money into bonds loose out bc they could have put the same amount of money into the savings and earned a 5 percent return. People then sell the bond for a price much lower than they bought it for.
However, if the interest rate decreases to 1% in savings your 3% bond will have a higher value and you can sell it for more money.
Major US Treasury Security Holds, 2021
Of the $30 trillion of U.S. government debt in 2021,
foreigners held approximately ____%.
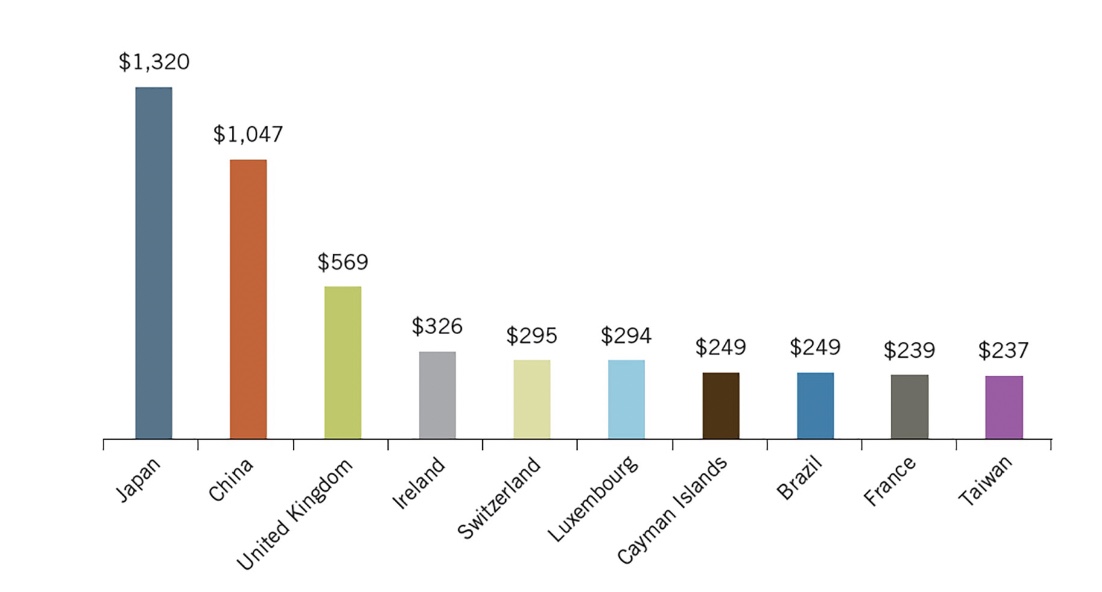
Mortgages
• Mortgages are loans that individuals
use to pay for homes.
• Becoming increasingly important
tools as more and more people are
owning homes
U.S. Home mortgage market (1990-2021)
The market declined for a time after the 2008 recession but
then recovered and resumed its upward climb.
Securitization
Securitization is the creation of a new security by combining
otherwise separate loan agreements.
Example: Mortgage-backed securities are combinations,
or bundles, of mortgages.
Benefits borrowers because interest rates are lowered which
increases investment opportunities
Helps lenders because it offers new opportunities
Example: Anyone in the world can buy securities tied to
the U.S. mortgage market.
New security is a bundle of other loans
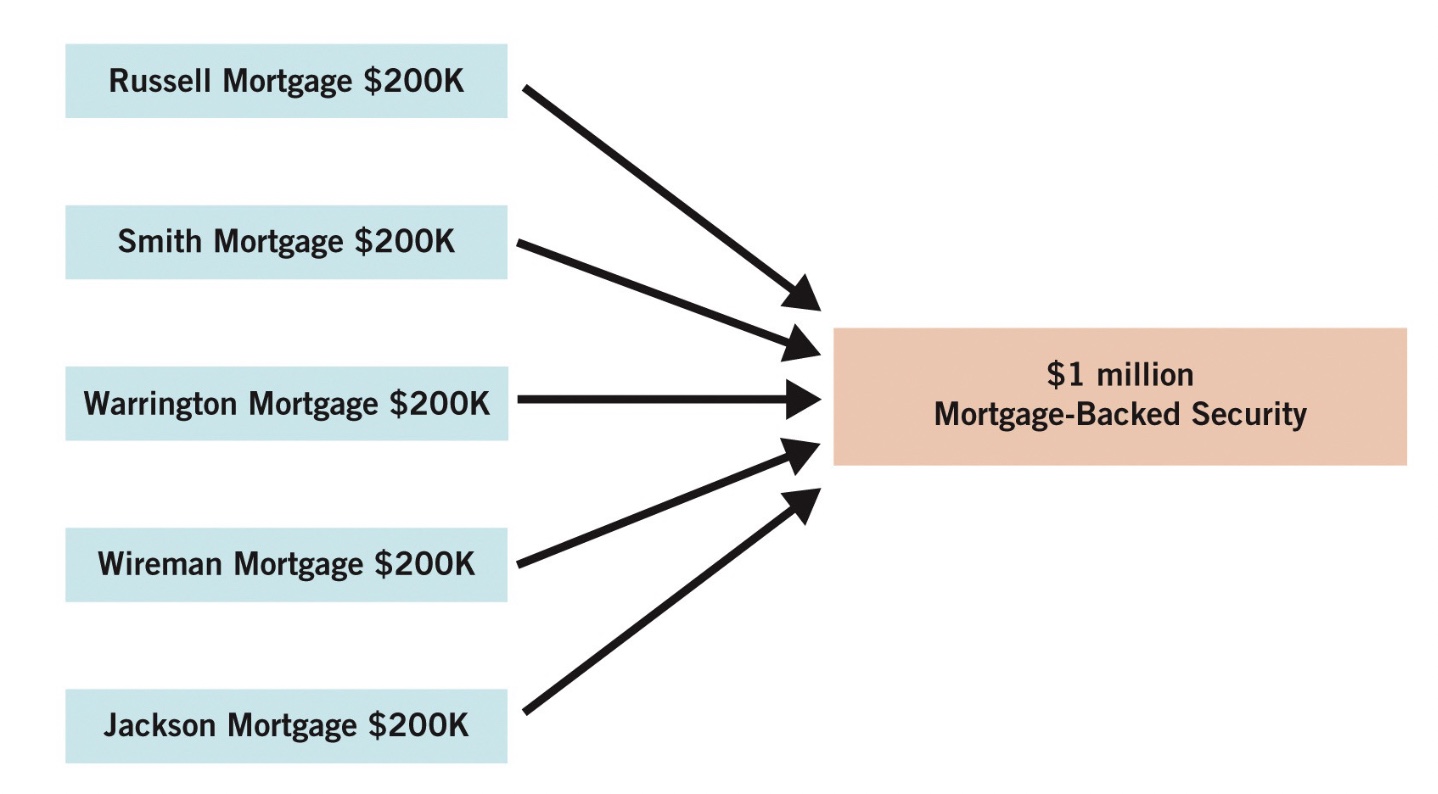
conclusion
• Indirect finance is when savers and lenders utilize banks
in the market for loans.
• Direct finance is when borrowers go directly to lenders
(stock or bond purchases).
• Bonds are loan contracts that are typically traded in
secondary markets.
• Stocks are ownership shares in firms.
• U.S. Treasury securities are the bonds used by the
federal government to finance the national debt.
• Mortgages are loans that people use to pay for homes.
Chapter 7 big questions
1. What is the aggregate demand–aggregate supply
model?
2. What is aggregate demand?
3. What is aggregate supply?
4. How does the aggregate demand–aggregate supply
model help us understand the economy?
Aggregate Demand
Consumption
Investment
Gov spending
Net exports
LR aggregate supply
resources
tech
institutions
long run= anything greater than a decade
SR aggregate supply
(dependent on inflation)
sticky input prices
Menu Costs
Money illusion
short run=anything under a decade
any period of time when at least one factor of production is in limited supply
What are the two paths of study in macro
1. Long-run growth and development
2. Short-run fluctuations, or business cycles
Long run growth and development
focuses on theories and policies that affect economies over several decades
Short run fluctuations or business cycles
Focuses on time horizons of five years or less
U.S. Real GDP and Tecessions, 1990–2021
GDP growth is typically positive during economic
expansions, and negative during recessions.
U.S. Unemployment Rates, 1990–2021
In recessions unemployment rises, while in
expansions unemployment falls.
Aggregate Demand and Aggregate Supply Model
• Model used to study business cycles.
• Built on demand and supply model.
• Considers demand and supply for all final goods in
an economy.
• Aggregate = total.
Aggregate Demand
Aggregate demand: The total demand for final
goods and services in an economy.
It is the sum of spending in the economy.
where:
• Consumption is C
• Investment is I
• Government spending is G
• Net exports is NX
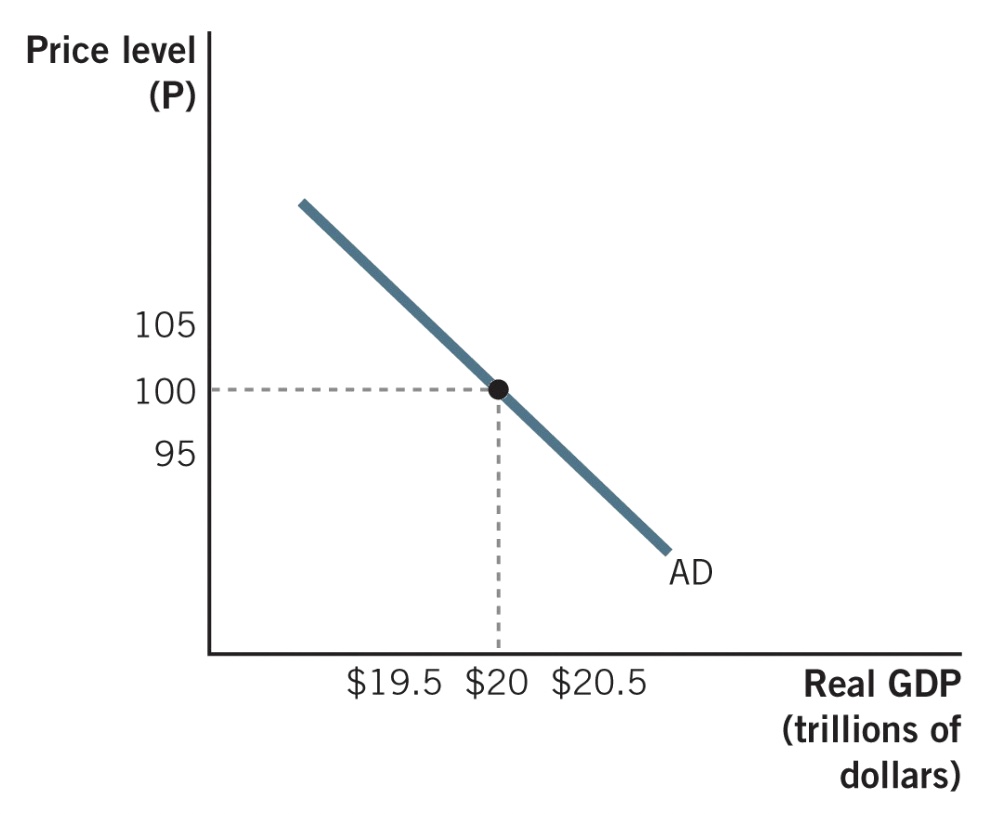
Aggregate Demand
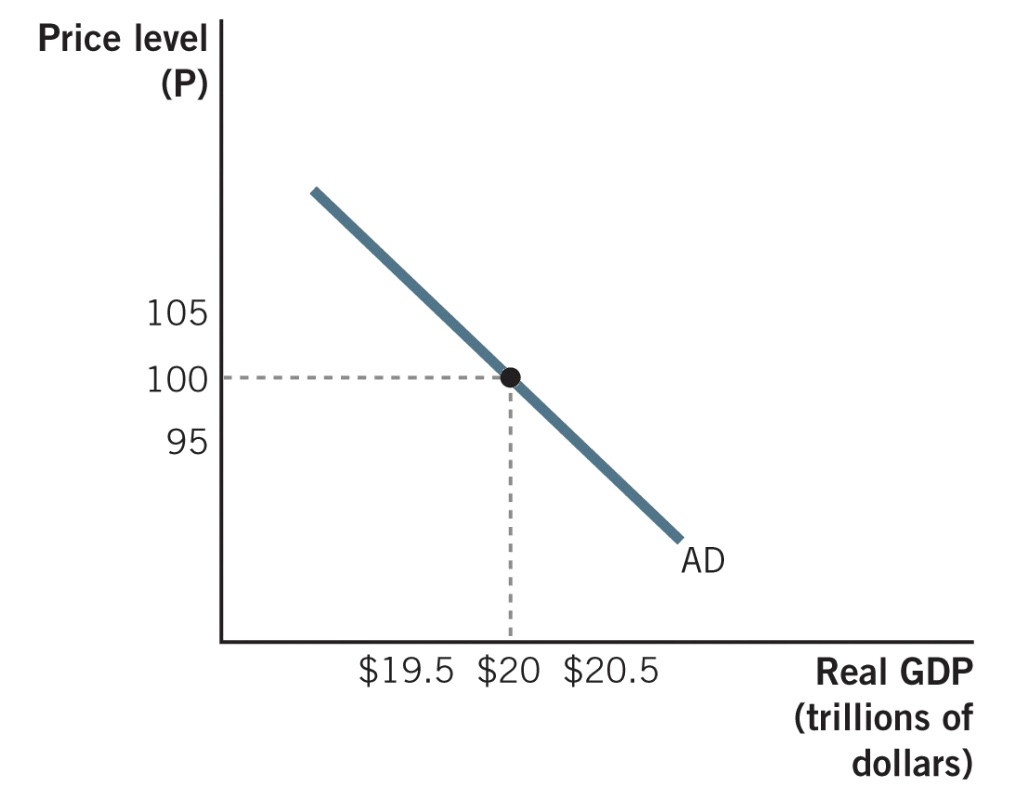
Slope of the AD curve
the three reasons for the neg relationship between qty of aggregate demand and price level are:
1) the wealth effect
2) the interest rate effect
3) the international trade effect
Wealth Effect
The change in the quantity of aggregate
demand that results from wealth changes due to price-level
changes.
Wealth
The net value of one’s accumulated assets.
This effect is related to consumption.
Example: If real estate prices drop, people that have stored
their wealth in the form of homes will consume less.
Interest Rate Effect
Occurs when a change in the price level
leads to a change in interest rates and therefore in the
quantity of aggregate demand.
This occurs through the loanable funds market.
• Changes in the price level affect saving.
• This directly impacts the supply of loanable funds.
Example: If price levels rise, people will save less which will
increase interest rates. This will decrease investment.
international trade effect
Occurs when
a change in the price level leads to a
change in the quantity of net exports
demanded.
Happens due to changes in relative
price levels.
Example: If Japanese goods are cheaper
relative to U.S. goods, more people will
demand Japanese goods.
Slope of the Aggregate Demand Curve
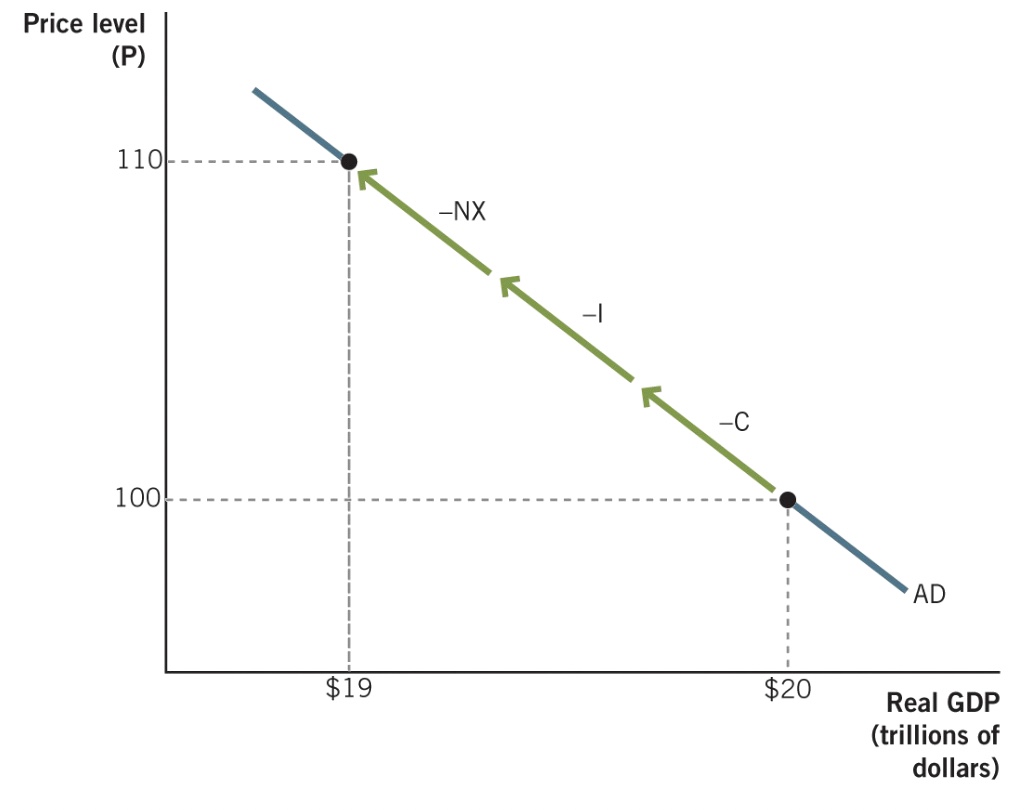
Shift factors in aggregate demand
When people’s demand for goods
and services at all price levels
changes, AD will shift.
The main categories are:
• Consumption
• Investment
• Government Spending
• Net Exports
Consumption
Consumption spending accounts for about 70% of all
spending in GDP. Consumption is influenced by:
1. Changes in real wealth
• Stock market rises or falls
• Widespread change in real estate values
2. General expectations about the future
• Changes in expected income
• Change in consumer confidence
3. Changes in taxes
Investment
Investment shifts when decision-makers at firms decide to
increase or decrease spending on capital goods.
1. Investor confidence
• As investor confidence rises, so does investment.
2. Interest rates
• At lower interest rates, investment increases.
3. Quantity of money in the economy
• More money will lead to lower interest rates, which
will increase investment.
Gov Spending
Factor influenced most directly by policymakers.
These changes may be made in response to economic
conditions.
Example: If people become more pessimistic about the
future, the government might decide to spend on roads and
highways to offset the decrease in consumption and
investment.
Net exports
Net exports shift in response to changes in foreign income
and the value of the U.S. dollar.
As income in other nations rises, their demand for U.S. goods
increases.
• As nations become wealthier, net exports increase.
When the value of the dollar increases, people in the U.S. can
buy more foreign goods but people outside of the U.S. can
buy less U.S. goods. So, net exports decrease.
• A stronger dollar leads to a decline in net exports.
Shift factors in aggregate demand supply
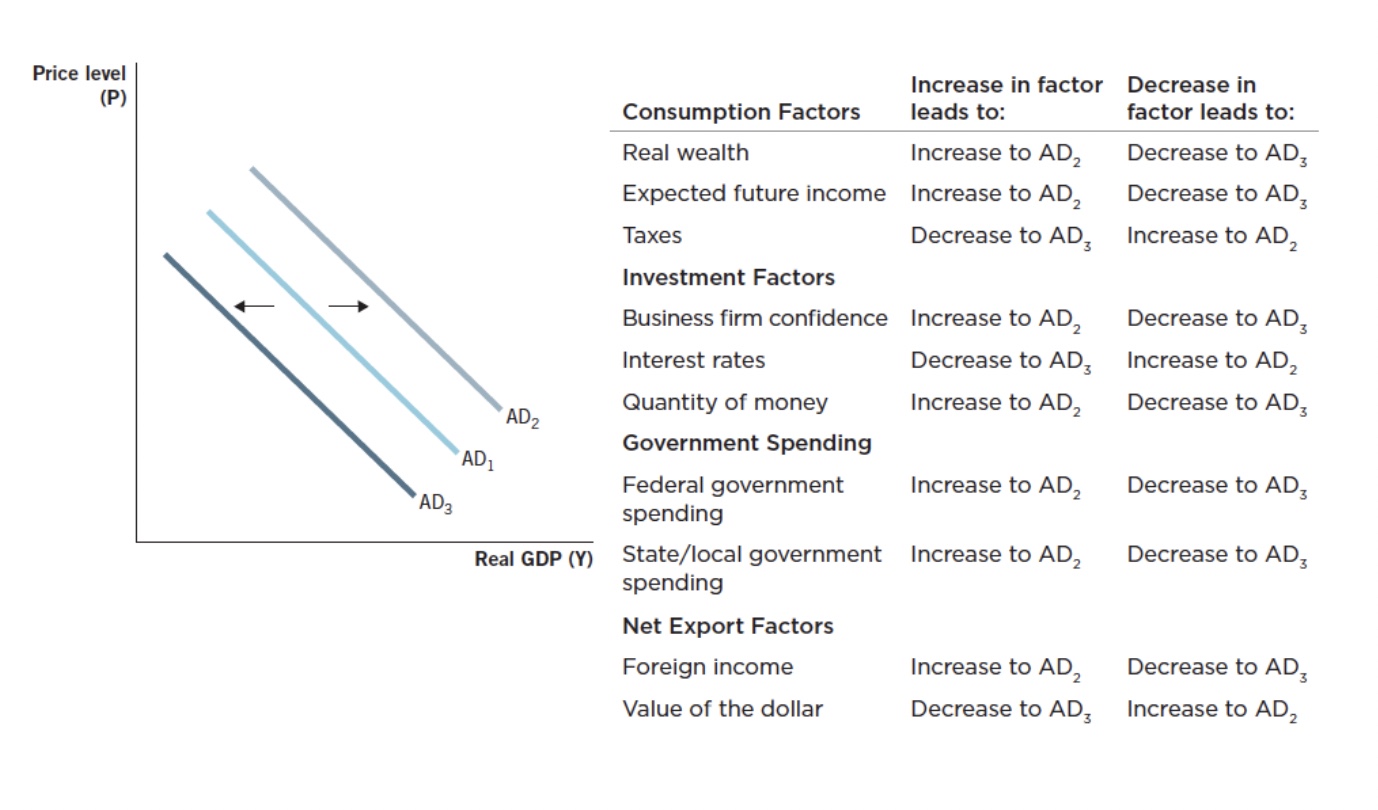
Movement along the AD curve
• Start with a change in the
price level.
• Affect the quantity of
aggregate demand through
the three effects.
• Examples: Wealth effect,
interest rate effect,
international trade effect.
Shifts in the AD curve
• Occur when something other
than the price level changes.
• Examples: Changes in real
wealth, businesses
confidence, value of the
dollar.
function of a firm
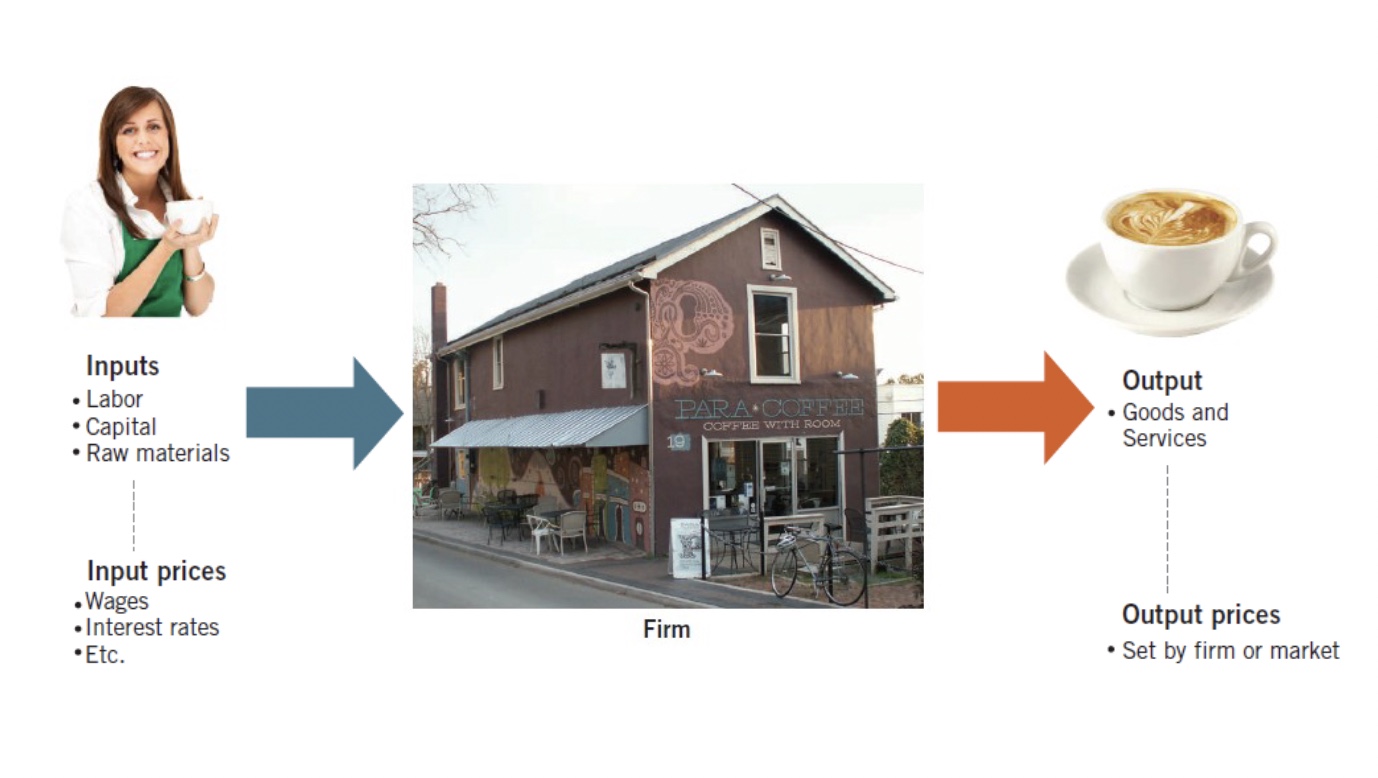
Aggregate Supply
• How do changes in the price
level affect the supply
decisions of the firm?
• It depends.
• Economists use two different
time horizons:
1.Long-run
2.Short-run
Long Run
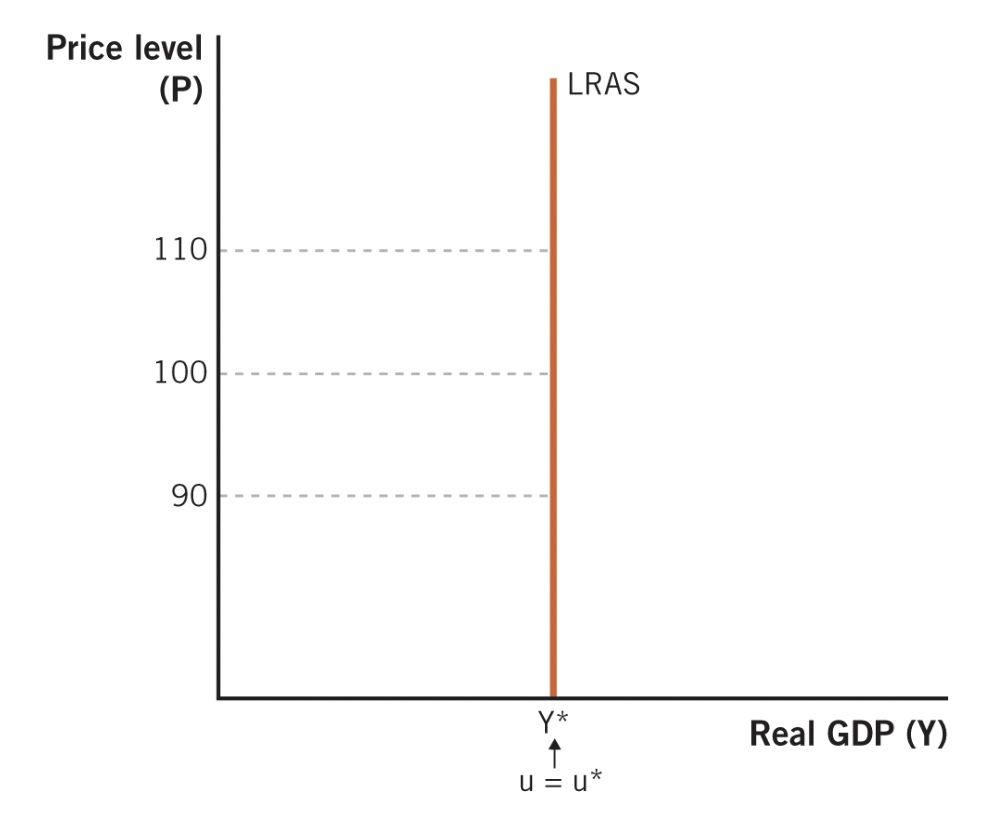
A period of time sufficient for all prices to adjust
The level of output produced when an economy is at the natural rate of unemployment
It depends on an economy’s resources, tech, and institutions
Vertical line:
• Not affected by changes in price.
• An economy’s ability to produce is the same regardless
of how much paper money is present.
Long Run aggregate supply
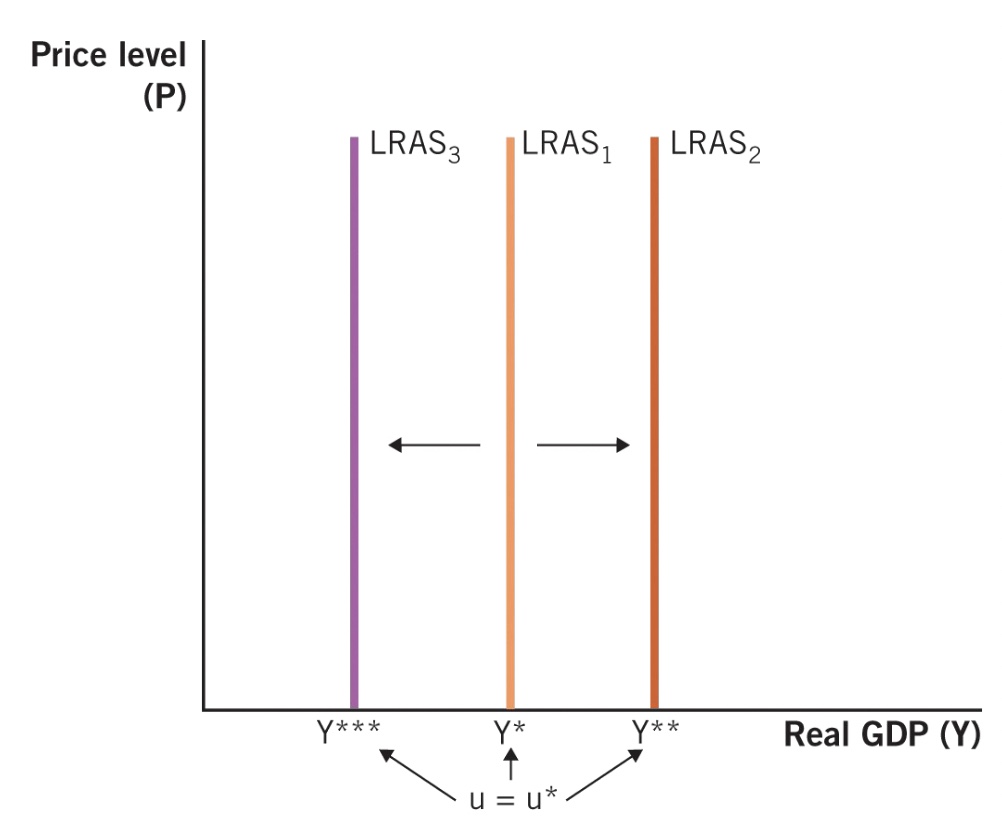
Shifts in Long-Run Aggregate Supply
• LRAS changes when a nation’s ability to produce output
changes.
• This occurs with changes in:
1.Resources
3.Institutions
Shifts in LRAS
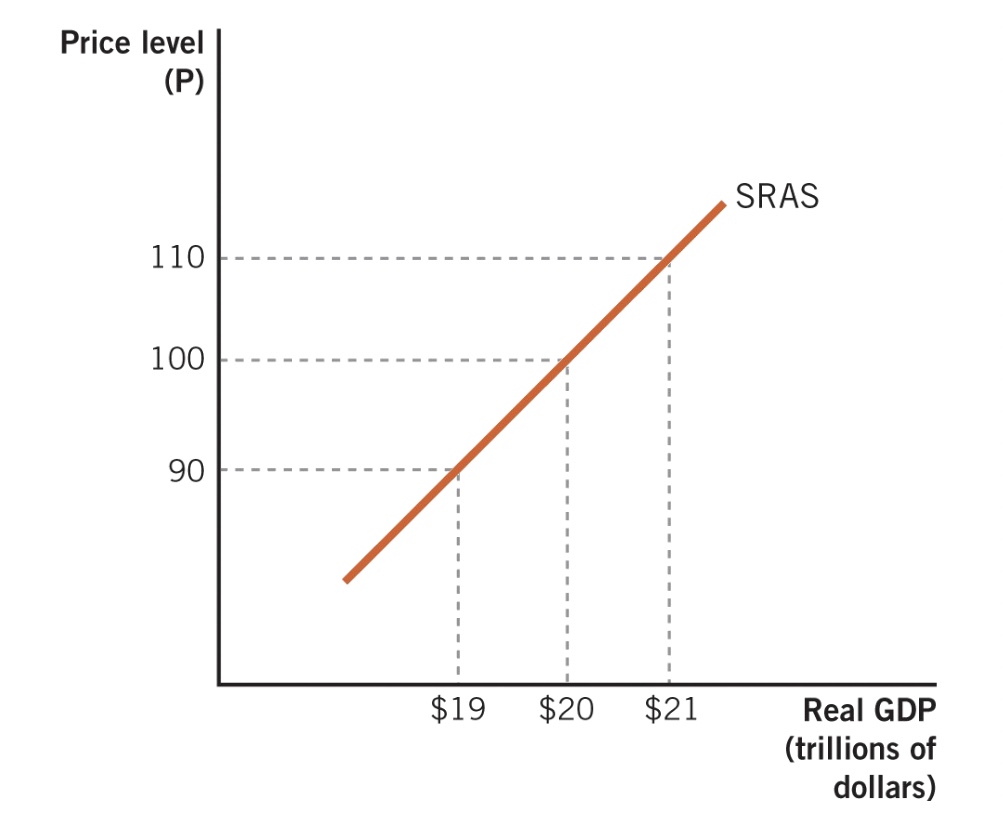
Short run
The period of time in which some prices have not
yet adjusted.
There are three reasons why there is a positive relationship
between the price level and the quantity of aggregate supply:
• Sticky input prices
• Menu costs
• Money illusion
Short Run AS Curve
