2. Review of Descriptive Statistics
1/21
Earn XP
Description and Tags
Lecture 1
Name | Mastery | Learn | Test | Matching | Spaced |
|---|
No study sessions yet.
22 Terms
What is operationalization in psychological research?
Defining a variable/construct in terms of how it will be measured (e.g., stress → Perceived Stress Scale).
Used in psychometrics (measuring constructs)
No operationalization is perfect, always has limits
What are the four levels of measurement?
Nominal: categories, no order (e.g., gender, color)
Ordinal: ordered, but intervals not equal (e.g., rankings)
Interval: ordered, equal spacing, no true zero (e.g., Celsius)
Ratio: ordered, equal spacing, true zero (e.g., weight, time)
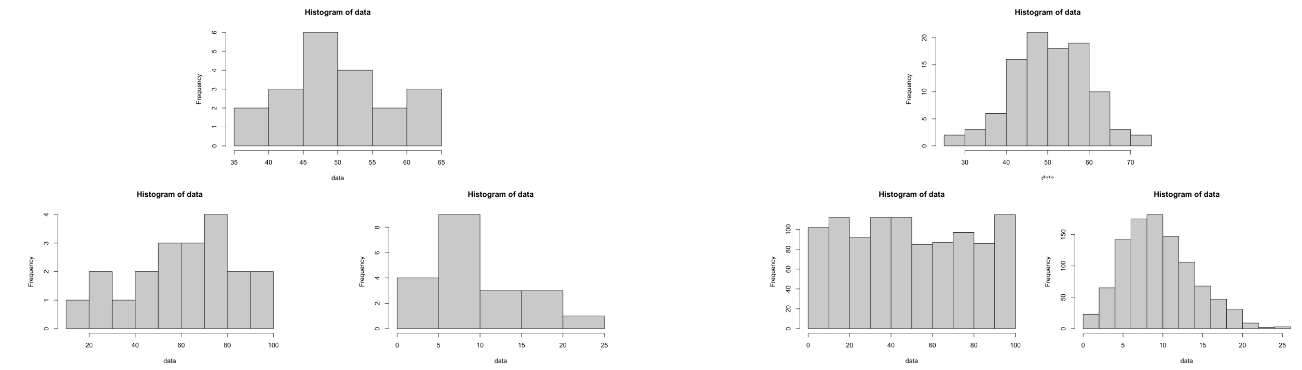
How does sample size affect the clarity of data distribution?
Large samples show clearer underlying distribution; small samples make it less obvious.
What are measures of central tendency and variability?
Central tendency: “sameness” (mean, median, mode)
Variability: “differentness” (range, variance, SD)
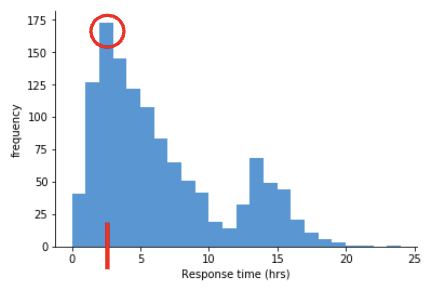
What is the mode?
Most frequently occurring value in a dataset; appears as a peak in a histogram.
What is the median and how is it calculated?
Middle value of an ordered dataset.
If n odd → middle number
If n even → average of two middle numbers
Formula: (n+1)/2 for location
What is the mean and how is it calculated?
Arithmetic average = (sum of values) ÷ (number of values)
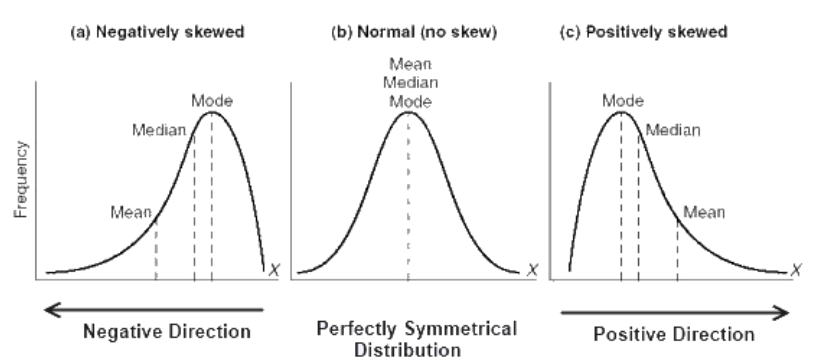
How does skew affect mean, median, and mode?
In skewed distributions, mean is pulled toward the skew, median is more stable, and mode reflects the peak.
What is the range and what is its weakness?
Range = max – min. Very sensitive to extreme values (outliers).
The range is a better indicator of variation for Array A, because in Array B the range is distorted by outliers relative to the actual clustering.
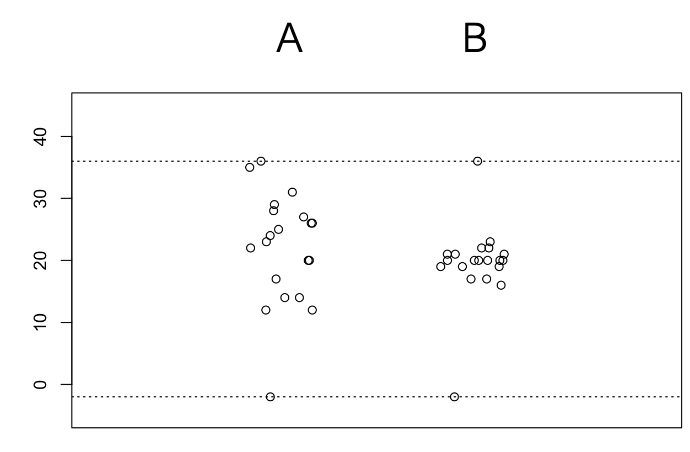
What does IQR measure?
Range of the middle 50% of the data (Q3 – Q1).
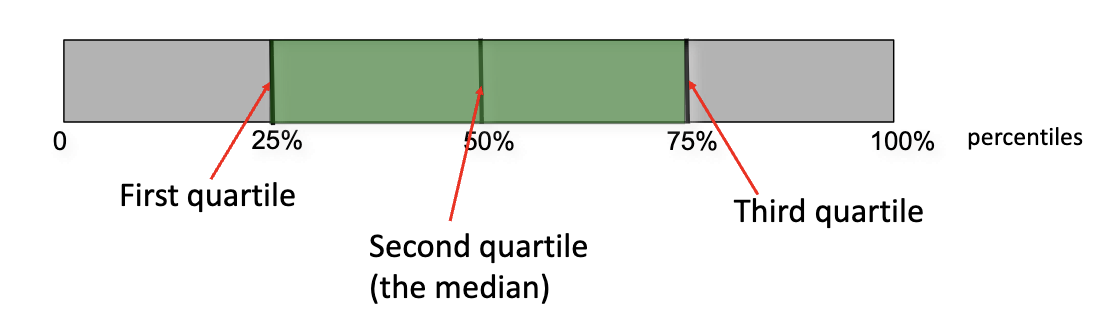
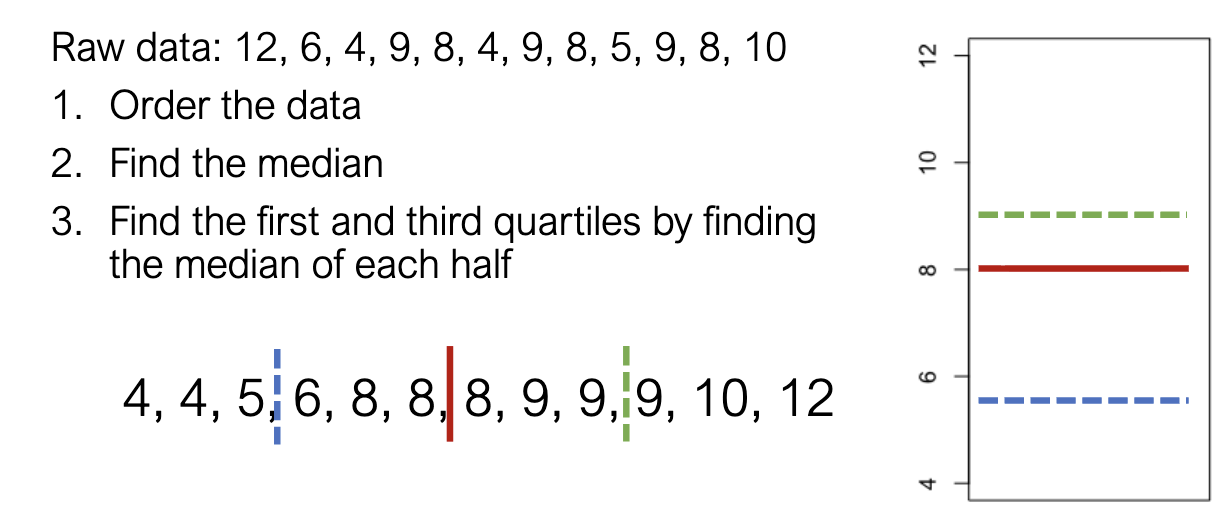
How do you calculate IQR step by step?
Order data
Find median
Find Q1 (median of lower half) & Q3 (median of upper half)
IQR = Q3 – Q1
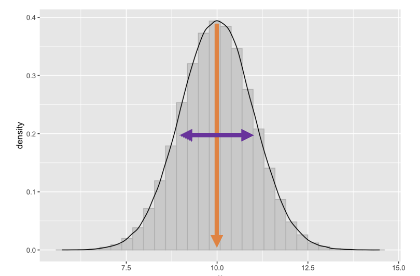
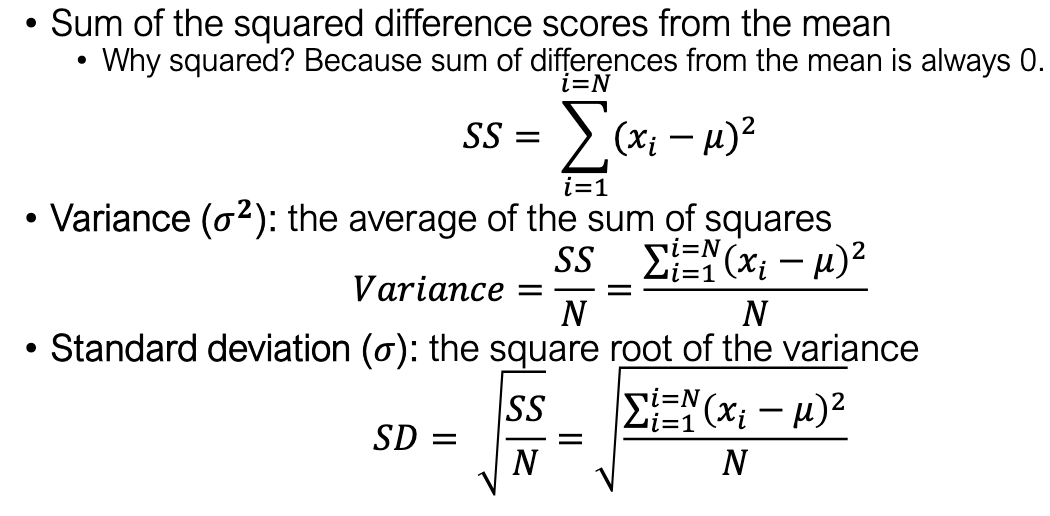
What are variance and standard deviation?
Variance = average of squared deviations from mean
SD = square root of variance
Use squared differences so they don’t cancel out (since sum of deviations = 0)
What is a Z-score and why use it?
Standardized score = (value – mean) / SD.
Allows comparison across different scales/units
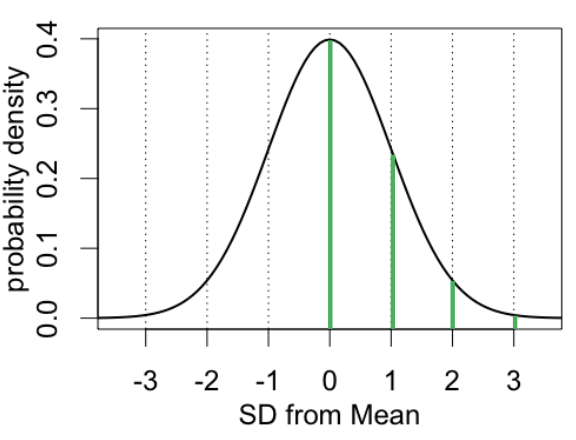
Why is standardization powerful for normal data? (AUC = 1)
Lets us calculate probabilities for scores:
0 SD = 50%
1 SD = 15.9%
2 SD = 2.3%
3 SD = 0.1%
How are descriptive and inferential statistics connected?
Inferential stats build on descriptive stats to make conclusions about populations.
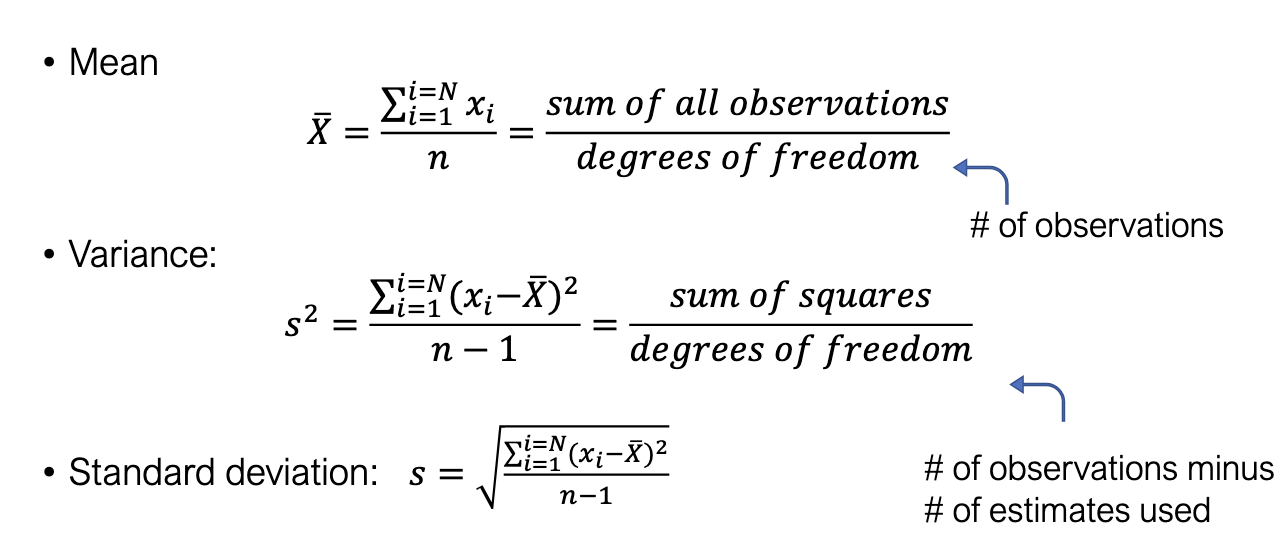
Why do we use n–1 (degrees of freedom) for sample variance?
Because sample mean is an estimate, using n–1 corrects bias when estimating population variance.
What are degrees of freedom (df)?
The number of pieces of information that are free to vary when making an estimate.
Example: With 50 observations, estimating the mean has 50 df (all values are free).
When estimating standard deviation, you first need the mean, so you lose 1 df → 49 df.
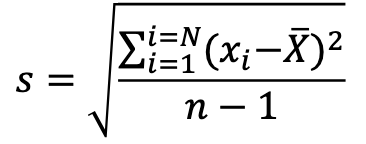
What are the equations for sample mean, variance, and SD?
Mean = Σx / n
Variance = Σ(x–mean)² / (n–1)
SD = √variance
What happens if you use wrong df or small sample size?
Variance will be underestimated. Solution: increase sample size.
What does the CLT state?
Distribution of sample means approximates normal when sample size is large, regardless of population distribution.
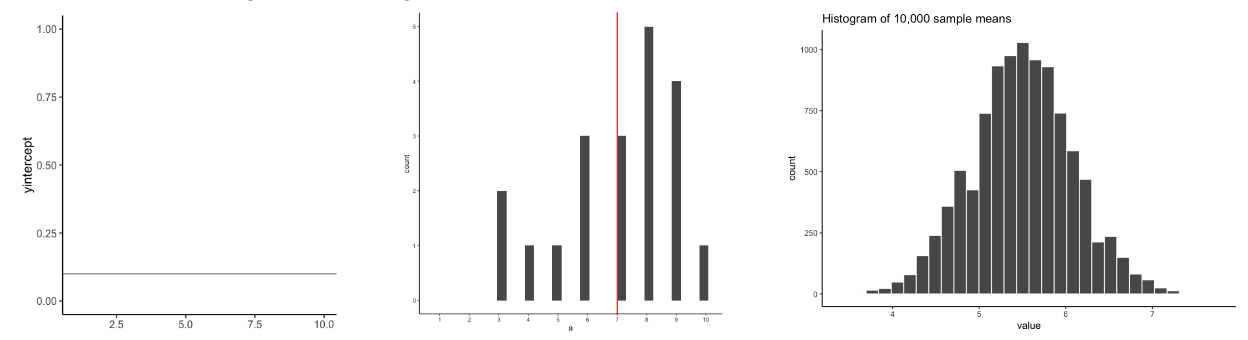
What are the properties of the sampling distribution (CLT)?
Same mean as population
Smaller SD as sample size increases (SE decreases)
Shape approaches normal with larger n
How do we assess if a sample represents the population?
Check normality (e.g., Q-Q plots). CLT makes normality assumption less strict with large samples.