Important Ideas from AP Statistics Unit 1
1/51
There's no tags or description
Looks like no tags are added yet.
Name | Mastery | Learn | Test | Matching | Spaced |
|---|
No study sessions yet.
52 Terms
Define Quantitative Variable
Takes numerical values for a measured or counted quantity
Define Categorical Variable
Takes on values that are category names or group labels
Name the two types of variables (2)
1) Quantitative
2) Categorical
Br graphs show ____ (how many) or ______ (percent)
frequency; relative frequency
Formula for marginal %
B/C
Formula for joint %
A/C
Formula for conditional %
A/B
Describe Misleading Graphs (3)
1) Vertical axis must start at 0
2) Axes must have a scale
3) Beware of using images for bar graphs (called a pictograph)
Define Segmented Bar Graph
stack bars to make 100%
Define Mosaic Plot
Segmented bar graph where the width of the bars is proportional to the group size
Define Association (aka Correlation or Relationship)
If knowing the value of one variable helps us predict the other variable
When it says “Describe the distribution…” it means…
what data values you have and how they are spread out
When it says “Describe the distribution…” use…
CSOCS
What does CSOCS stand for?
C - Context
S - Shape
O - Outliers
C - Center
S - Spread
Describe C (first) from CSOCS
Context - what variable is being measured?
Describe S (first) from CSOCS
Shape - Right/left skew, symmetry, modes (peaks)
Describe O from CSOCS
Outliers - Unusual points (points far away from cluster)
Describe C (second) from CSOCS
Center - Mean, median, general center
Describe S (second) from CSOCS
Spread - Range (highest - lowest), IQR, standard deviation
True or False: Use the “-ly” words.
True
What are some “-ly” words? (3)
1) slightly
2) approximately
3) strongly
How to approximate median in a histogram?
1) Count frequencies to find total # of data values (sum)
2) Identify the median’s position in the data set (n+1)/2
3) Count frequencies (left to right) until you reach the median position (answer from 2)
4) Report the interval of possible values for the median
What is the method called when using a calculator?
Summary Statistics
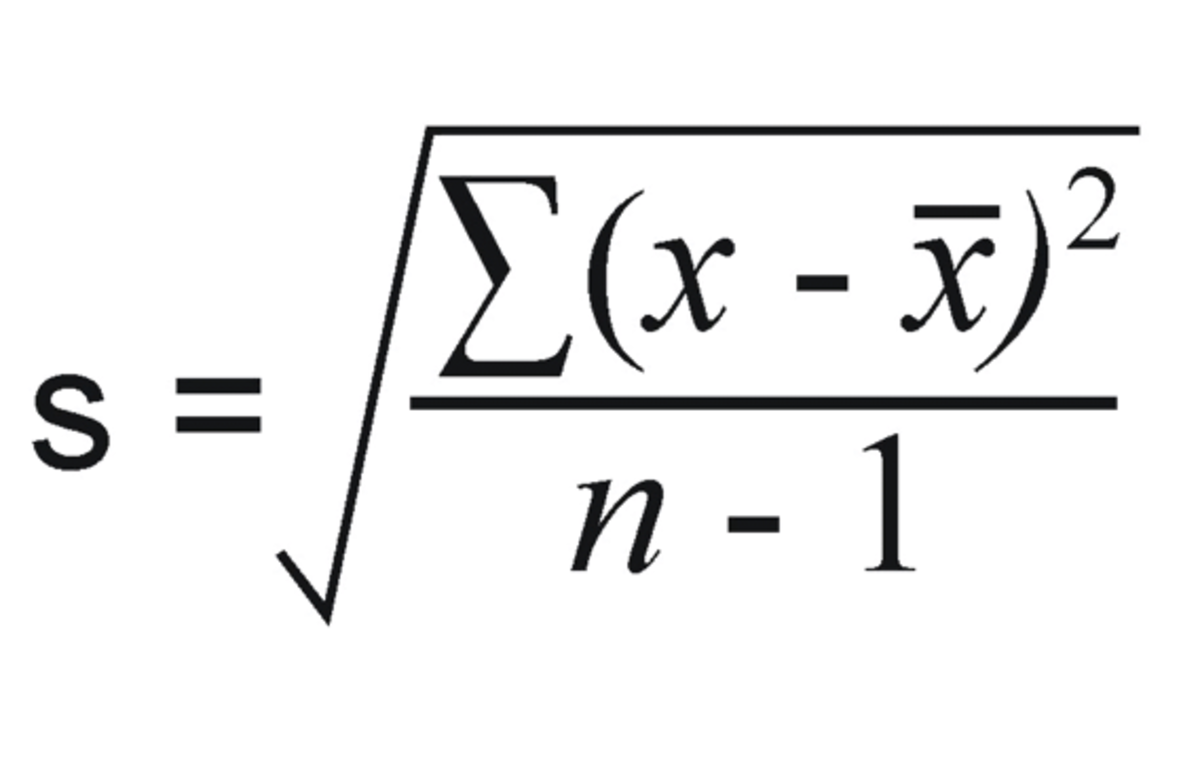
What is the formula for standard deviation?
“Average” is also known as…
Typical
To interpret the standard deviation, use this sentence stem:
“The [context] typically vary/varies by [standard deviation] from [mean = x].”
Ex. The salaries at this company typically varies by $43,010 from the mean salary of $50,100.
Define Center
The median is resistant to skew and outliers. The mean is not resistant to skew and outliers, it follows it.
True or False: The mean is resistant to skew and outliers. The median is not resistant to skew and outliers, it follows it.
False
What does “… is resistant” mean?
not seriously affected by skew and outliers
Define Spread
The IQR is resistant to skew and outliers. The range and standard deviation are not resistant to skew and outliers.
True or False: The IQR is resistant to skew and outliers. The range and standard deviation are not resistant to skew and outliers.
True
What makes certain things resistant?
The position matters for them not the values
If the mean is to the right of the median, then it is _____ skewed; mean __ median
right; >
If mean and median are in the middle, then it is ____; mean ___ median
symmetric; =
If the mean is to the left of the median, then it is ____ skewed; mean ___ median
left; <
For symmetric distributions, use ____
mean
For skewed distributions or outliers, use ___
median
The median is the ____ point; ___% of the data is below it and ___% of the data is above it.
50; 50
The _____ quartile is the median of the lower half of the data. The ____ quartile is the median of the upper half of the data
first; third
The interquartile range (IQR) is defined as _____.
Q3 - Q1
An outlier is a data value that is way too ___ or way too ___.
small; big
Formula for Low Outliers:
any value < Q1 - 1.5(IQR)
Formula for High Outliers:
any value > Q3 + 1.5(IQR)
Whiskers only extend to the ______ and _____ value, not the ____.
smallest; largest; outliers
True or False: Whiskers do not always meet at the minimum and maximum.
True
Outliers can be determined… (2)
1) 1.5(IQR) method
2) Standard deviation method
Describe 1.5(IQR) Method (2)
low outliers < Q1 - 1.5(IQR)
high outliers > Q3 + 1.5(IQR)
Describe Standard Deviation Method (2)
low outlier < mean - 2(Standard Deviation)
high outlier > mean + 2(Standard Deviation)
Define Five Number Summary
A summary of a distribution of quantitative data consisting of the minimum, first quartile, median, third quartile, and maximum
What is the specific order of Five Number Summary?
minimum, Q1, median, Q3, maximum
Define Boxplots
A visual representation of the five number summary
When comparing distributions using CSOCS, use…
comparative language such as “less than”, “equal to”, or “more/greater than”