Unit 3: Total fertility rate
1/3
There's no tags or description
Looks like no tags are added yet.
Name | Mastery | Learn | Test | Matching | Spaced |
|---|
No study sessions yet.
4 Terms
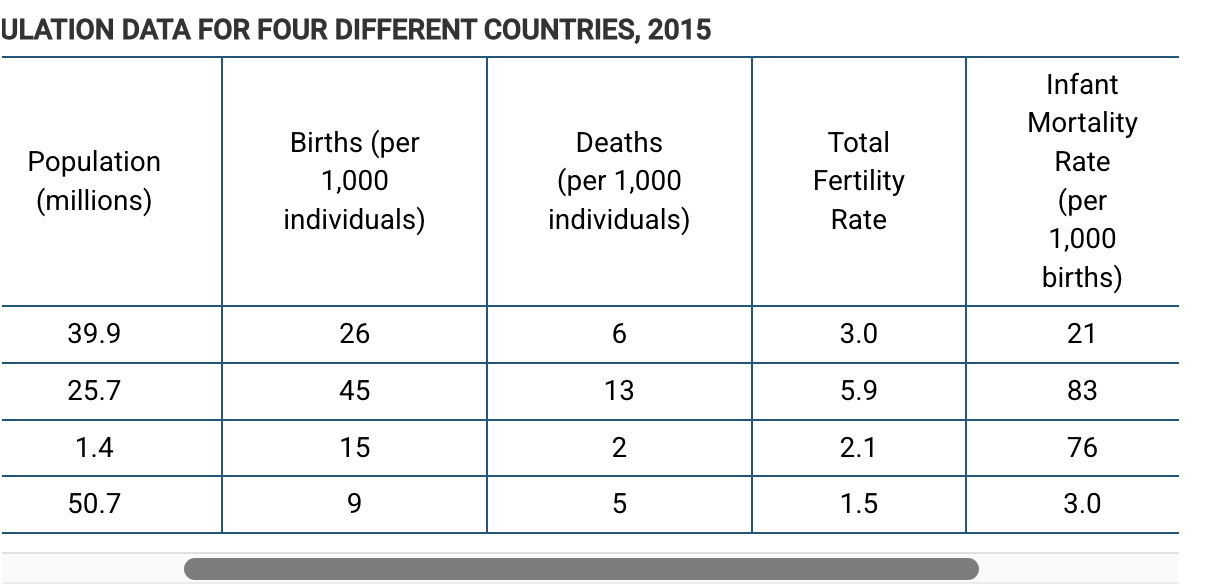
The total fertility rate in country A was 6.8 in 1980. Which of the following statements best supports the change in the total fertility rate in country A between 1980 and 2015?
A) The total fertility rate increased as a result of improved health care and better nutrition.
B) The total fertility rate remained constant even though there was improved access to clean water.
C) The total fertility rate decreased as a result of a delay in age of first marriage and increased contraceptive use.
D) The total fertility rate decreased as a result of increased infant mortality rate.
C) The total fertility rate decreased as a result of a delay in age of first marriage and increased contraceptive use.
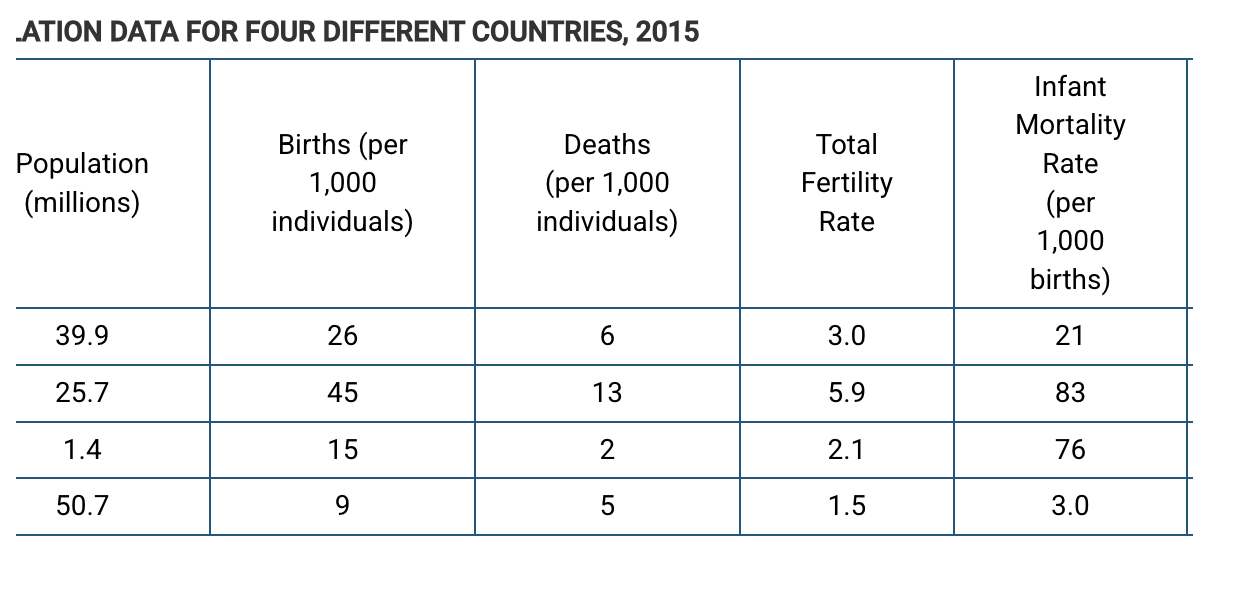
Which of the following countries has achieved replacement-level fertility?
A) Country A
B) Country B
C) Country C
D) Country D
C) Country C
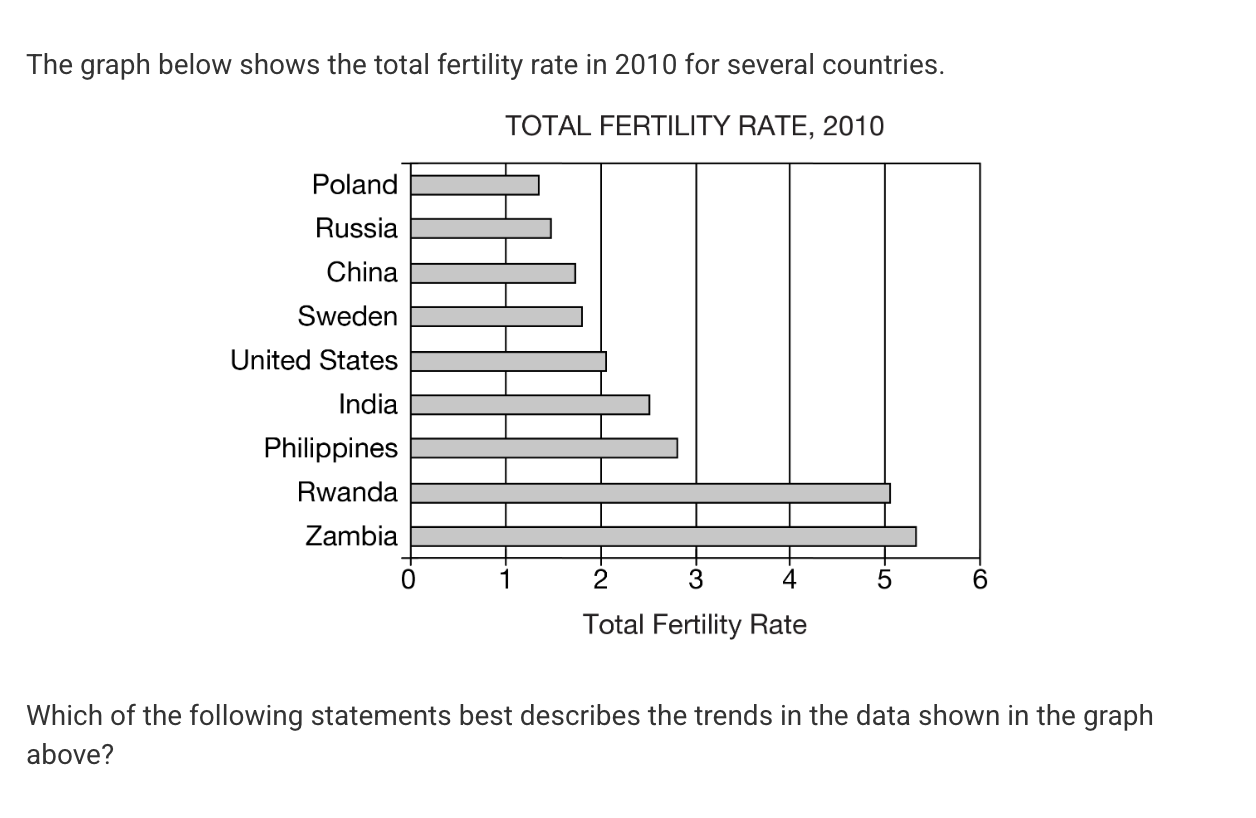
Which of the following statements best describes the trends in the data shown in the graph above?
A) Countries that are larger in total area have higher total fertility rates.
B) Rwanda and Zambia are most likely experiencing population decline.
C) More-developed countries tend to have lower total fertility rates than less-developed countries.
D) By 2010, all countries had reached replacement-level fertility rates.
C) More-developed countries tend to have lower total fertility rates than less-developed countries.
hope you did well
lol