A2 Microeconomics (up to 7.4 private costs)
1/56
There's no tags or description
Looks like no tags are added yet.
Name | Mastery | Learn | Test | Matching | Spaced | Call with Kai |
|---|
No analytics yet
Send a link to your students to track their progress
57 Terms
What is utility?
Utility is the satisfaction gained when consuming a good.
Total utility vs Marginal utility?
Total utility is the total satisfaction received by consuming all of the good.
Marginal utility is the additional satisfaction received when one more of the good is consumed. IE the additional utility when consuming an additional unit of the good.
What is the law of diminishing marginal utility?
States that marginal utility decreases as more of the good is consumed.
When is total utility of a single good maximised?
When the Marginal utility is 0. (When you wont gain anything by consuming an additional piece of the good)
What is the Equimarginal principle?
Equimarginal principle states that total utility from consuming multiple goods is maximised when:
M.U.a / Price of A = M.U.b / Price of B
(i.e, when marginal utility per dollar is equal for each good.)
Under principle, it is not possible for total utility to increase no matter how expenditure is reallocated.
What are the assumptions underlying the equi-marrginal principle?
1) Consumers have limited incomes
2) That consumers want to maximise utility
3) That consumers act rationally
How do you derive the demand curve using the Equi-marginal Principle?
Highlevel summary
Show why QD increases when P decreases through equimarginal principle and sneaky use of law of diminishing MU.
Groundwork
A) State inverse relation between P and QD.
B) Let there be 2 Goods, X and Y
C) Let income, price and preference of Y, be fixed
Derivation (Should draw graph)
1) At equilibrium where total utility is maximised, equimarginal principle states:
MUX / PX = MUY / PY
2) When PX decreases, disequilibrium happens where: MUX / PX > MUY / PY
3) Consumer increases consumption of X so MUX decreases by law of diminishing MU. QX increases.
3a) Expenditure is switched from Y, which will increase MUY by law of diminishing MU.
4) Process continues until new equilibrium reached. Final result is PX decrease, QX increase.
Caveat
- Assumes 2 goods, reality has multiple goods.
- Solution: let MUY be utility gained from all other goods not X
How do you derive the demand curve using the marginal utility?
Highlevel summary
Show how MU is the same as price. Also sneaky use of law of diminishing MU to show LoD.
Groundwork
A) State law of demand
B) Assume that consumer can attach value to MU
Derivation
1) Consumers willingness to buy a good depends on the MU
2) MU has monetary value, consumers will only buy when MU = price willing and able to pay
3) Therefore price to QD = MU to QD. (MU curve and DD curve is the same)
4a) Due to law of diminishing MU, when consuming extra units of the good (QD increase), MU decreases, hence price will decrease.
4b) Vice versa for consuming less. Law of demand demonstrated.
What are the limitations of Marginal Utility theory?
1) Utility is difficult to measure
Subjective since based on satisfaction.
Cannot be compared between consumers
2) Utility can change depending on factors
Satisfaction will change depending on income, consumption of other goods etc
3) Rationality
Consumers do not always buy to maximise utility.
Impulse buying, peer pressure, feelings.
What is economic efficiency?
Scarce resources used in the most efficient way to produce max output
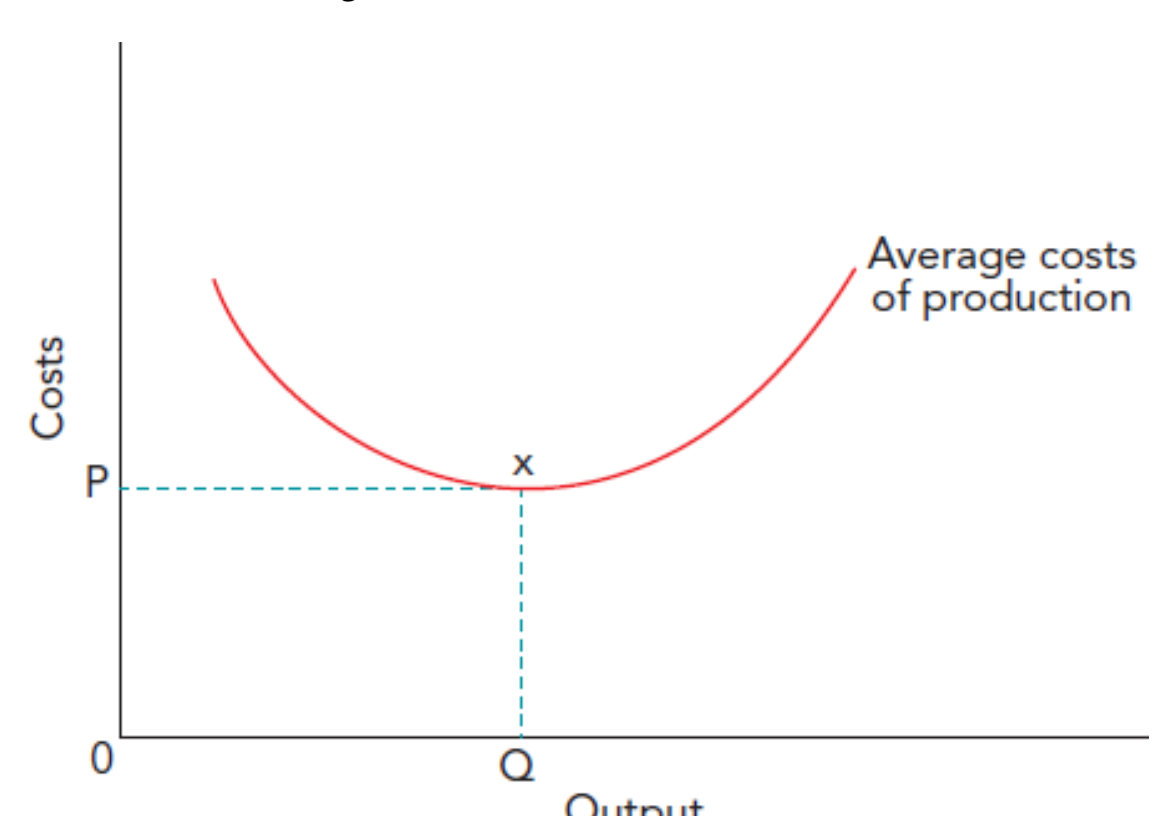
What is productive efficiency and what is it a combination of?
1) When a firm is at minimal total average cost, while producing maximum output possible.
- At cost and technical efficiency
- illustrate using total cost v output graph
2) Combination of cost efficiency / technical efficiency
- Cost efficiency is for inputs
- Technical efficiency best use of inputs
What is Pareto optimality?
A situation where no reallocation of resources can make an individual better off without making another individual worse off.
What is Pareto improvement?
Where you get a net welfare gain without anyone made worse off.
What is allocative efficiency?
Is achieved when firms are producing an appropriate quantity and combination of goods relative to consumer preferences.
Where price = marginal cost (The price paid for the good reflects the true economic cost of the good)
- No waste is created since the correct amount of resources is allocated to produce the correct amount of the good.
Why is it not possible to illustrate allocative efficiency using the PPC?
Any point along the PPC could be what consumers want. (i.e., P = MC)
How do you illustrate allocative efficiency?
Can use MB MC graph or MU MC graph
Show how at disequilibria, society can benefit from consuming/producing more/less of the good. Why they do that is bc firms enter and exit. Or when MU > MC.
Marginal utility vs marginal benefit
MU refers to additional satisfaction
MB refers to additional benefit in monetary terms.
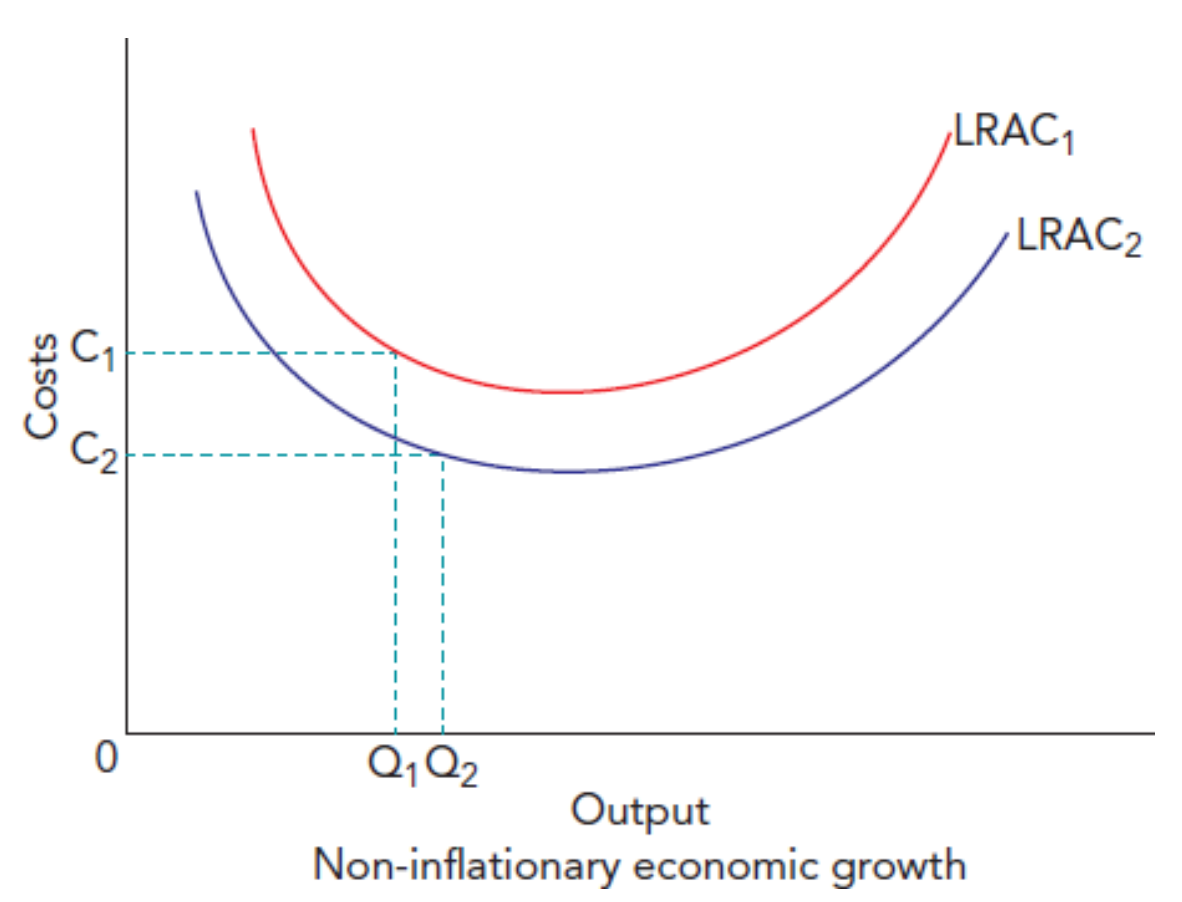
What is dynamic efficiency? How to illustrate?
Dynamic efficiency refers to productive efficiency while taking into account of the need for technological progress to face changing market needs and competition.
Is long run, and requires investment.
Use Average cost v output graph, lower cost but more output.
What is market failure?
When the free market fails to provide the socially optimal allocation of resources.
Either something is over provided, or under provided.
Why is there market failure? (Why is there inefficient allocation of resources?)
True cost/benefit of the good not reflected in its price. Externalities not considered in the price of the good, causing over/under consumption
Could be due to information failure.
Free rider problem, causing non provision of public goods.
Large firms taking advantage of market dominance at the expense of others
many more…
Private cost vs external cost vs social cost
Private cost is the cost incurred by the individual/firm directly involved in the economic activity ( consuming or producing a good).
- cost of the good/ cost to produce the good
External cost is the cost borne by a third party who was not directly involved in the economic activity (consumption/production of the good.)
- pollution caused by cars.
Social cost is the sum of private and external cost.
Private benefit vs external benefit vs social benefit
Private benefit is the benefit received by consumer/producer that are directly involved in the economic activity.
- Ease of travel via planes, airline revenue
External benefit is the benefit received by third parties not directly involved in the economic activity.
- vaccine protects others too,
Social benefit is the sum of the above.
What is a deadweight loss?
Loss in social welfare due to externalities that move the market away from allocative efficiency.
Market failure or market distortions.
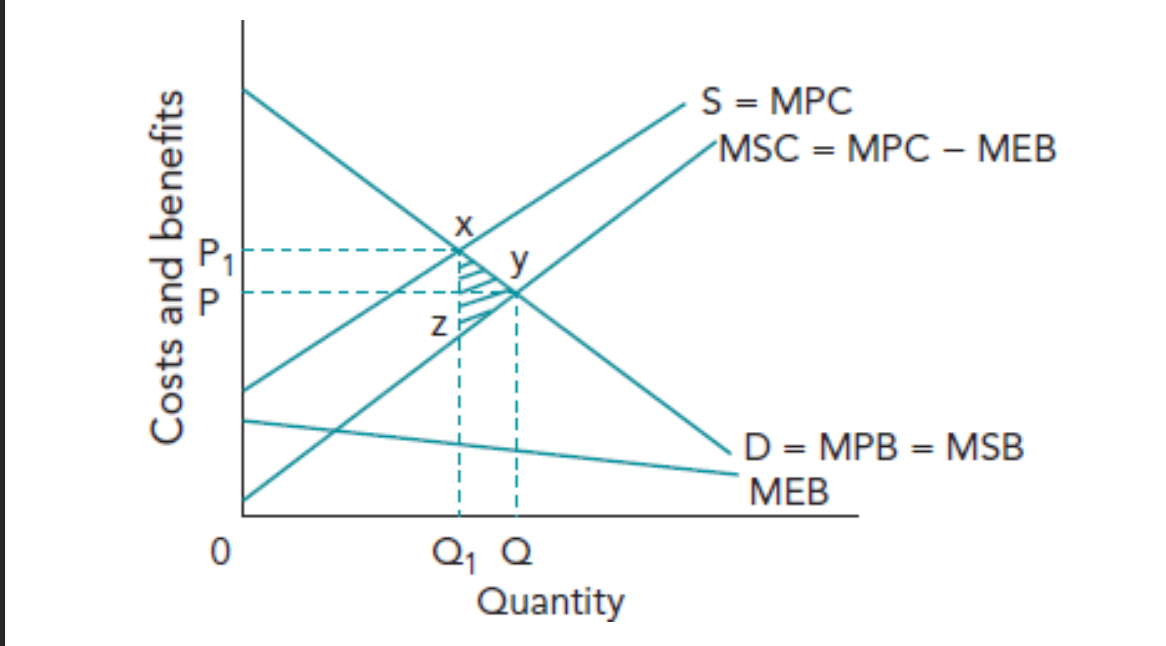
Why is social welfare only maximised when MSC = MSB?
Consider a price/benefit/cost v quantity curve
Draw MSC MSB curve. (Same as DD SS curve)
Show that away from intersection, society can either increase of decrease consumption to maximise welfare.
Hence.
What are externalities?
Effects (can be positive or negative) as a result of economic activities that are felt on third parties not directly involved in the activity.
Not reflected in market prices due to information failure.
Extra: Why do we plot marginal benefit/cost instead of total benefit/cost?
So that the total area under graph can be total benefit/cost.
How to investigate effects of externalities using graphs?
Depending on whether it comes from production or consumption, decide is whether changing DD or SS.
For the curve you want to change, take into account of externality. for other curve, assume no externality.
let M Social B/C = M Private B/C - M External B/C,
and the other curve M Social B/C = M Private B/C
Then see deadweight loss and how to correct it
How to illustrate using MPB/MPC effects of consumers having imperfect information?
draw a price/benefit/cost v qty graph
MPC = SS
draw actual and perceived MPB, illustrating deadweight loss
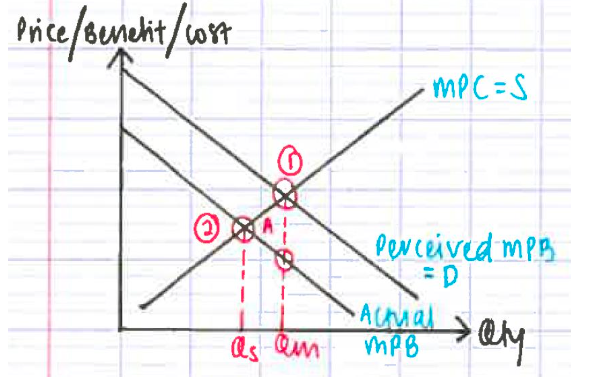
What does imperfect information in the consumer side refer to?
Consumers overestimating or underestimating the MU of the goods/services
What is asymmetric information? Examples?
A situation where one economic agent involved in the economic transaction has more info than another economic agent.
Example: Moral hazard and Adverse Selection
What is a moral hazard? And min 2 examples
Concerns HIDDEN ACTIONS of economic agents, happens AFTER the contract
Asymmetric info where party A is prone to certain actions (such as take up more risk) as it is at the expense of party B. T
his is also due to the inability of party B to observe the actions of party A and get information about their actions.
Market failure happens due to wastage of resources.
Example:
- Bank give loan, people takes more risk after the loan is approved.
- Insurance insures, people takes more risk after the insurance is approved
- Boss give fixed wage, people works less after being hired.
What is an adverse selection? Give min 2 examples, and how to illustrate?
Concerns HIDDEN ATTRIBUTES of a good/service, happens BEFORE the contract.
Asymmetric info where one party knows more about the good than the other party. Party with less info is adversely selected against.
Market failure in the form of a market collapse happens. Causing loss of the CS and PS from that market.
Example:
- Used cars. Buyer cannot tell condition of car, hence is only willing to pay a price lower than what a high quality car, but higher what a low quality car, will command respectively. Hence high quality cars cannot be sold, there is a complete collapse of that market.
- Health insurance. Insurer cannot tell if ppl high or low risk, hence set average premium which is higher than low risk premiums but lower than high risk premiums. Collapse of the low risk insurance market.
To illustrate, draw two separate markets and their CS PS, then say the impact of one completely disappearing.
What is a Social Cost Benefit Analysis?
Process of evaluating the worth of the project by comparing its direct social costs and benefits, as well as externalities (indirect costs and benefits).
What does a Social cost benefit analysis look into?
Compares direct and indirect, social costs and benefits. (Exam pls separate and elaborate properly!)
What are direct costs and indirect costs? EG?
Direct costs are private costs. eg production and labour costs
Indirect costs are externalities and opportunity costs.
What are direct benefits and indirect benefits?
Direct benefits and private benefits. eg profits.
Indirect benefits are external benefits.
What are the steps in doing a social cost benefit analysis
1) Identify direct indirect costs and benefits
2) Put a monetary value on said costs and benefits
3) Forecast future costs and benefits. Calculate Net Present Value of the project. As benefits and costs are in future terms, but must be expressed in current terms of value to be analysed
4) Decide and constantly reevaluate the cost to benefit ratio.
What are some downsides or limitations doing a cost benefit analysis?
Difficult to assign monetary value (shadow price) to indirect costs/benefits
- Different opinions on extent of the costs/benefits
Difficult to choose appropriate discount rate for the future
- unpredictable events may happen, costs may change.
What is the production function?
The production function shows the relationship between the amount of input used by a firm and the maximum amount of output produced in a period of time.
There are short run and long run production functions.
Short run vs long run
Short run - At least 1 factor of production is fixed (typically capital)
Long run - All factors of production can be varied
What is total, average, and marginal physical product?
Physical product is the output produced by the firms.
Total means total quantity of output given the inputs
Average is output per unit input
Marginal is for an additional unit input.
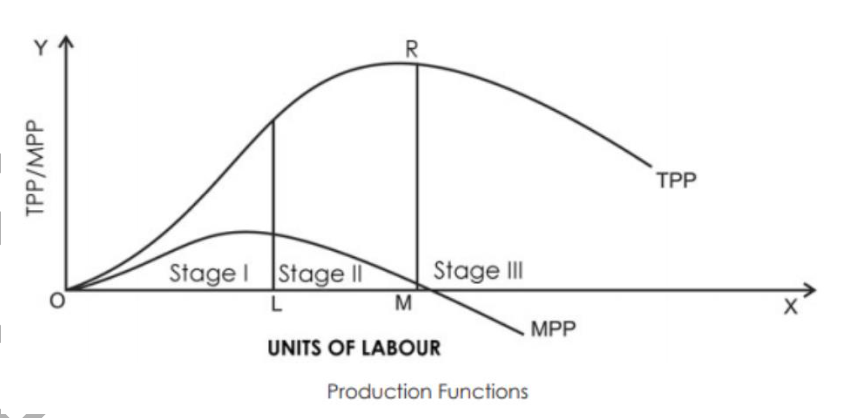
What is the law of diminishing returns? How to illustrate it on a graph?
The law states that as the quantity of one factor of production increases while the others are fixed, marginal output will increase initially before decreasing. The firm will get diminishing marginal returns.
Plot total physical product/ marginal physical product against an input (labour). MPP is derivative.
When is total physical product is maximised with reference to input?
When is output most optimal with reference to cost?
Maximised TPP
When Marginal Physical Product is 0.
Optimal output
When Average Total cost is minimum.
Also when Marginal Cost = Average total cost. (If your additional cost is more than average, the average cost will increase)
What are the stages of in the law of diminishing returns + brief explanation of why?
Initially: MPP increasing, TPP increasing fast.
Then: MPP decreasing, TPP increasing slower until max
Then: MPP -ve, TPP dropping
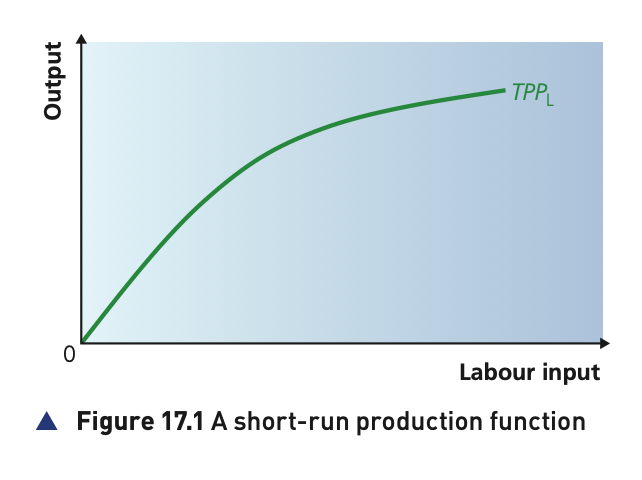
How to draw the short run production function?
Plot output against increasing a variable input (such as labour). You can show decreasing returns if you want.
What are isoquants and isocosts? How to draw them?
Isoquants
Illustrates the points where the firms produce the same amount of output but with a different combination of inputs.
Input v input. Higher the curve, the higher the output.
Isocosts
Illustrates the points where the firms incur the same amount of cost but with a different combination of inputs.
Input v input. Higher the line, higher the costs.
Combine both to see where firms want to produce. (The point on the isoquant closest to the origin / isoquant tangent to isocost)
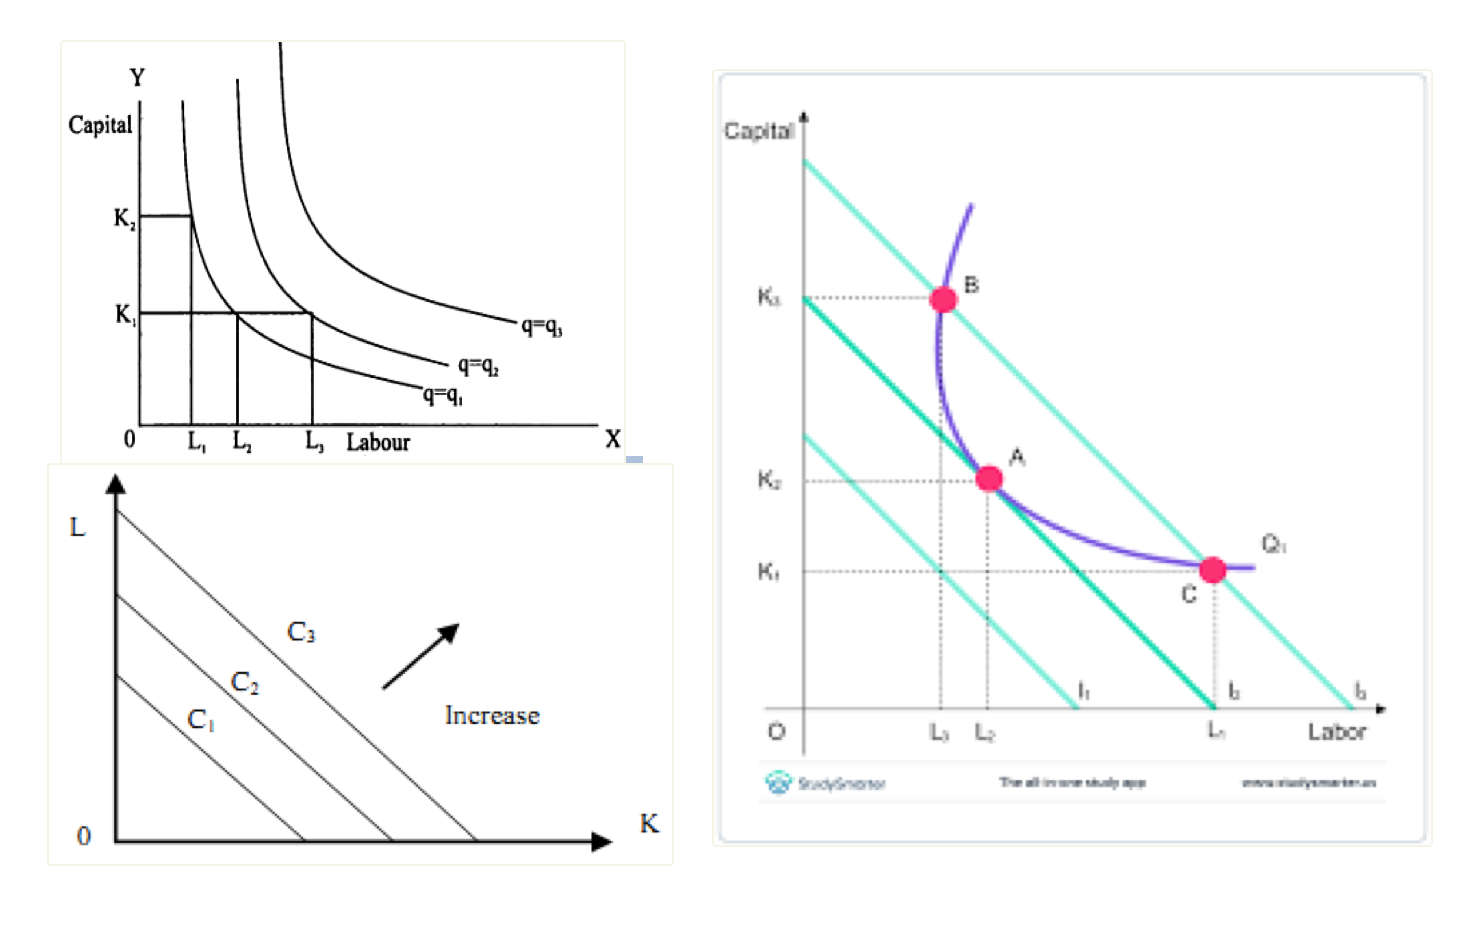
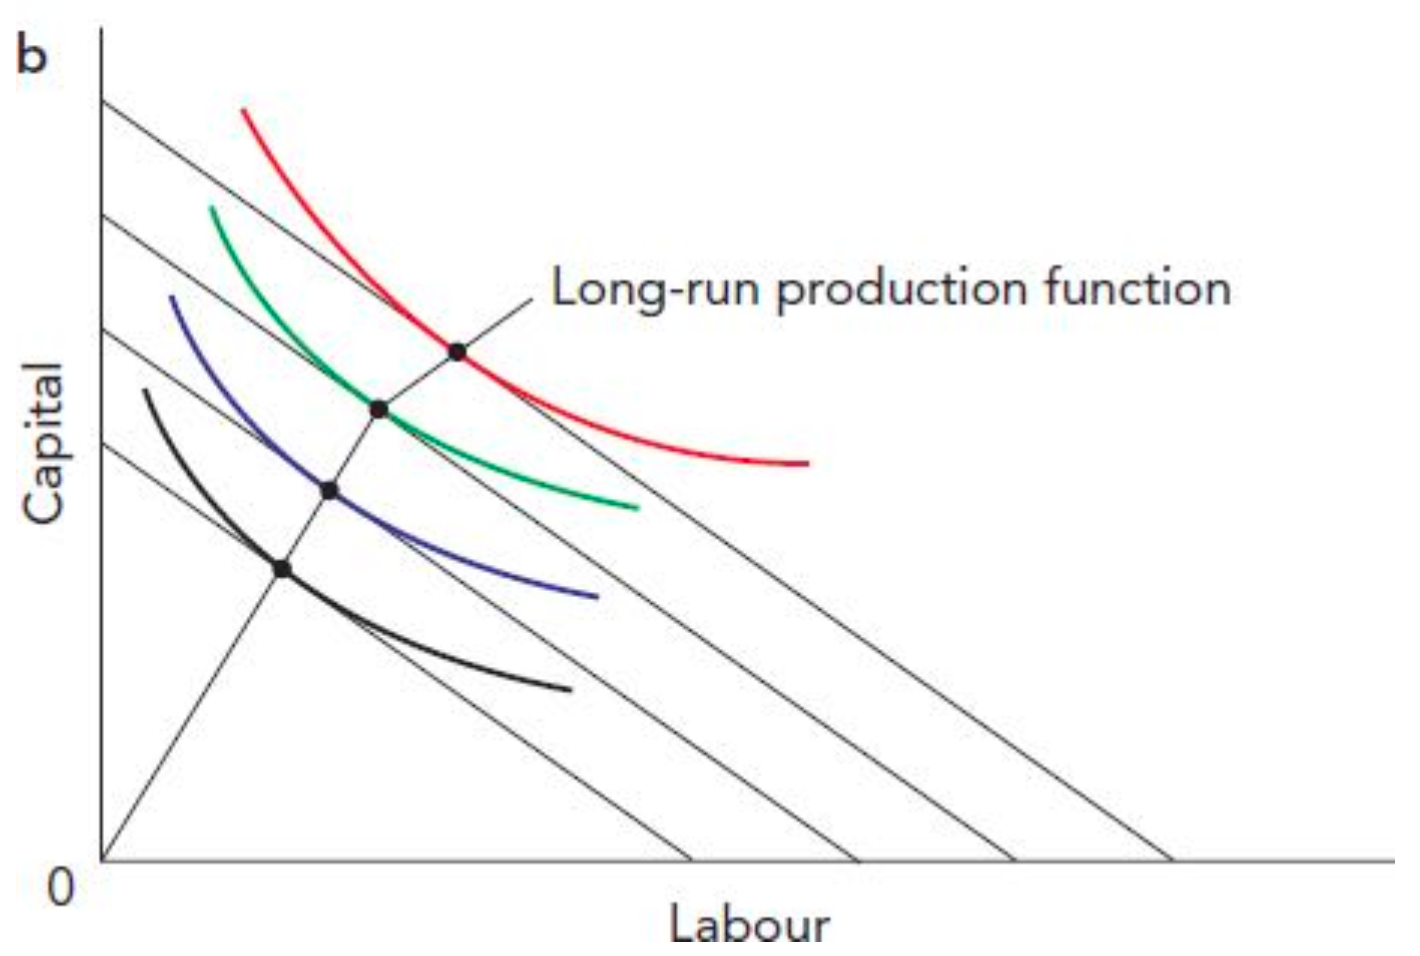
How to derive the long run production function?
Long run all inputs can vary. Need isoquants to determine output, isocost to determine position.
Plot input to input, assume long run isoquants/isocosts expand out. Try to show decreasing returns to scale by spacing out the isoquants more the further they are.
What are increasing, constant, decreasing returns to scale?
Scale refers to when all inputs increase together.
Increasing means you get a more than proportionate increase in output compared to the increase in all input.
Constant is when proportionate
Decrease is less than proportionate
Explicit costs vs implicit costs.
Economic costs vs account costs.
Explicit costs are costs for things used.
- (eg raw materials)
Implicit costs are opportunity costs.
-(e.g. if you had put the capital in the bank, if you rented out the machinery)
-The return you could’ve gotten if you had done sth else.
Economic costs includes explicit and implicit costs
Accounting costs just have explicit costs.

Difference between short run and long run costs?
Short run costs are costs incurred when at least 1 FOP is fixed. Mostly to do with law of diminishing marginal returns.
Long run costs and costs incurred when scale increases. Mostly to do with economies/diseconomies of scale.
Total, average, and marginal costs
Total costs is the economic cost of a given level of output.
Average costs is cost per unit
Marginal cost is additional cost.
Fixed vs variable vs sunk costs
Fixed cost are costs that dont vary with level of output in the short run.
- costs independent of output/ e.g. capital
Variable costs costs that vary with level of output.
- cost of raw materials.
Sunk costs
- costs incurred by the firm that cannot be recovered if the firm closes. E.g. marketing costs, branding costs. As opposed to a factory which you can sell.
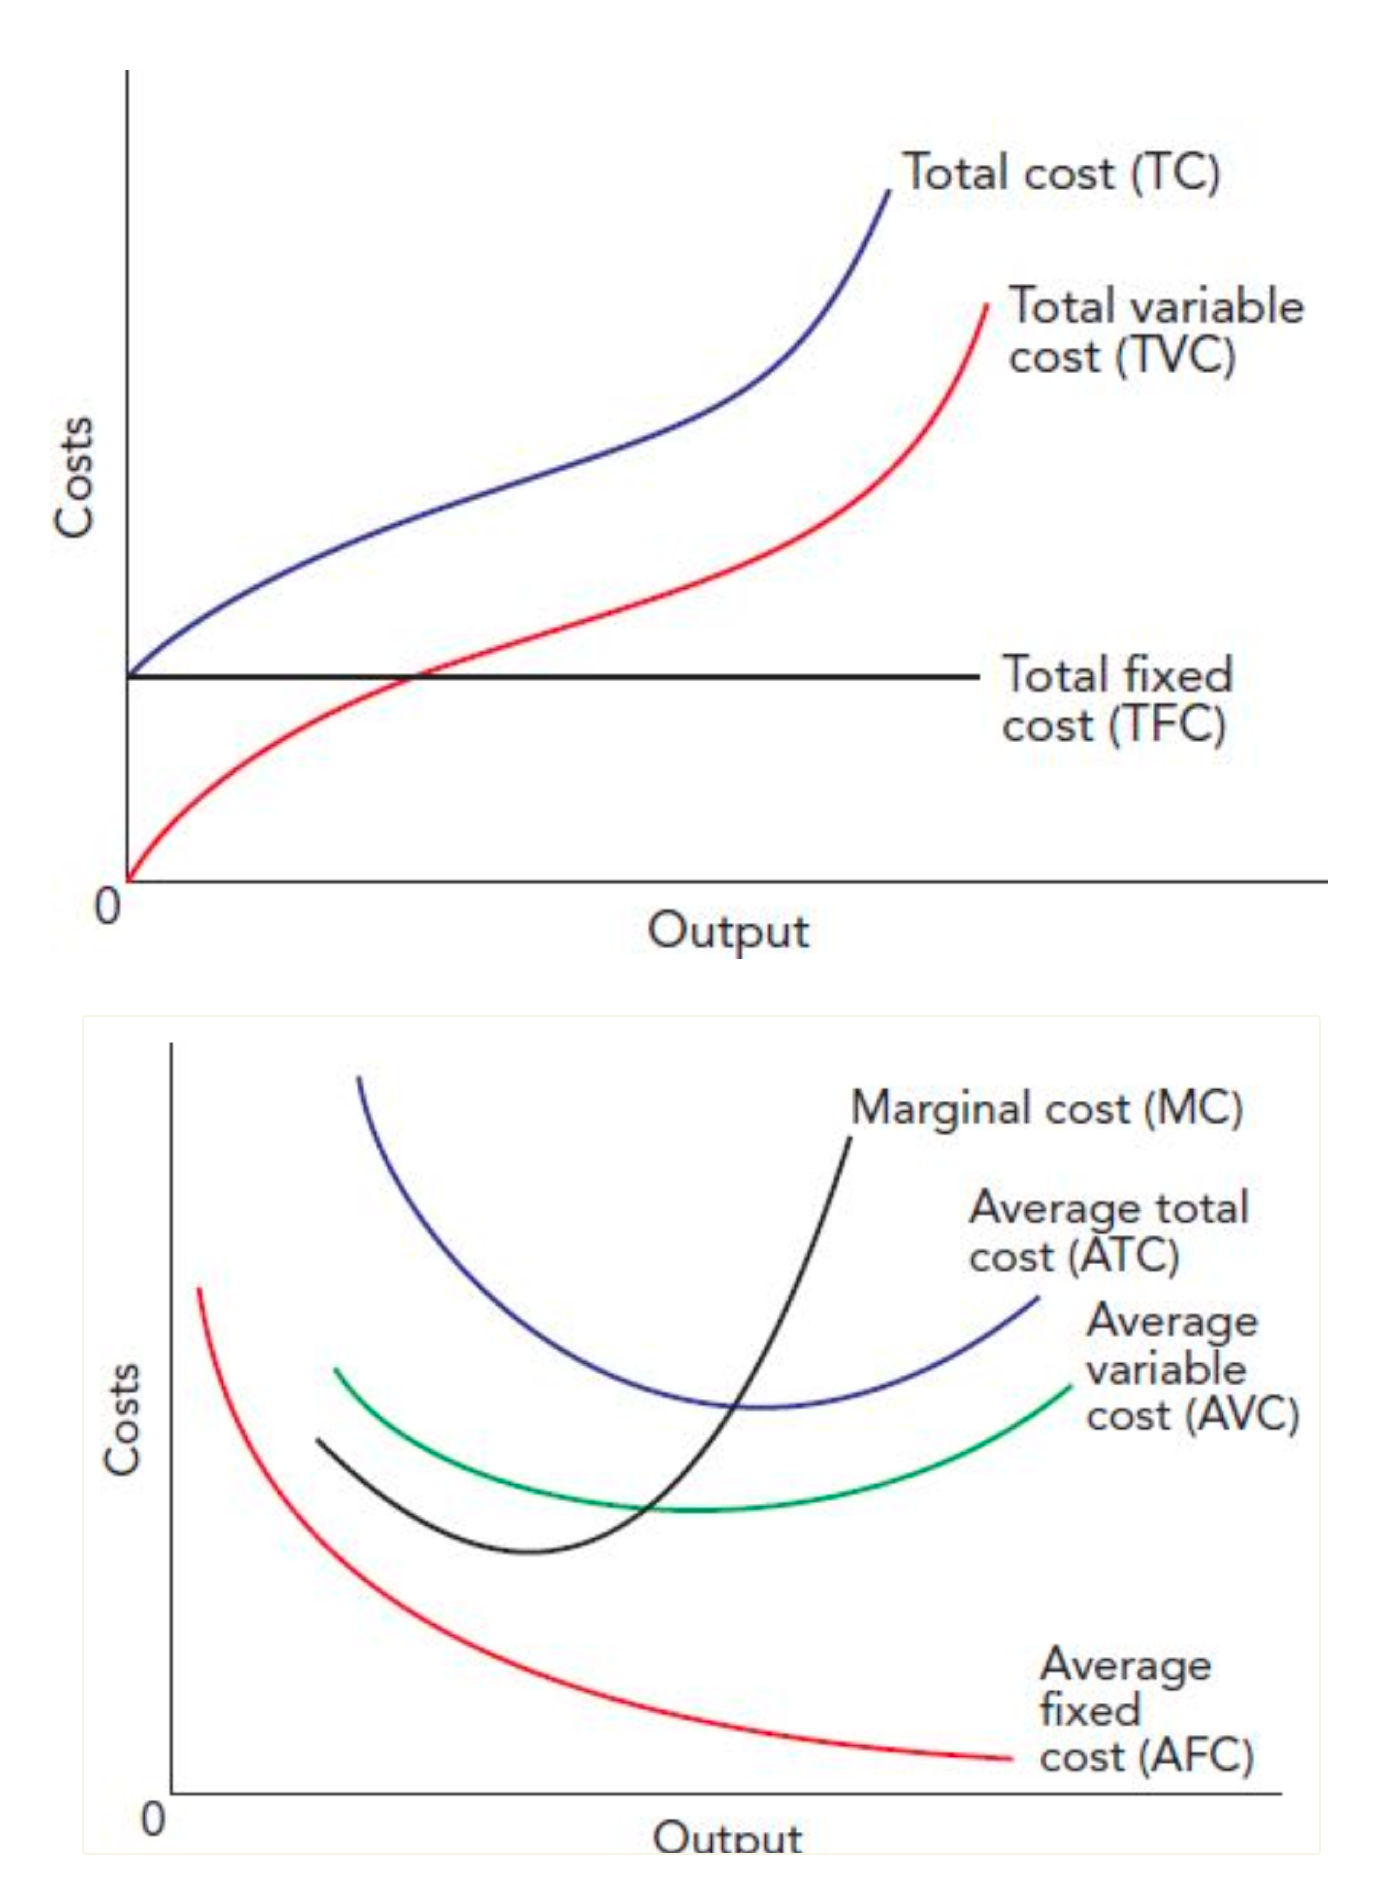
How to show the short run cost function?
Plot costs against output. Remember diminishing returns! (means higher costs per output as output increases.
Here are the graphs for total costs and the other costs.
MC cuts the minimum of AVC and ATC
AFC falls
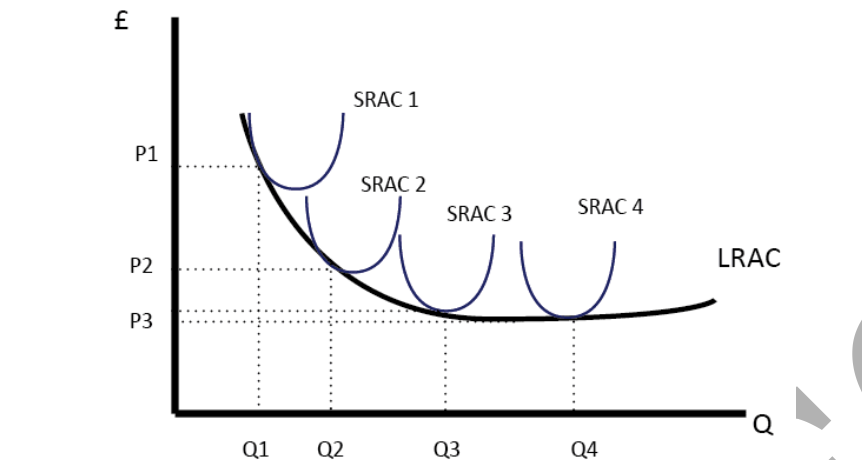
How to show long run cost function? (i.e. the planning horizon of the firm)
Cost v output.
Due to economies of scale, position of SR Average Cost moves down in the LR. (before moving up again due to diseconomies of scale.)
Envelop all the SRAC. Tangent.
What is the short run/long run average cost?
SRAC shows average costs in the short run.
LRAC shows lowest possible average costs attainable in the long run. A planning curve.
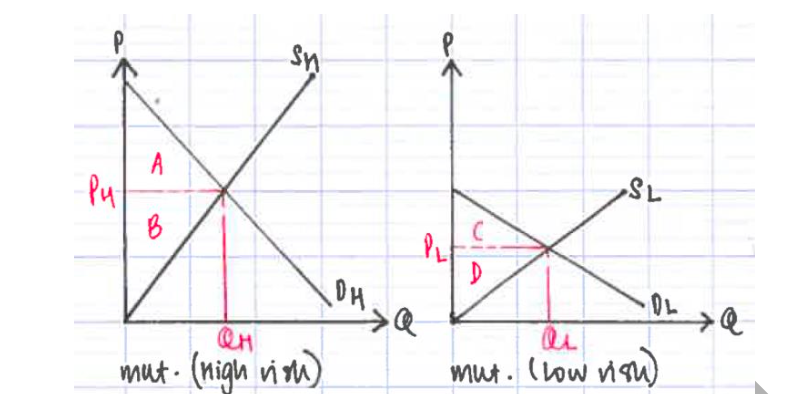
What is the economies of scale? Give examples. (external internal)
Economies of scale is the phenomenon as output and scale increases, long run average cost decreases.
Examples:
INTERNAL (within firms)
1) Division of labour. More labour, can specialise each labourer.
2) Can utilise technology designed for large scale production. More efficient.
3) Lower per unit marketing costs
4) Management costs grows slower.
5) Easier finance (can get loans if big)
6) Bulk purchasing
EXTERNAL (industry scale increase)
1) Labour pool increase. More ppl want to train in the relevant skills
2) Tech availability
3) Concentration of firms of the same industry increase, then govt may develop common infrastructure.
What is diseconomies of scale? Give examples? (external internal)
Diseconomies of scale is the situation when as scale and output of a firm increases, long run average cost increases.
INTERNAL
1) Less flexible. Ballooning management. Bureaucracy.
2) Coordination and communication difficulties
3) Workers demotivated as they become more insignificant.
EXTERNAL
1) Traffic congestion
2) FOP shortage. Price of inputs (raw material, labour) goes up as there is higher demand. Availability of FOP decreases.
3) Country infrastructure limitations.