A level Edexcel Maths Large Data set
1/8
Earn XP
Description and Tags
Name | Mastery | Learn | Test | Matching | Spaced | Call with Kai | Chat |
|---|
No analytics yet
Send a link to your students to track their progress
9 Terms
What is the normal value of daily mean pressure?
1013hPa
What is the normal range of daily mean pressure?
988-1038 hPa
What is the range of the Beaufort scale?
1-5
What is the range of the daily mean total cloud?
0-8 oktas
Using your knowledge of the large data set, explain why it is not meaningful to look for a linear relationship between Daily Mean Wind Speed (Beaufort Conversion) and Daily Mean Air Temperature in Beijing in 2015. (1)
Daily mean wind speed is qualitative variable (1)
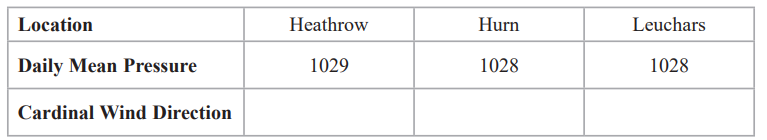
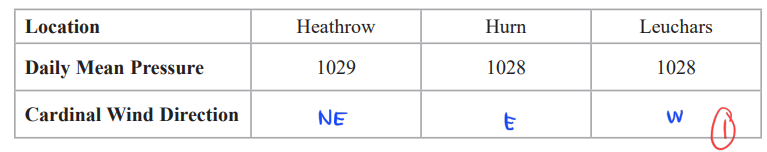
Stav knows that, in the UK, winds circulate • in a clockwise direction around a region of high pressure • in an anticlockwise direction around a region of low pressure
The table gives the Daily Mean Pressure for 3 locations from the large data set on 26/09/2015
The Cardinal Wind Directions for these 3 locations on 26/09/2015 were, in random order, W NE E
You may assume that these 3 locations were under a single region of pressure.
Using your knowledge of the large data set, place each of these Cardinal Wind Directions in the correct location in the table. Give a reason for your answer. (2)
Locations from north to south : Leuchars, Heathrow , Hurn
Dian uses the large data set to investigate the Daily Total Rainfall, r mm, for Camborne.
Explain why the distribution B(14, 0.27) might not be a reasonable model for the number of days without rain for a 14‑day summer event. (1)
p=0.27 is unlikely to be constant (1)
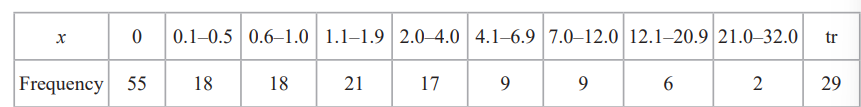
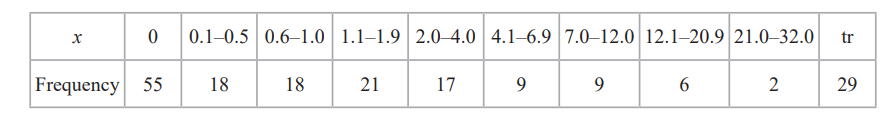
Ben is studying the Daily Total Rainfall, x mm, in Leeming for 1987 He used all the data from the large data set and summarised the information in the following table
Explain how the data will need to be cleaned before Ben can start to calculate statistics such as the mean and standard deviation. (2)
Replace ‘tr’ with a numerical value between 0 and 0.05 (1)
For example, 0.025 (1)
Ben suggests using the statistic calculated in part (b)(i) to estimate the annual mean Daily Total Rainfall in Leeming for 1987
(c) Using your knowledge of the large data set,
(i) give a reason why these data would not be suitable
(ii) state, giving a reason, how you would expect the estimate in part (b)(i) to differ from the actual annual mean Daily Total Rainfall in Leeming for 1987 (2)
Only covers May~Oct (so not a suitable sample) (1)
Winter months are missing when we’d expect more rain so we expect the estimate to be an underestimate (1)