PSC 103A Exam 1
1/73
There's no tags or description
Looks like no tags are added yet.
Name | Mastery | Learn | Test | Matching | Spaced |
|---|
No study sessions yet.
74 Terms
descriptive statistics
- details characteristics of a sample
- mean, median, mode, sd, var
- collecting, organizing, summmarizing data
inferential statistics
- generalize characteristics to a population
- testing hypothesis
- examine relations among variables
- make predicitions
parameter
value of interest in population (mean, sd, variance, correlation)
statistic
value computed from sample
measurement
- quantify attributes in a construct (can make good or weak inferences)
examples of measurements hard to quantify
attachment, self-esteem, personality, self-regulation
Measurement Scales
- nominal
- ordinal
- interval
- ratio
nominal
categorical (classification) -- grouping individual observations into qualitative classes
- Hair color (blonde, gray, brown, black, etc.)
- Nationality (Kenyan, British, Chinese, etc.)
ordinal
order/ranking (classification, order)
- order of race finishings, likert scale
interval
number/grouping denotes magnitude of differences among observations (classification, order, equal intervals)
- IQ scores, temperature,
ratio
like interval but with logical zero point (classification, order, equal intervals, true zero)
- age, height, weight, speed
univariate
bivariate
multivariate
1 variable
2 variables
3 or more variables
Categorical Variables
qualitative, no numerical property
- binary (2 options)
- nominal (greater than 2 options and NO order)
- ordinal (greater than 2 options and ordered)
Numerical Variables
quanitative, numerical responses
- discrete (numerical values limited to isolated points on number line) -- ex. # of pets
- continuous (numerical values NOT limited to isolated points on number line) -- ex. age, height
What data visualization is best for identifying outliers and spread?
histograms and boxplots
What data visualization is best for describing relationships between variables?
scatterplots (ex. stress x performance)
detect outliers by using ________ and handle them by ___________
- boxplots, z scores
- remove, transform, keep w justification
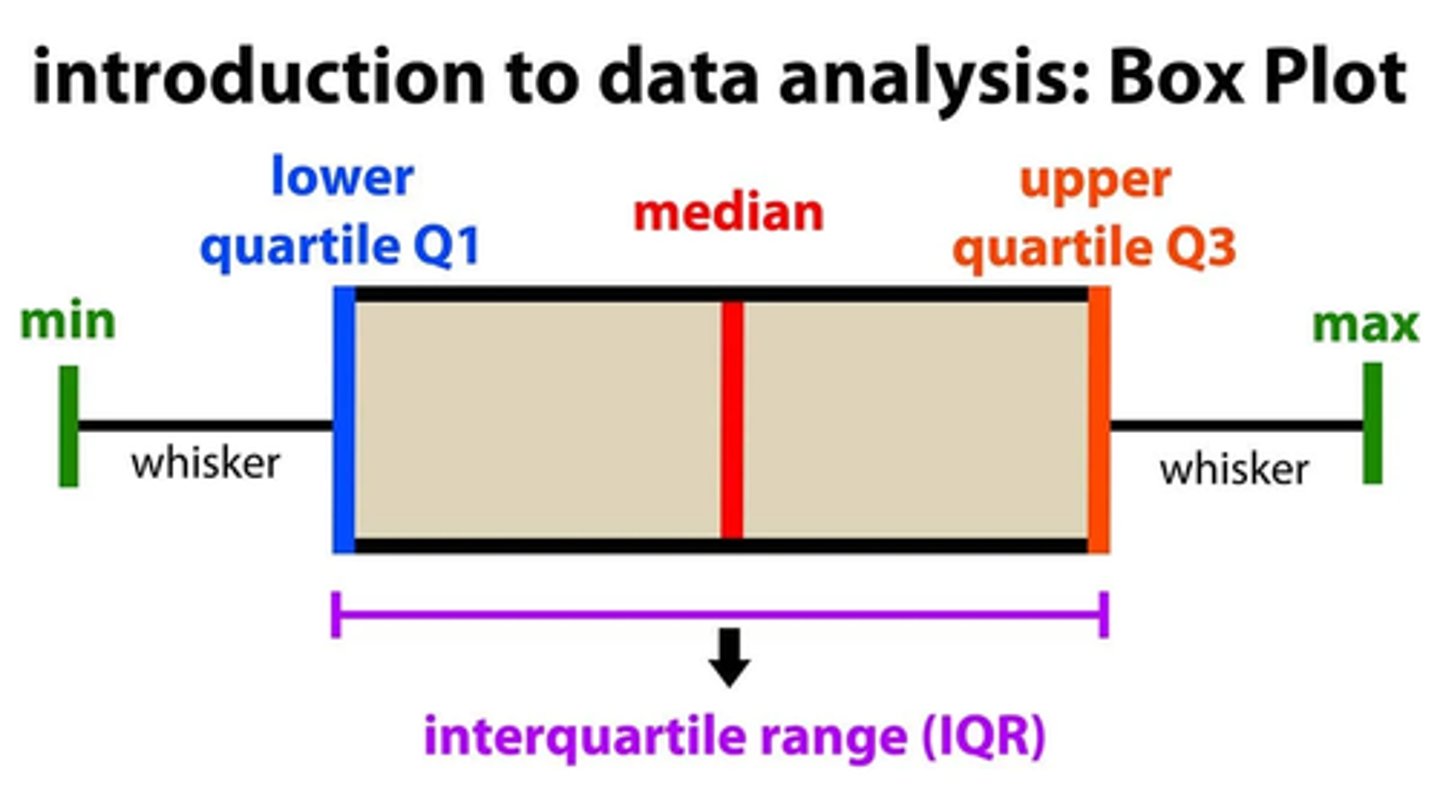
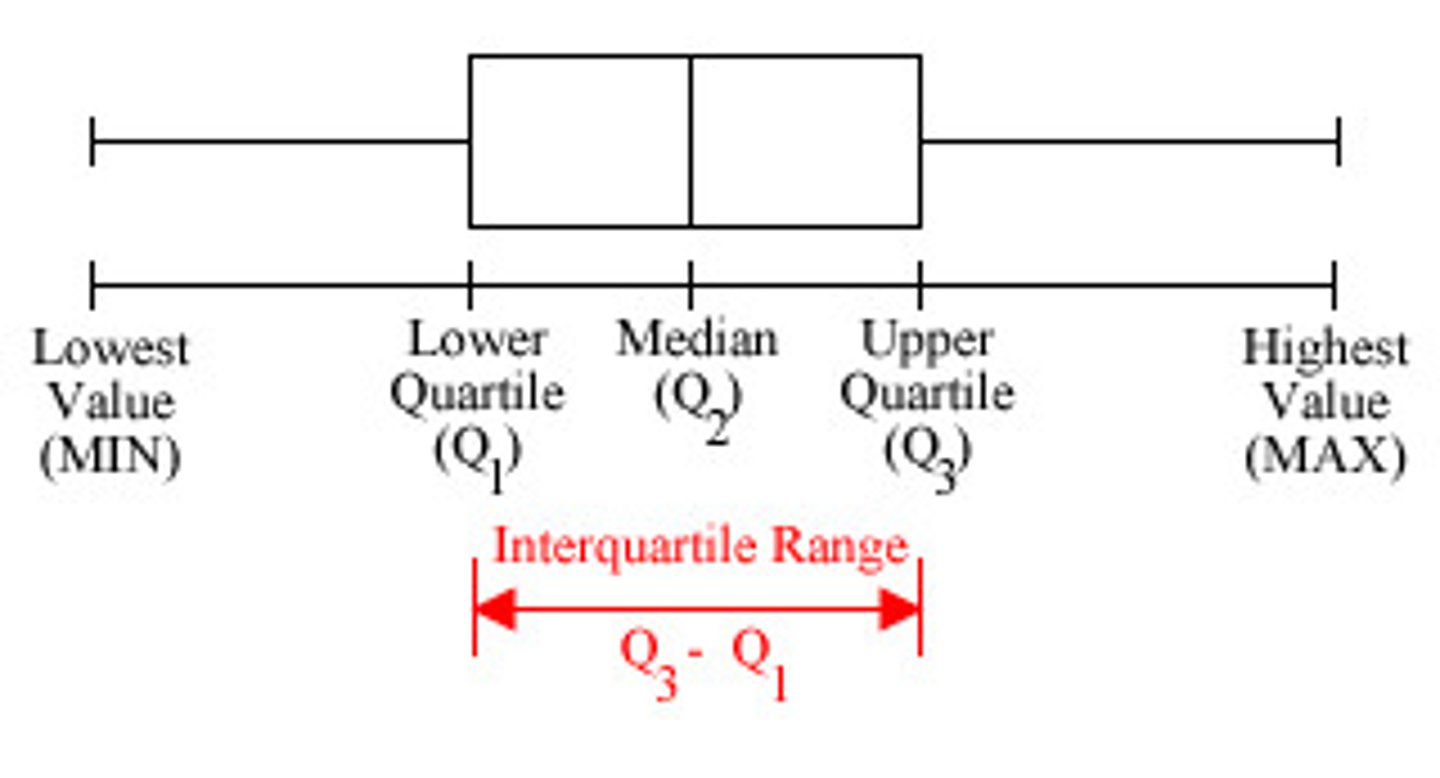
boxplot shows
- line can also show mean
mode
most repeated value
- not intrinsic, needs to be determined
- mode is midpoint in frequency distrubution
- very UNRELIABLE source of info
- highly resistent measure
- sensitive to size and number of class intervals
- good for nominal variables
median
midway point
- highly resistant
- affected by change in value of a case
- good for "bad" distributions like US incomes
- good for arbitary ceiling/floor distributions
mean
average
- most commonly used measure of central tendency
- for inference and descriptions
- BEST estimator of parameter
- NON resistent
- sum of signed deviations equals 0 (di= xi - x [ sample mean])
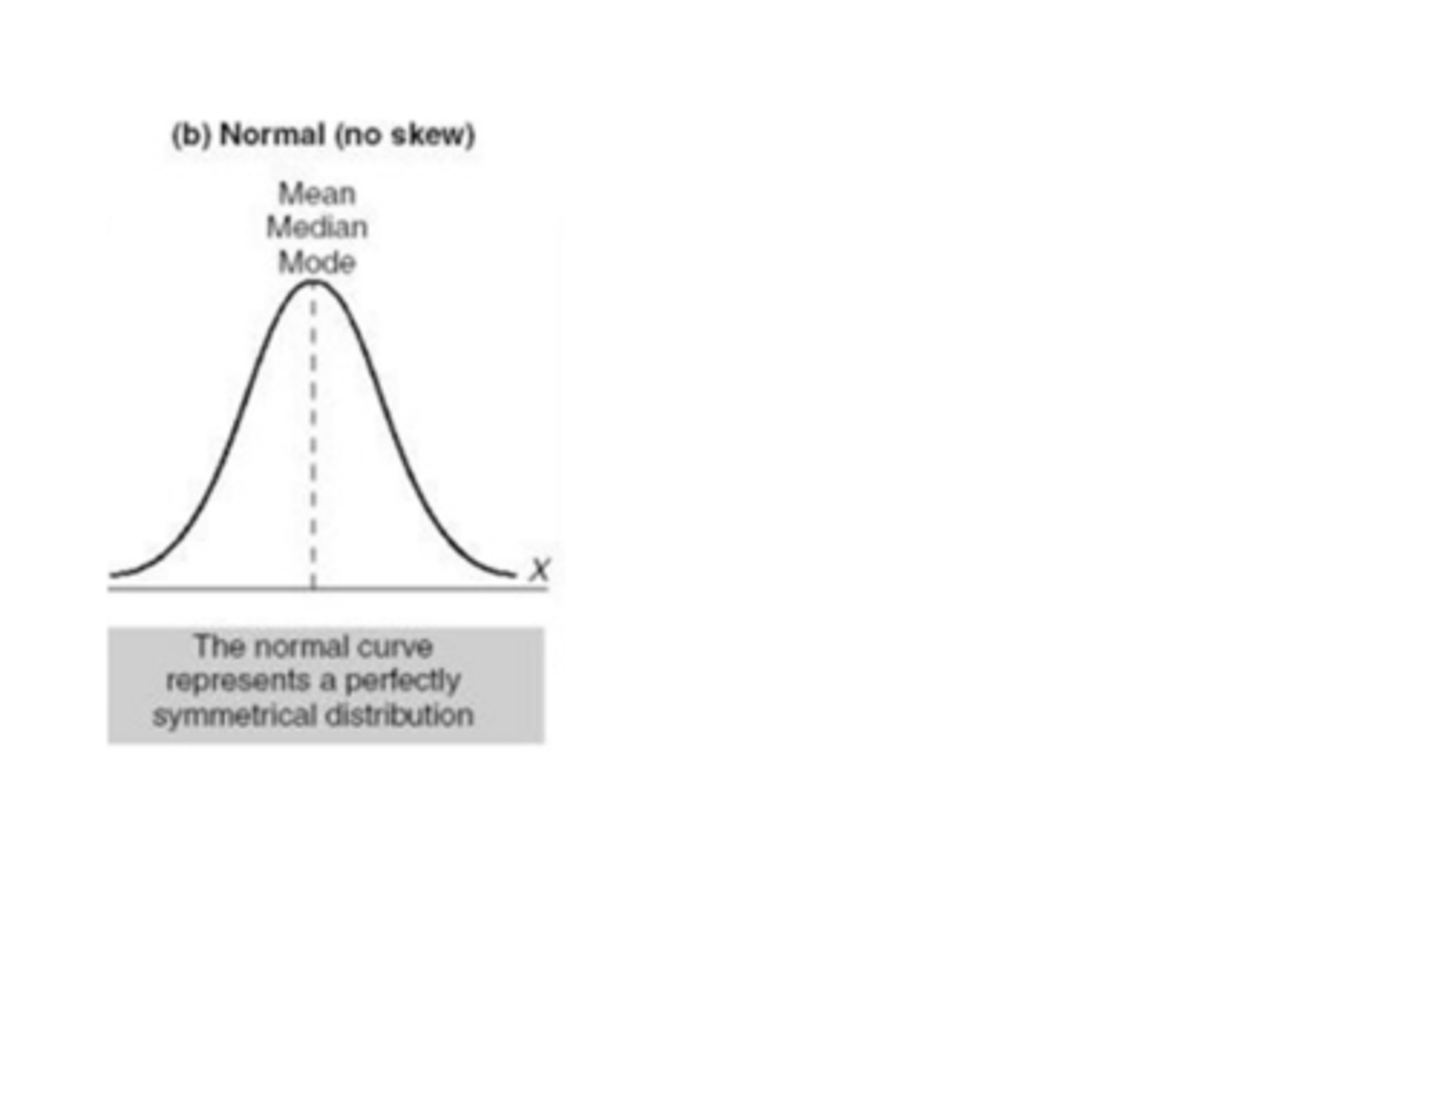
when a distribution is ___________, the mean and median are equal. (opposite isnt always true)
symmetric
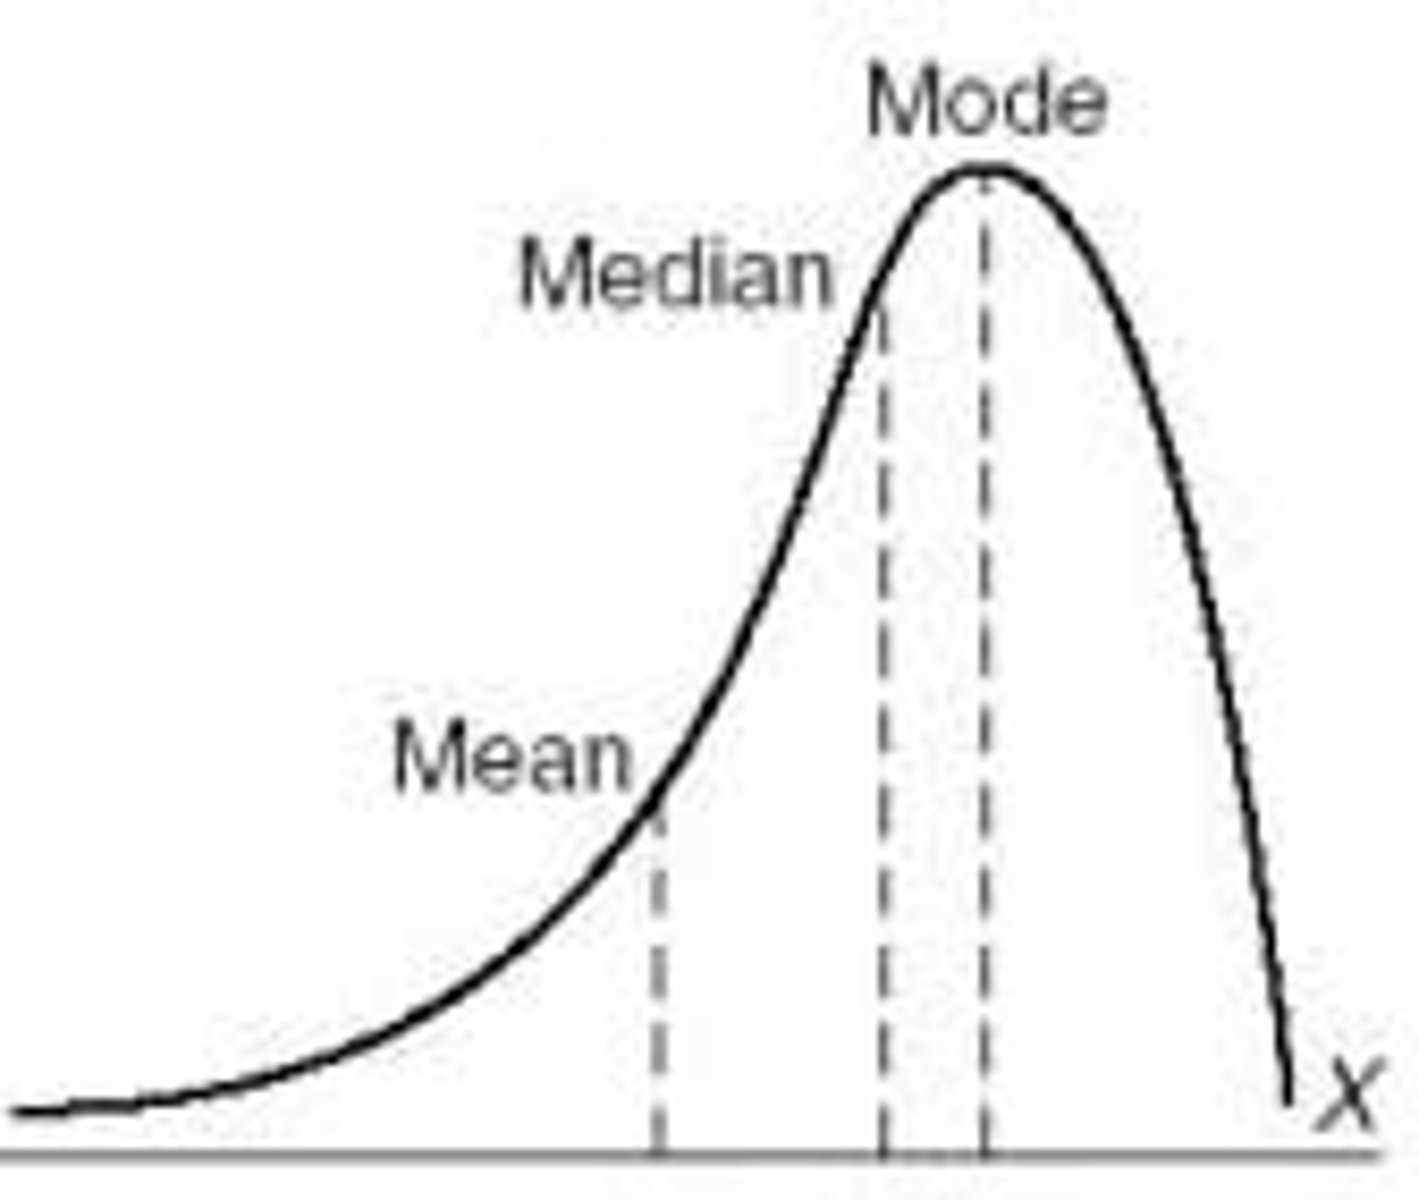
when a distribution is __________, the bulk of cases fall into the upper part of the distribution and the median is _______ than the mean.
negatively skewed (left), greater

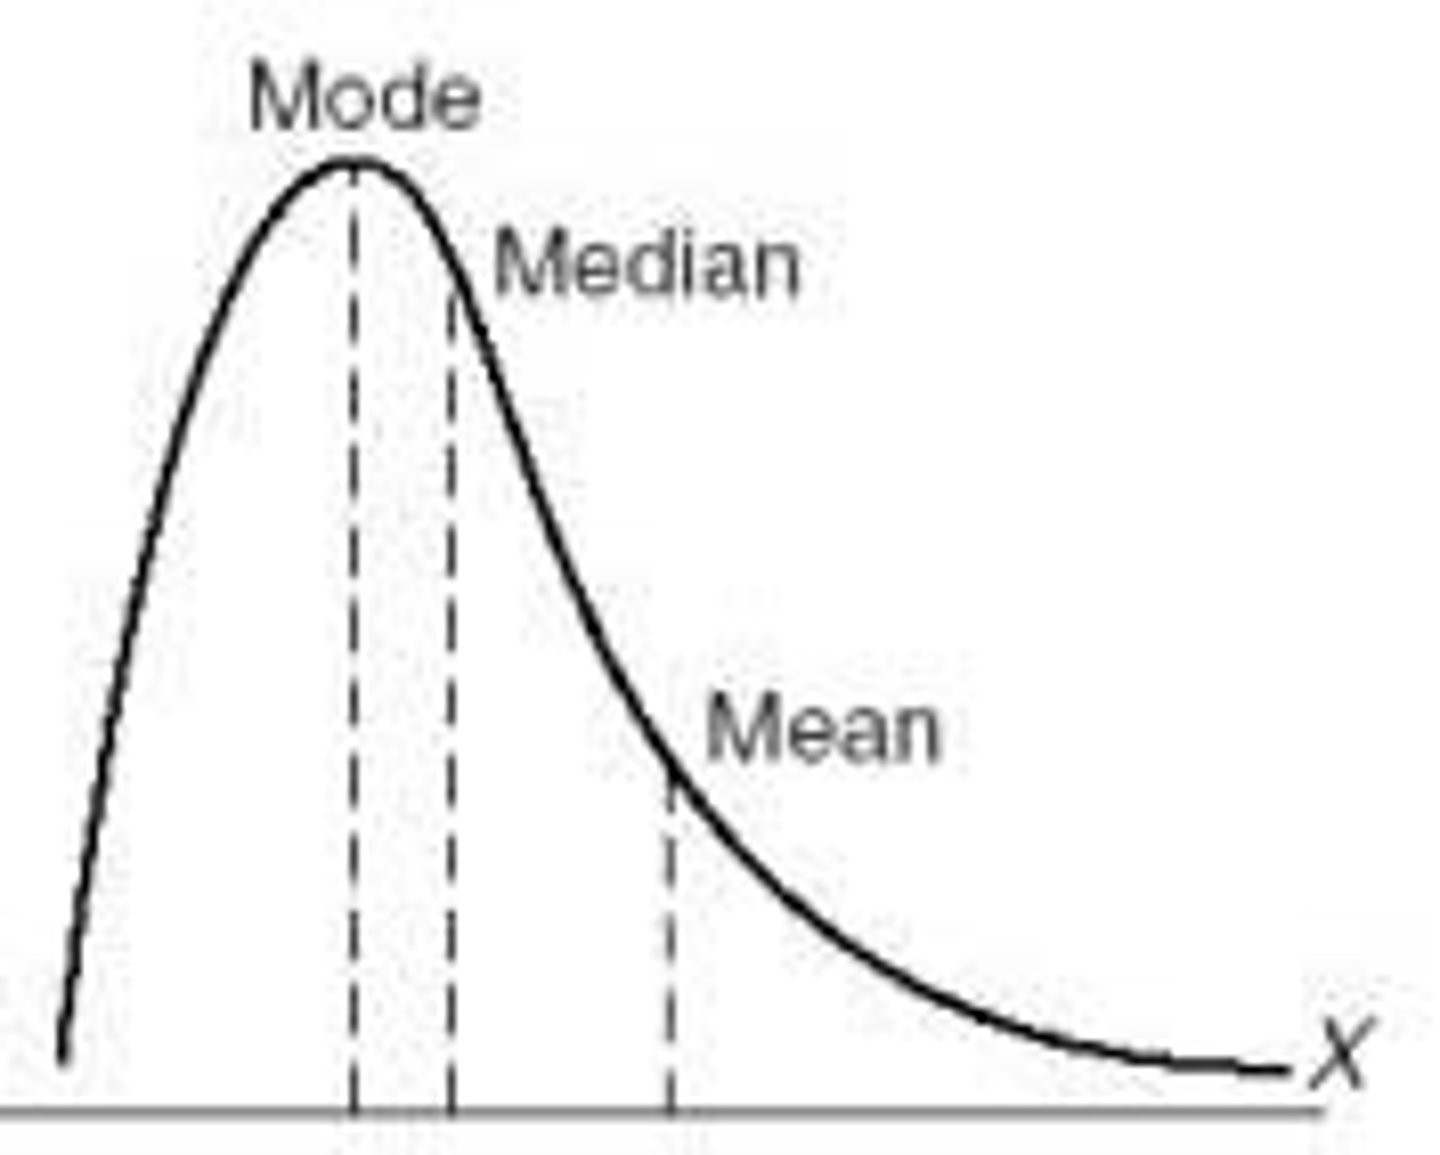
when a distribution is __________, the bulk of cases fall into the lower part of the distribution and the median is _______ than the mean.
positively skewed (right), lower

mean, median, mode for a normal distribution?
equal and centered
mean, median, mode for a positively skewed distribution?
mode less than median less than mean
mean, median, mode for a negatively skewed distribution?
mean less than median less than mode
"best guess" to make smallest absolute error?
median
"best guess" to be absolutely right?
mode
mean as "best guess" produces...
an error d
- average error is 0 over all cases
dispersion/spread
observations depart from central tendency
range
spread of distribution
range = high score - low score
deviation
departure of a case from given statistic
- from the mean: di = xi - x [sample mean]
- from the median: d'i = xi - Md
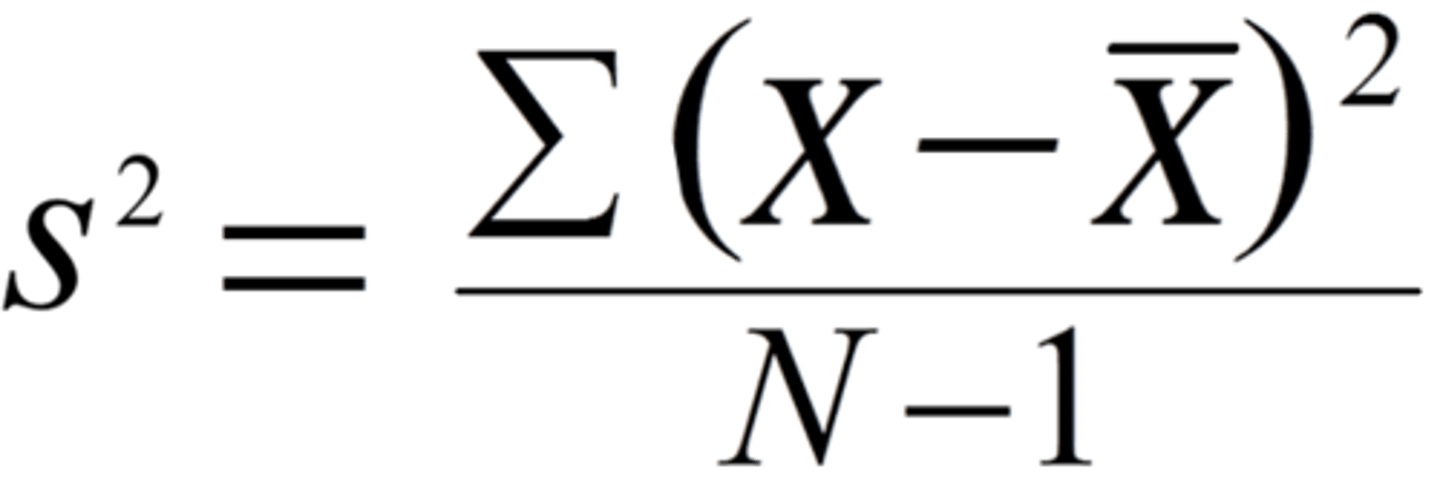
variance
spread of variability (average of the deviations about the mean)
- variance = 0 if all cases in distrubution are the same
- minimizies the sum of squared deviations
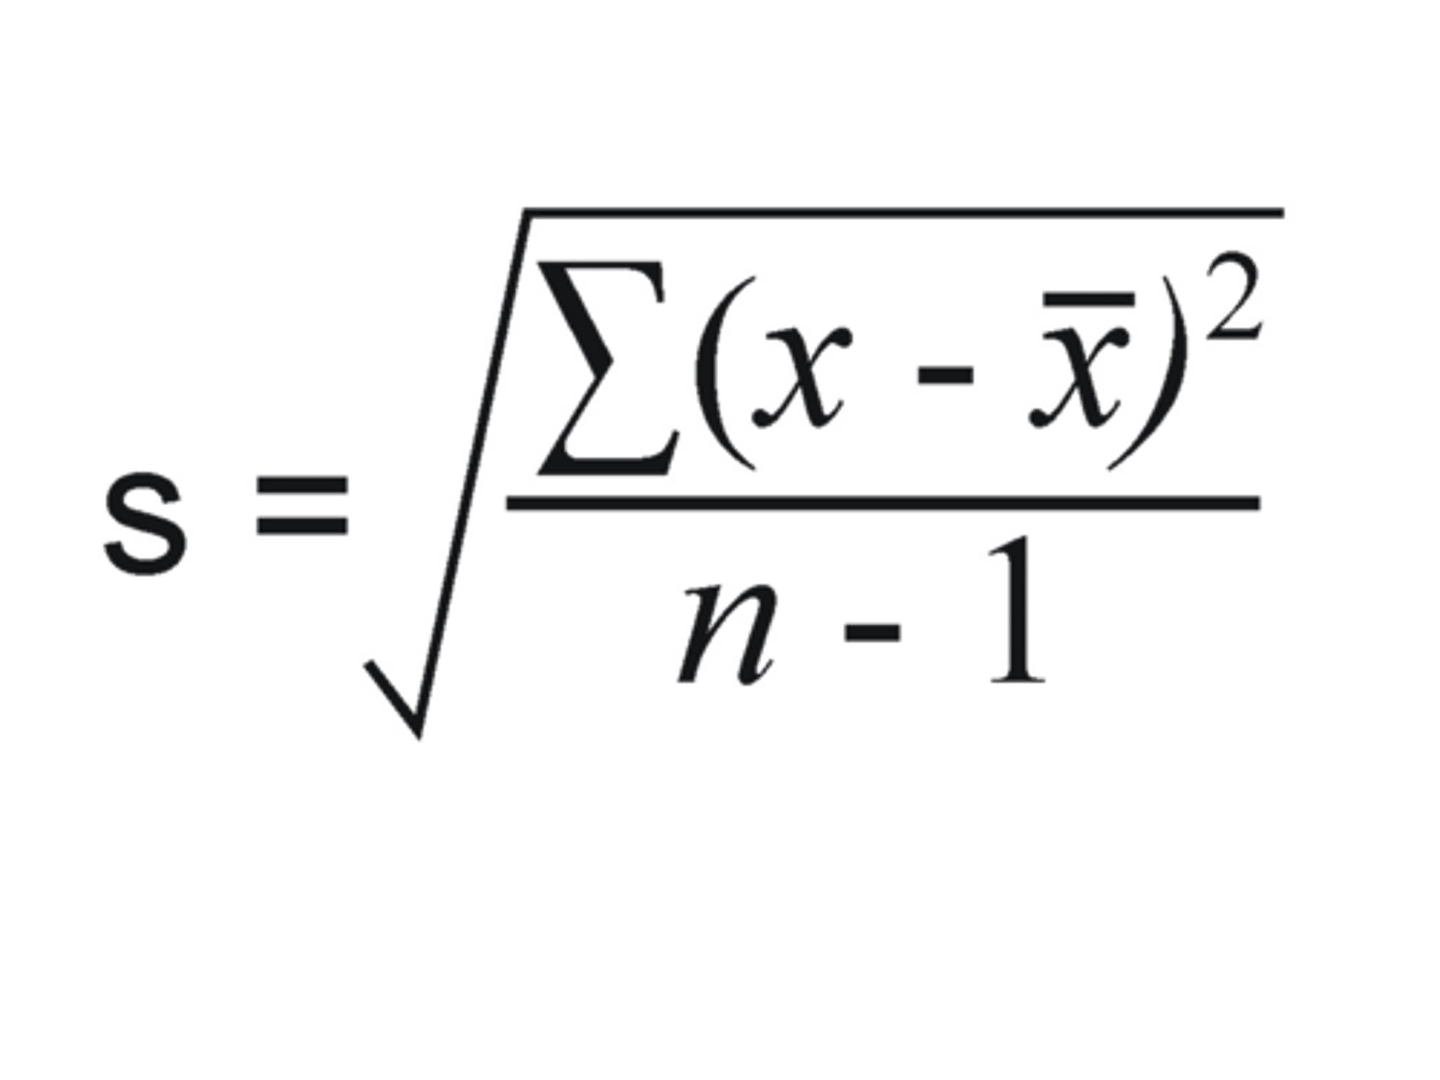
standard deviation
square root of variance
- index of variability
Interquartile Range
measure of variation not sensitive to outliers
--calc: split data into 2 sets, get median in each set, and subtract Q3 - Q1
less variability makes any guess _____ precise
more
normal distrubution
- theoretical distribution of variables as a symmetrical bell-shaped graph
- x axis is specific values x takes
- y axis is density function f(x)
- differs in location (mean) and scale (sd)
- most descriptive factors mean and variance/sd
standard normal distribution
mean = 0
sd = 1
qualities of normal distribution
- density function symmetric about mean
- mean is also mode and median
- 68% of area under curve is 1 SD away from mean
- 95% of area under curve is 2 SDs away from mean
- 99% of of area under curve is 3 SDs away from mean
properties of normal distribution
- distribution of sample means x is normal irrespective to size of N
- mean = mu
- standard error: SE = sd/sqrt(N)
- sample mean and sample variance independent IF population distribution is normal
a continuous variable has an ____________ number of possible outcomes
infinite
suppose you know the exact distrubution of a variable. Whats the probability of observing any particular value in the distribution?
ZERO
- if possible values are infinite, probability is ratio of something to infinity = 0 so we cant define probability for each outcome
density function
measures probability of each value
standardized score (z score)
- shows the relative status of a score in a distribution
- shows number of SDs above/below the mean
z = (xi - x[sample mean]) / s
- mean of z score should be 0 and sd should be 1
- does not change form of distribution
![<p>- shows the relative status of a score in a distribution</p><p>- shows number of SDs above/below the mean</p><p>z = (xi - x[sample mean]) / s</p><p>- mean of z score should be 0 and sd should be 1</p><p>- does not change form of distribution</p>](https://knowt-user-attachments.s3.amazonaws.com/d5363c59-f1e1-41bc-a2c9-673203828908.png)
What is the normal probability of a score of x=57.5 given a mean of 50 and sd of 5?
z = (57.5 - 50) / 5 = 1.5
-- from table, 1.5 sds from mean = .993 which is the probability of observing a z value less than or equal to 1.5 in a normal dist
- if negative, do 1 - .933 to get .067
if you get a score of 85 on two exam and the average score for both exams was 76. Did you perform equally well on both exams?
No, we need to know the spread of the distribution/variability
Central Limit Theorem
if population has finite mean mu and finite variance σ^2, the distrubution of sample means from samples of N observations makes normal distribution with mean mu and variance (σ^2)/N as sample size increases
---> when N is large, sampling distribution of the mean is normal
-- closer to normal original pop is, closer to normal sample dist of any size is
Sampling Distribution
collected data/statistics from a sample to try to "guess" what that statistic is in the population
--> theoretical probability distribution showing the relation between possible values of given statistic and their probability for samples of size N from population
what does a sampling distribution imply?
implies that the frequency distribution is not made from individual observations but from statistics of an infinite number of random samples of size N
How can we say that what we obtained from the sample reflects the characteristic of the population?
- bc of the central limit theorem which states that if the sample is random and large enough, the sampling distribution of the statistic will be centered at the population statistic
- if population has finite mean mu and variance σ^2, the sample distribution means approaches a normal distribution with mean mu and variance (σ^2)/N as sample size increases
x axis and y axis of sampling distribution
x axis represents values of sample statistic
y axis represents probability density
if the distribution of the original population is normal, the sampling distribution of the mean...
will also be normal regardless of the sample size
if we know the variability of the means, we know... (2 things)
1. by how much each sample of size n is expected to vary
2. how far we will be on average from the population mean by computing the sample mean
---> allows us to make inferences
the sample mean is an ________ estimator of mu
unbiased
the sampling distribution of the mean _______ match the population distribution
will not exactly
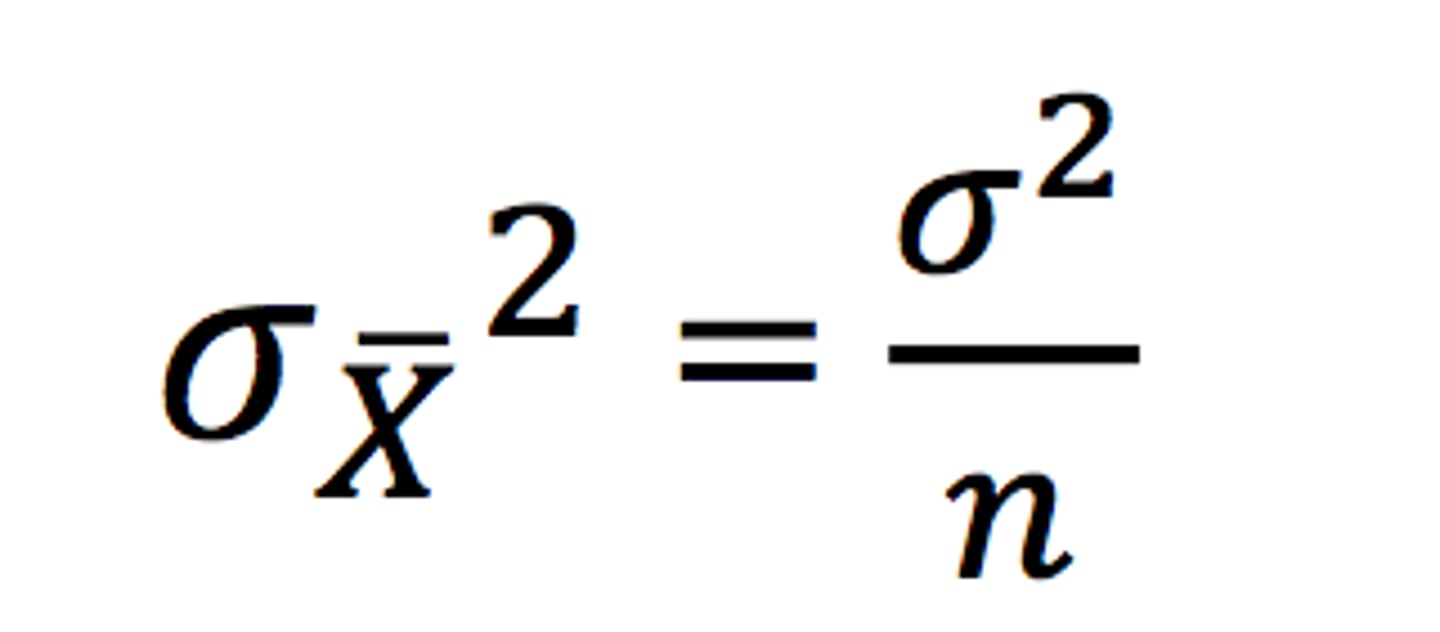
variance of sampling distribution
will be smaller than the populations variance by a factor of 1/N
--> σ^2 of sample = (σ^2 of pop) / N
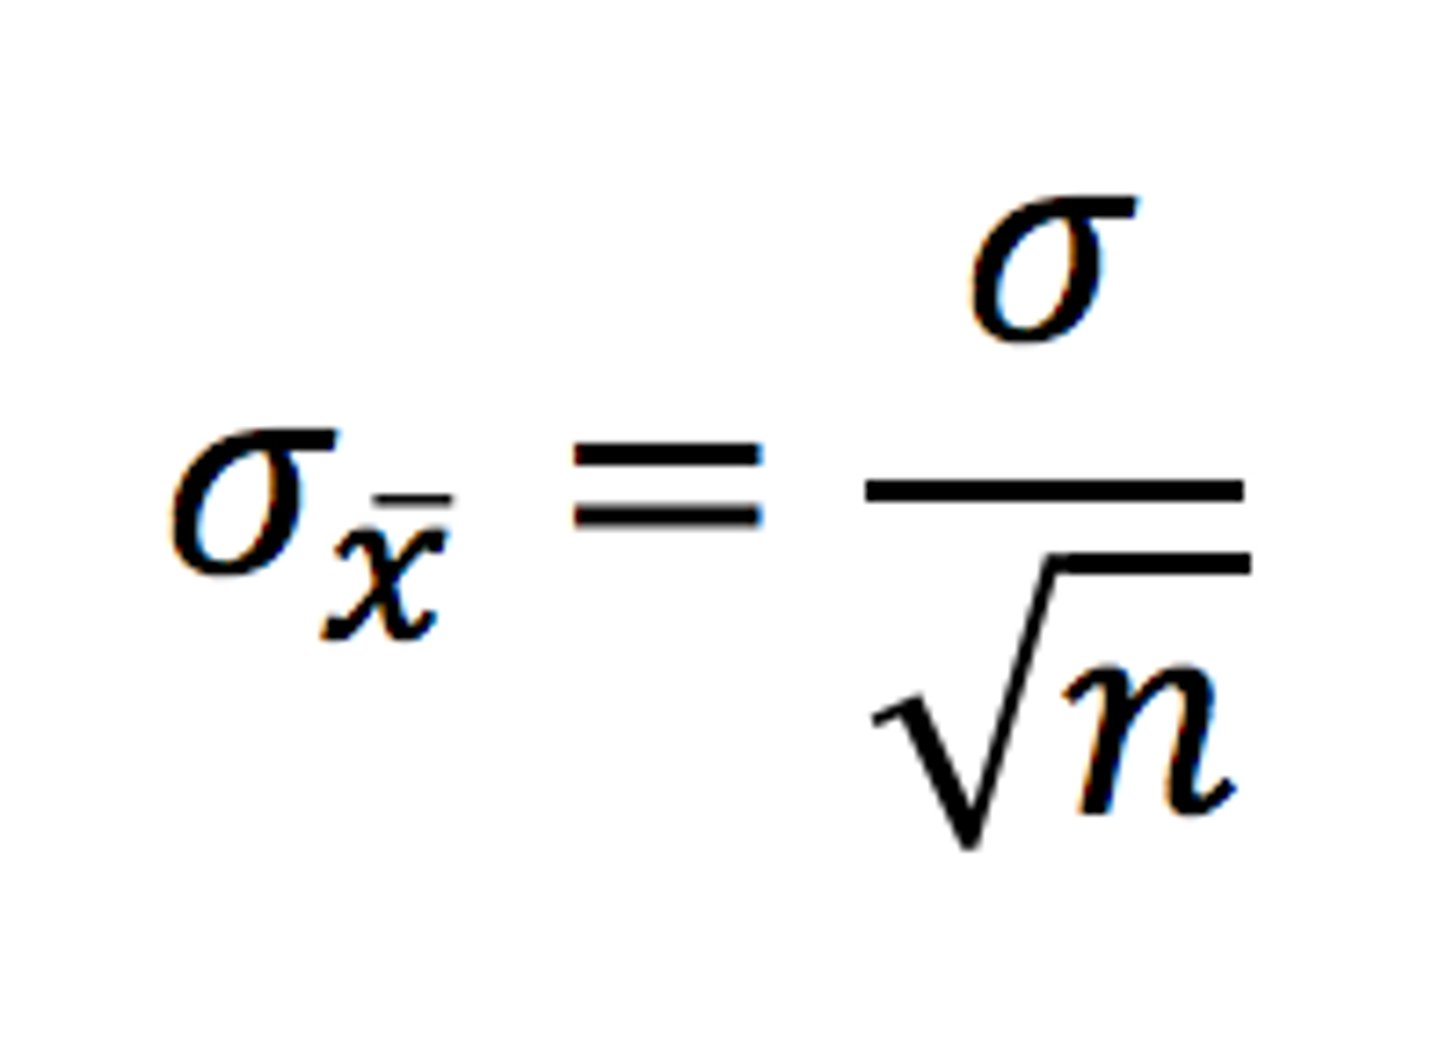
SD of the sampling distribution
standard error (SE)
-- σ of sample = (σ of pop) / sqrt(N)
--> denotes how far on average sample mean is from the population mean
the larger the sample size, the ______ the variance of the sampling distribution of the means, thus, the ______ probable it is that the sample mean approaches the population mean
- smaller the variance
- more probable
if the statistic is unbiased, the mean of the sampling distribution is ______
the true parameter value
if the statistic is consistent, as sample size increases, sampling variability _____
decreases
Properties of Sampling Distribution of the Mean (4 things)
1. expected value of the sample mean is the pop mean
2. variance of the sampling distribution of the mean will be smaller than the pop variance by 1/N
3. if the pop mean is normal, the sample mean is normal regardless of sample size
4. when N is large, sampling dist of the mean is normal regardless of pop dist
Estimators
formula or method for combining values occuring in data to infer pop parameters
Properties of Estimators
criteria to judge how effective stat is in inferring pop stat
1. statistic G is unbiased estimator of 0 when expected value of G over all samples is 0
--> sample mean UNbiased
--> sample variance biased
2. statistic G is consistent when the probability of G approaching 0 increased as sample size increases
--> sample mean and sample variance are consistent
3. statistic G is efficient estimator of 0 if there is no other estimator that has a smaller mean squared error (MSE)
--> MSE captures sampling variance and bias
4. statistic G efficient relative to statistic H (both unbiased) so that the stat with the smaller sampling variance (smaller SE) is more efficient
--> mean more efficient than median
5. statistic G is sufficient estimator of parameter 0 if it contains all info about 0
--> sample mean is sufficient when data is normal dist
what estimators feature most/all of the properties?
sample mean and sample variance
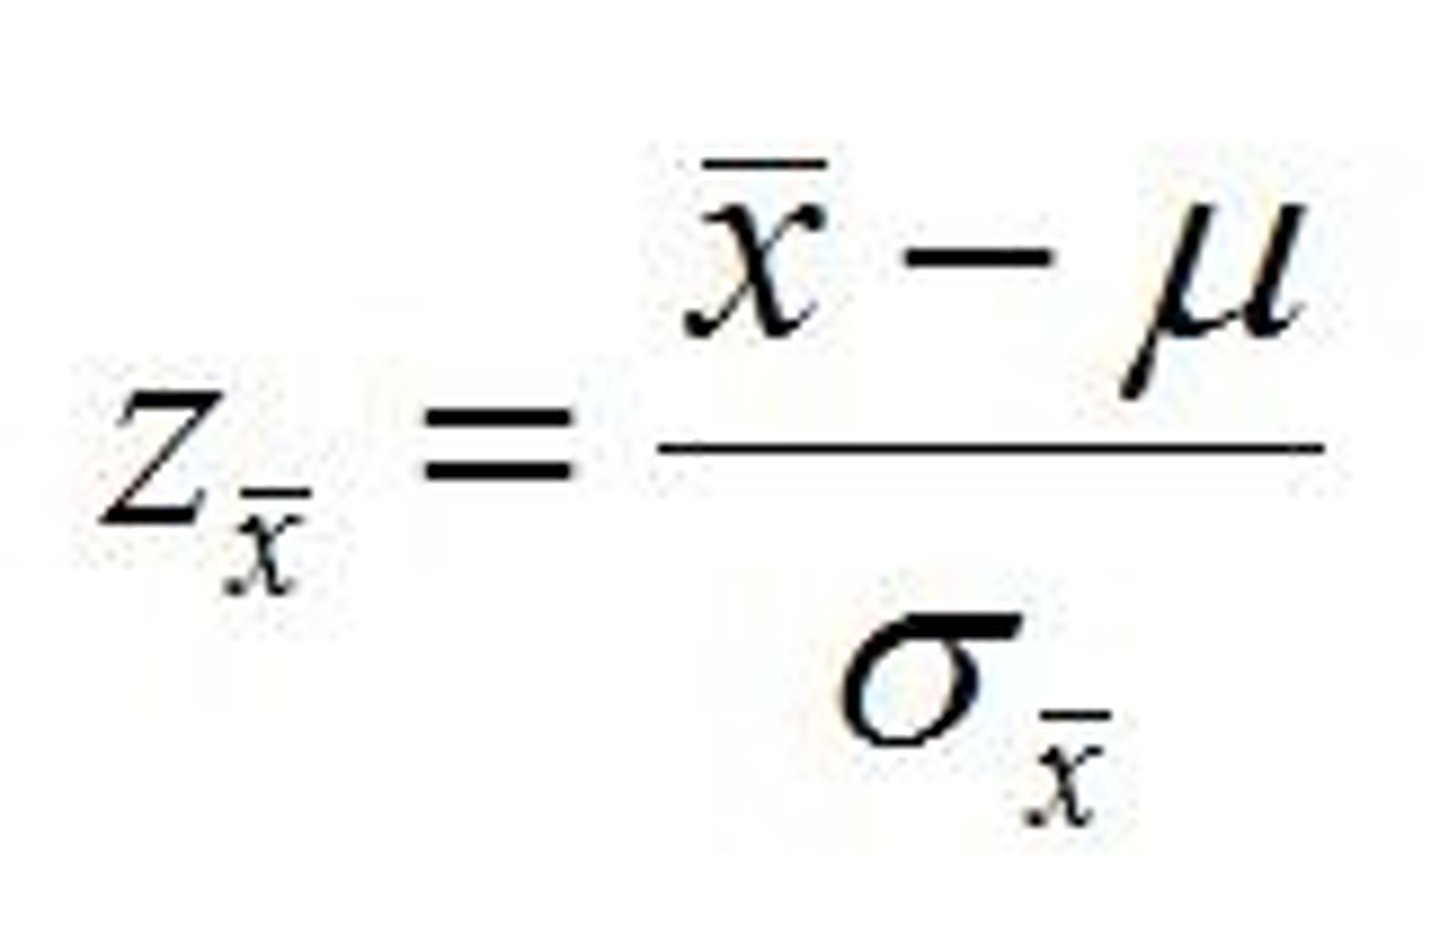
how to put sample mean into standard form?
z = (sample mean - mu) / SE
or
z = (sample mean - mu) / (σ/sqrt(N))
Example: given a population with mu = 20 and simga = 5, how likely is it to draw a mean = 30 with N = 2?
z = (30 - 20) / (5/sqrt(2))
what is the minimum variance estimator
sample mean
confidence intervals for the mean
areas of precision/uncertainty around point estimate
95% of the Z-values will fall between -1.96 and +1.96 means that...
95% of all possible sample means will fall within 1.96 SEs of the population mean
99% of the Z-values will fall between -2.58 and +2.58 means that...
99% of all possible sample means will fall within 2.58 SEs of the population mean
100% Confidence Interval for the mean
sample mean - infinityσx <= mu <= sample mean + infinityσx
when would you be interested in studying variability?
- check reliability/consistency (low variability = more dependable)
- to make inferences (affects confidence intervals and error margins)
variance vs standard deviation of sampling distribution
Variance
-- σ^2/N
-- how much sample mean varies squared from pop mean
Standard Deviation
-- σ/sqrt(N)
-- average amount sample mean deviates from pop mean