Statistics I, VL02
1/11
There's no tags or description
Looks like no tags are added yet.
Name | Mastery | Learn | Test | Matching | Spaced |
|---|
No study sessions yet.
12 Terms
construction stem-and-leaf plot
1. Sort the data in ascending order and draw a vertical line
2. Group the data into classes of equal size, number of classes = 10*log(n)
3. To the left of the line, write down the first digit(s); these form the stem.
4. To the right of the line, write down the next rounded digit of each observation; these form the leaves.
construction histogram
1. Group the data into classes [c0, c1), [c1, c2), ... with class width d1 = c1 - c0, ...
2. Compute the relative frequencies of the classes f1, f2, ...
3. Draw rectangles with widths d1, d2, ... and heights f1/d1, f2/d2, ...
histogram: unimodal distribution
one peak
histogram: bimodal distribution
two peaks
histogram: multimodal distribution
more than one peak
histogram: symmetric distribution
left half is a mirror image of the right half
histogram: right-skewed distribution
long tail to the right
histogram: left-skewed distribution
long tail to the left
empirical cumulative distribution function (ecdf)
- gives the fraction of observation less than or equal to a particular value x
- N(x) = ∑ n(ai), F(x) = N(x)/n
The mode xmod ....
gives the value of X that occurs most often
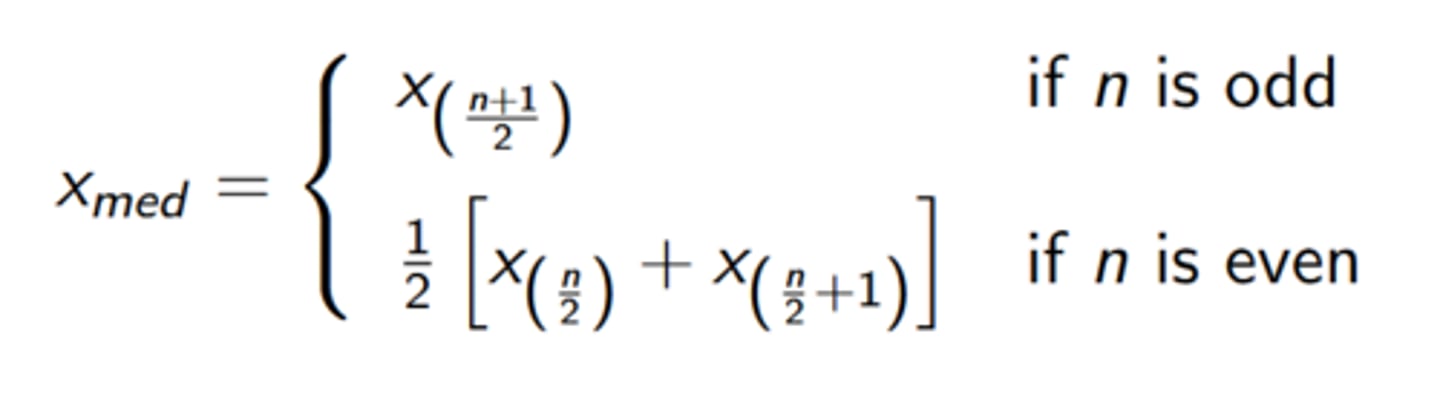
median
- "middle value" of the data
- appropriate for ordinal scales, most common measure of location for ordinal variables
- resistant to outliers, frequently used for metric variables
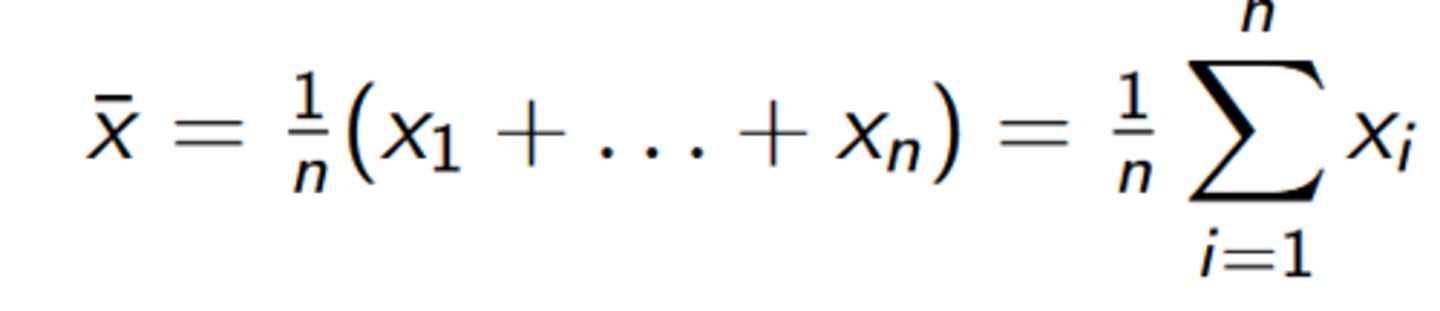
arithmetic mean
average