A level Bio 2.3 Transport across Membranes part II
1/8
Earn XP
Description and Tags
Name | Mastery | Learn | Test | Matching | Spaced | Call with Kai | Chat |
|---|
No analytics yet
Send a link to your students to track their progress
9 Terms
A group of students carried out an investigation to find the water potential of potato tissue.
The students were each given a potato and 50 cm3 of a 1.0 mol dm−3 solution of sucrose.
• They used the 1.0 mol dm−3 solution of sucrose to make a series of different concentrations.
• They cut and weighed discs of potato tissue and left them in the sucrose solutions for a set time.
• They then removed the discs of potato tissue and reweighed them.
The table below shows how one student presented his processed results.
| Concentration of sucrose solution / mol dm−3 | Percentage change in mass of potato tissue |
| 0.15 | +4.7 |
| 0.20 | +4.1 |
| 0.25 | +3.0 |
| 0.30 | +1.9 |
| 0.35 | −0.9 |
| 0.40 | −3.8 |
Describe how you would use a 1.0 mol dm−3 solution of sucrose to produce 30 cm3 of a 0.15 mol dm−3 solution of sucrose. (2)
Add 4.5cm3 of (1.0 mol dm-3) solution to 25.5cm3 (distilled) water (2)
A group of students carried out an investigation to find the water potential of potato tissue.
The students were each given a potato and 50 cm3 of a 1.0 mol dm−3 solution of sucrose.
• They used the 1.0 mol dm−3 solution of sucrose to make a series of different concentrations.
• They cut and weighed discs of potato tissue and left them in the sucrose solutions for a set time.
• They then removed the discs of potato tissue and reweighed them.
The table below shows how one student presented his processed results.
Concentration of sucrose solution / mol dm−3 | Percentage change in mass of potato tissue |
0.15 | +4.7 |
0.20 | +4.1 |
0.25 | +3.0 |
0.30 | +1.9 |
0.35 | −0.9 |
0.40 | −3.8 |
Describe how you would use the student’s results in the table above to find the water potential of the potato tissue. (3)
Plot a graph with concentration on the x-axis and percentage change in mass on the y-axis (1)
Find concentration where curve crosses the x axis/where percentage change is zero (1)
Use (another) resource to find water potential of sucrose concentration (where curve crosses x-axis (1)
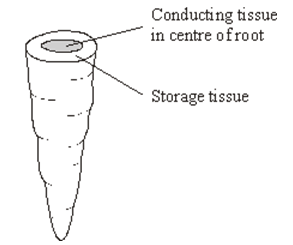
The diagram shows a carrot
A group of students investigated the effect of sucrose concentration on the length of cylinders cut from a carrot.
The students used a cork borer to cut cylinders from the carrot. Describe how the students should cut these cylinders to make sure that this was a fair test and would produce reliable results. (2)
Lengthways/down the root (1)
Through one tissue only/through the same part/same proportion of tissue (1)

The diagram shows a carrot
A group of students investigated the effect of sucrose concentration on the length of cylinders cut from a carrot.
They measured the initial length of each cylinder then placed the cylinders into test tubes containing different concentrations of sucrose solution. Bungs were placed in the tubes, and the tubes were left overnight. Explain why the bungs were placed in the tubes. (2)
To prevent the water from evaporating / prevent evaporation (1)
Changing the concentrations / water potential (of solution) (1)
A student investigated the effect of putting cylinders cut from a potato into sodium chloride solutions of different concentration. He cut cylinders from a potato and weighed each cylinder. He then placed each cylinder in a test tube. Each test tube contained a different concentration of sodium chloride solution. The tubes were left overnight. He then removed the cylinders from the solutions and reweighed them.
Before reweighing, the student blotted dry the outside of each cylinder. Explain why (2)
We only want to measure water taken up or lost (1)
Amount of water on cylinder varies/ ensures the same amount of water on outside (1)
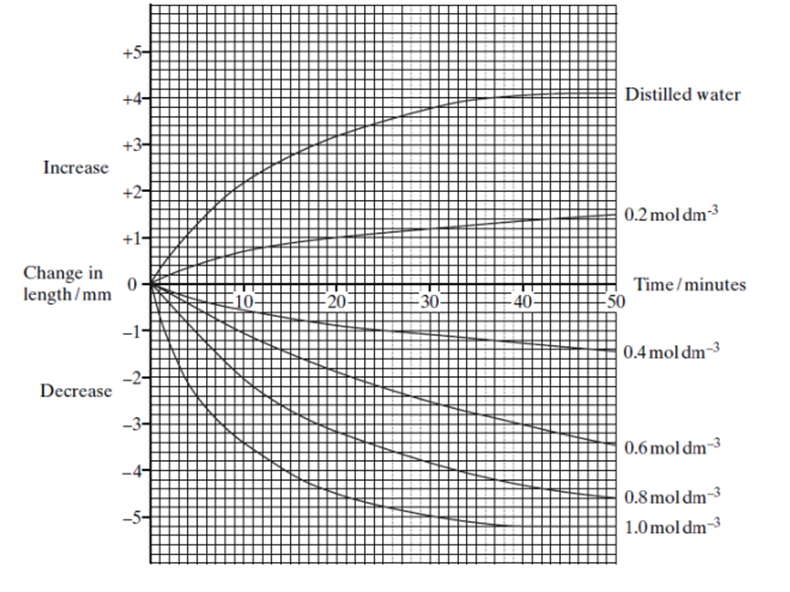
Six cylinders of a standard size were cut from a single large potato. One cylinder was placed in distilled water and the others were placed in sucrose solutions of different concentrations. The length of each cylinder was measured every 5 minutes for the next 50 minutes.
The graph shows the changes in length at each sucrose concentration
Explain why
the potato cylinder in distilled water increased in length (2)
Potato has a more negative water potential (1)
water enters by osmosis causing cells to extend/become turgid (1)

Six cylinders of a standard size were cut from a single large potato. One cylinder was placed in distilled water and the others were placed in sucrose solutions of different concentrations. The length of each cylinder was measured every 5 minutes for the next 50 minutes.
The graph shows the changes in length at each sucrose concentration
Explain why the potato cylinder in the 1.0 mol dm–3 sucrose solution showed no further decrease in length after 40 minutes. (2)
water potentials are equal/at equilibrium/isotonic (1)
no net movement of water (1)

Six cylinders of a standard size were cut from a single large potato. One cylinder was placed in distilled water and the others were placed in sucrose solutions of different concentrations. The length of each cylinder was measured every 5 minutes for the next 50 minutes.
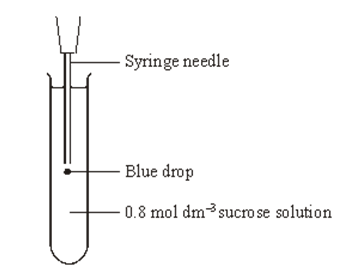
After 45 minutes the potato cylinder in the 0.8 mol dm–3 solution was removed and blue dye added to this solution. Some of this blue-stained solution was drawn into a syringe. A drop was then released, slowly, halfway down a test tube of fresh 0.8 mol dm–3 sucrose solution as shown in the diagram. The blue drop quickly moved to the surface of the liquid in the test tube.
The density of a solution depends on its concentration. The more concentrated the solution the greater its density. Explain why the blue drop had a lower density and therefore moved up. (2)
water moved into the solution from the potato (1)
solution diluted/become less concentrated (1)
Six cylinders of a standard size were cut from a single large potato. One cylinder was placed in distilled water and the others were placed in sucrose solutions of different concentrations. The length of each cylinder was measured every 5 minutes for the next 50 minutes.
After 45 minutes the potato cylinder in the 0.8 mol dm–3 solution was removed and blue dye added to this solution. Some of this blue-stained solution was drawn into a syringe. A drop was then released, slowly, halfway down a test tube of fresh 0.8 mol dm–3 sucrose solution as shown in the diagram. The blue drop quickly moved to the surface of the liquid in the test tube.
A sucrose solution of concentration 0.3 mol dm–3 has a water potential which is equivalent to that of the potato cells. Describe and explain what would happen to the blue drop from this solution. (2)
no net movement of water (in or out) (1)
drops move up/less dense (1)