AP Environmental Science: Populations, Growth, and Demographic Transition
1/83
There's no tags or description
Looks like no tags are added yet.
Name | Mastery | Learn | Test | Matching | Spaced |
|---|
No study sessions yet.
84 Terms
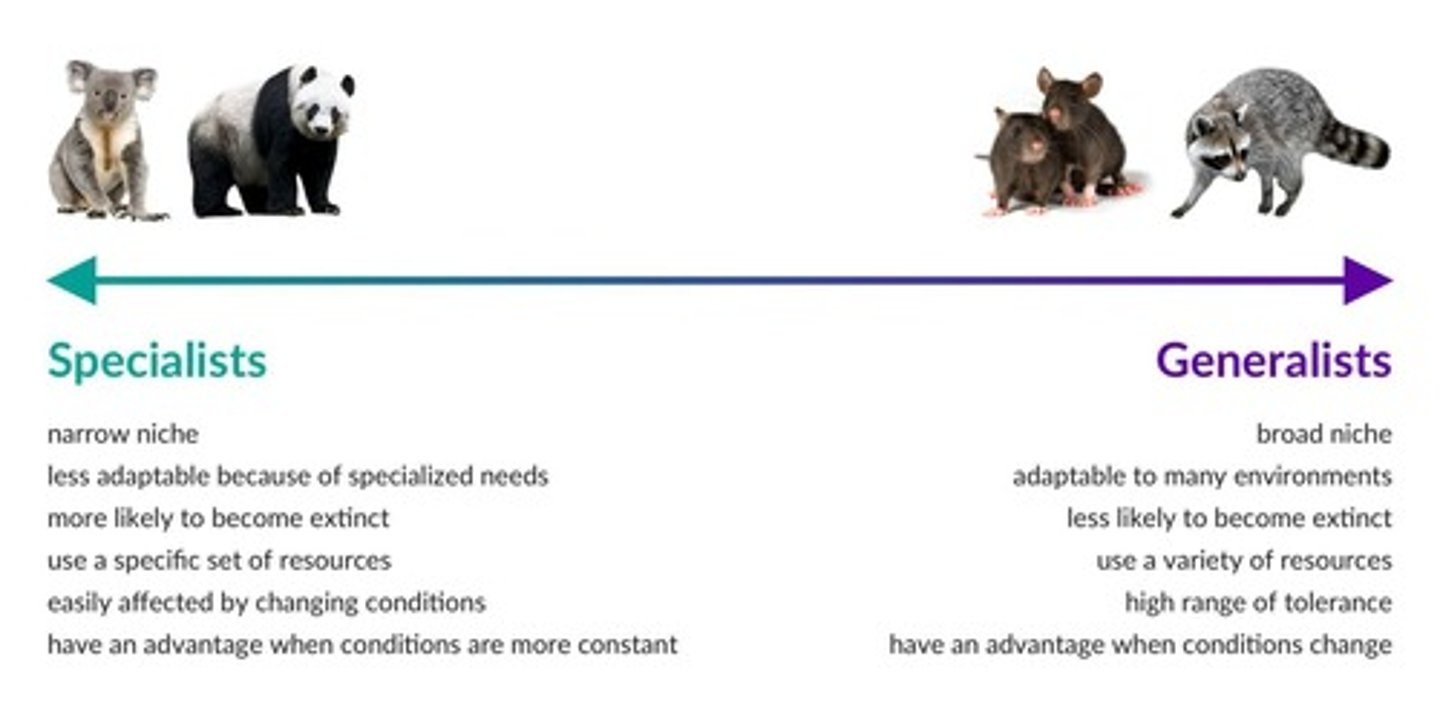
Specialist Species
Species with a smaller range of tolerance or narrower ecological niche, making them more prone to extinction.
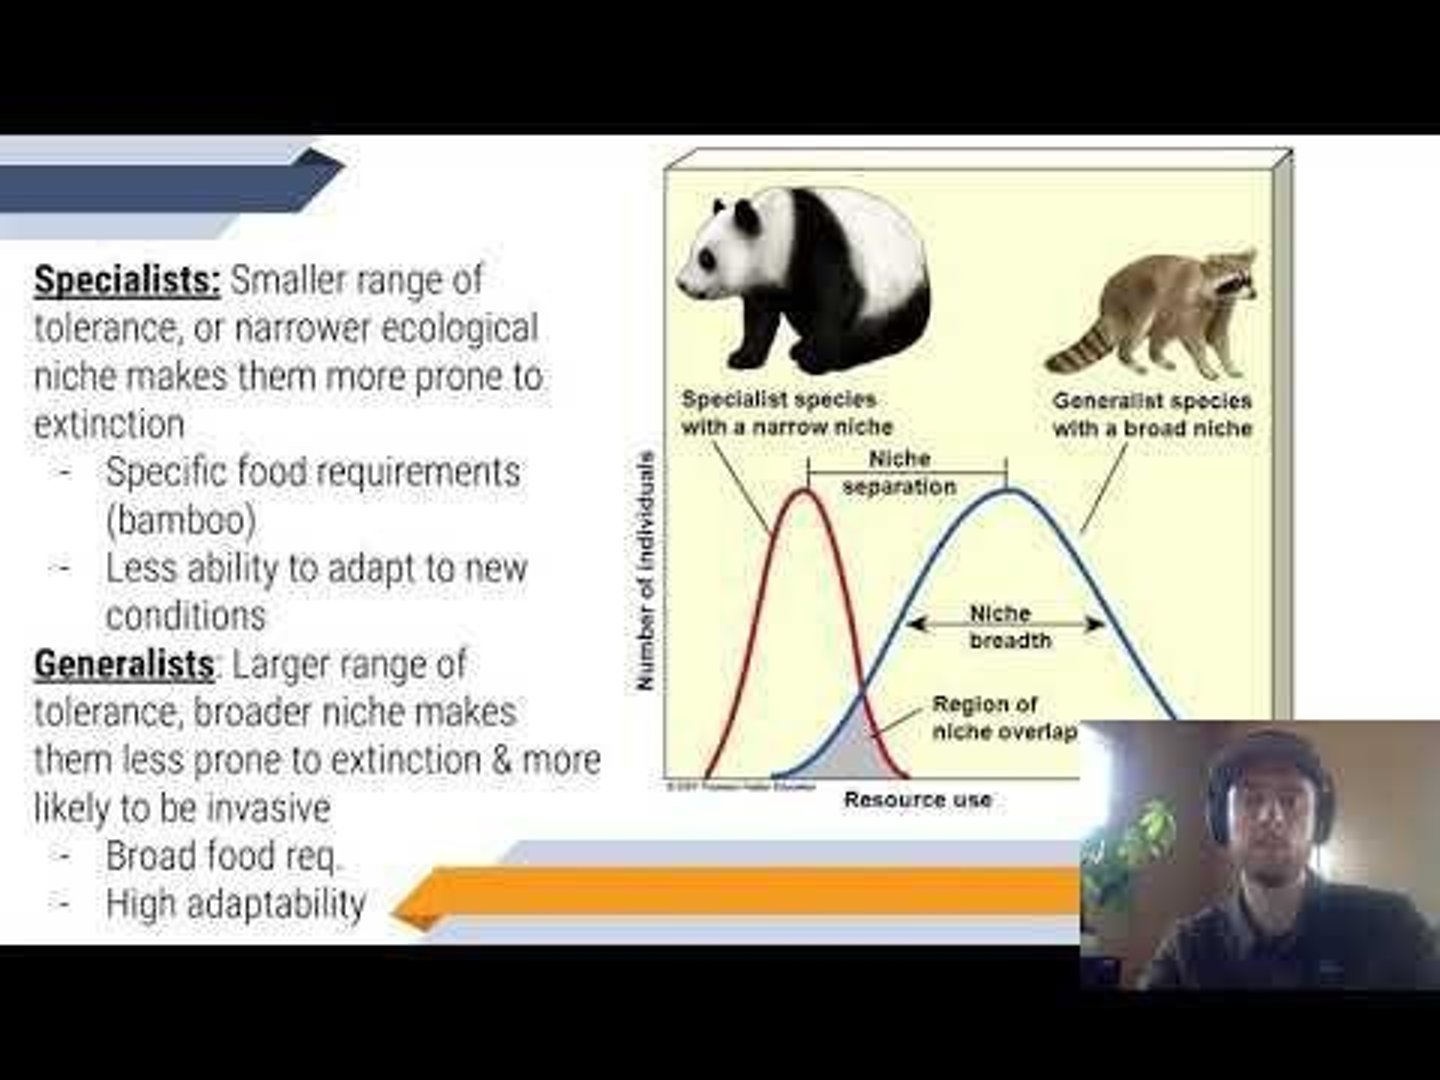
Generalist Species
Species with a larger range of tolerance and broader niche, making them less prone to extinction and more likely to be invasive.
R-selected Species
Species characterized by high biotic potential, many offspring, little to no parental care, and a short lifespan.
K-selected Species
Species characterized by low biotic potential, few offspring, heavy parental care, and a long lifespan.
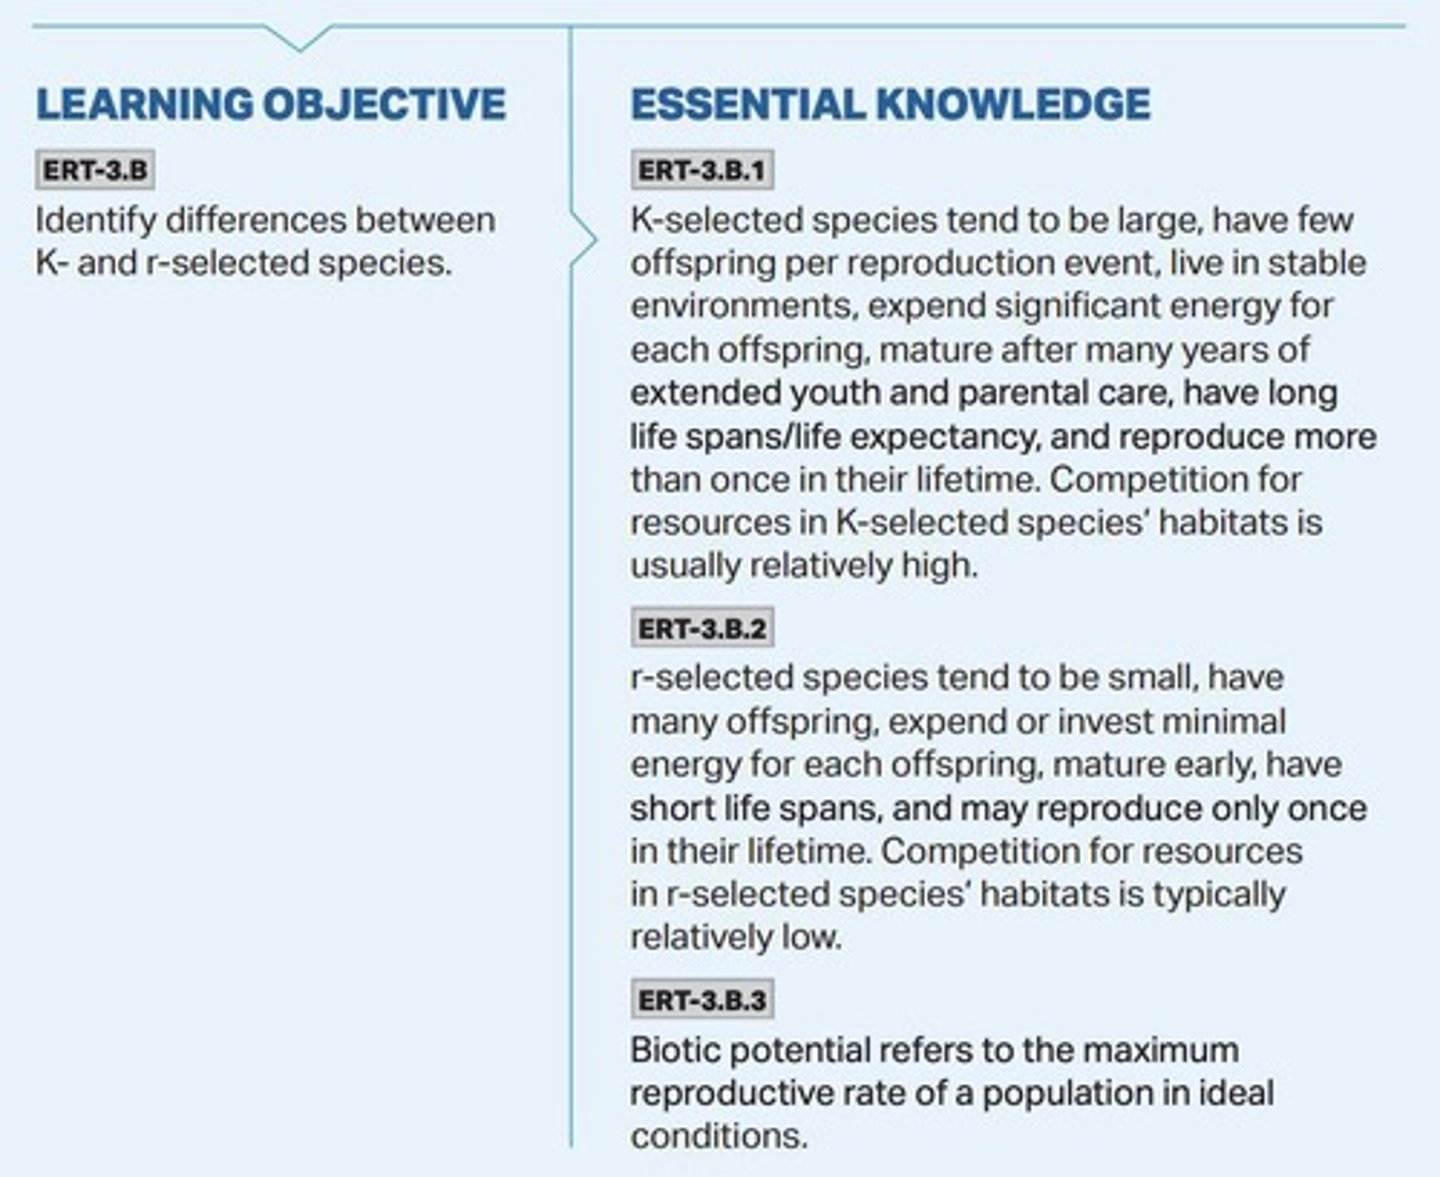
Biotic Potential
The maximum reproductive capacity of an organism under optimal environmental conditions.
Parental Care Spectrum
The range of parental investment in offspring, from high care in K-selected species to low care in r-selected species.
Survivorship Curve
A graph that shows the survival rate of a cohort (group of same-aged individuals) in a population from birth to death.
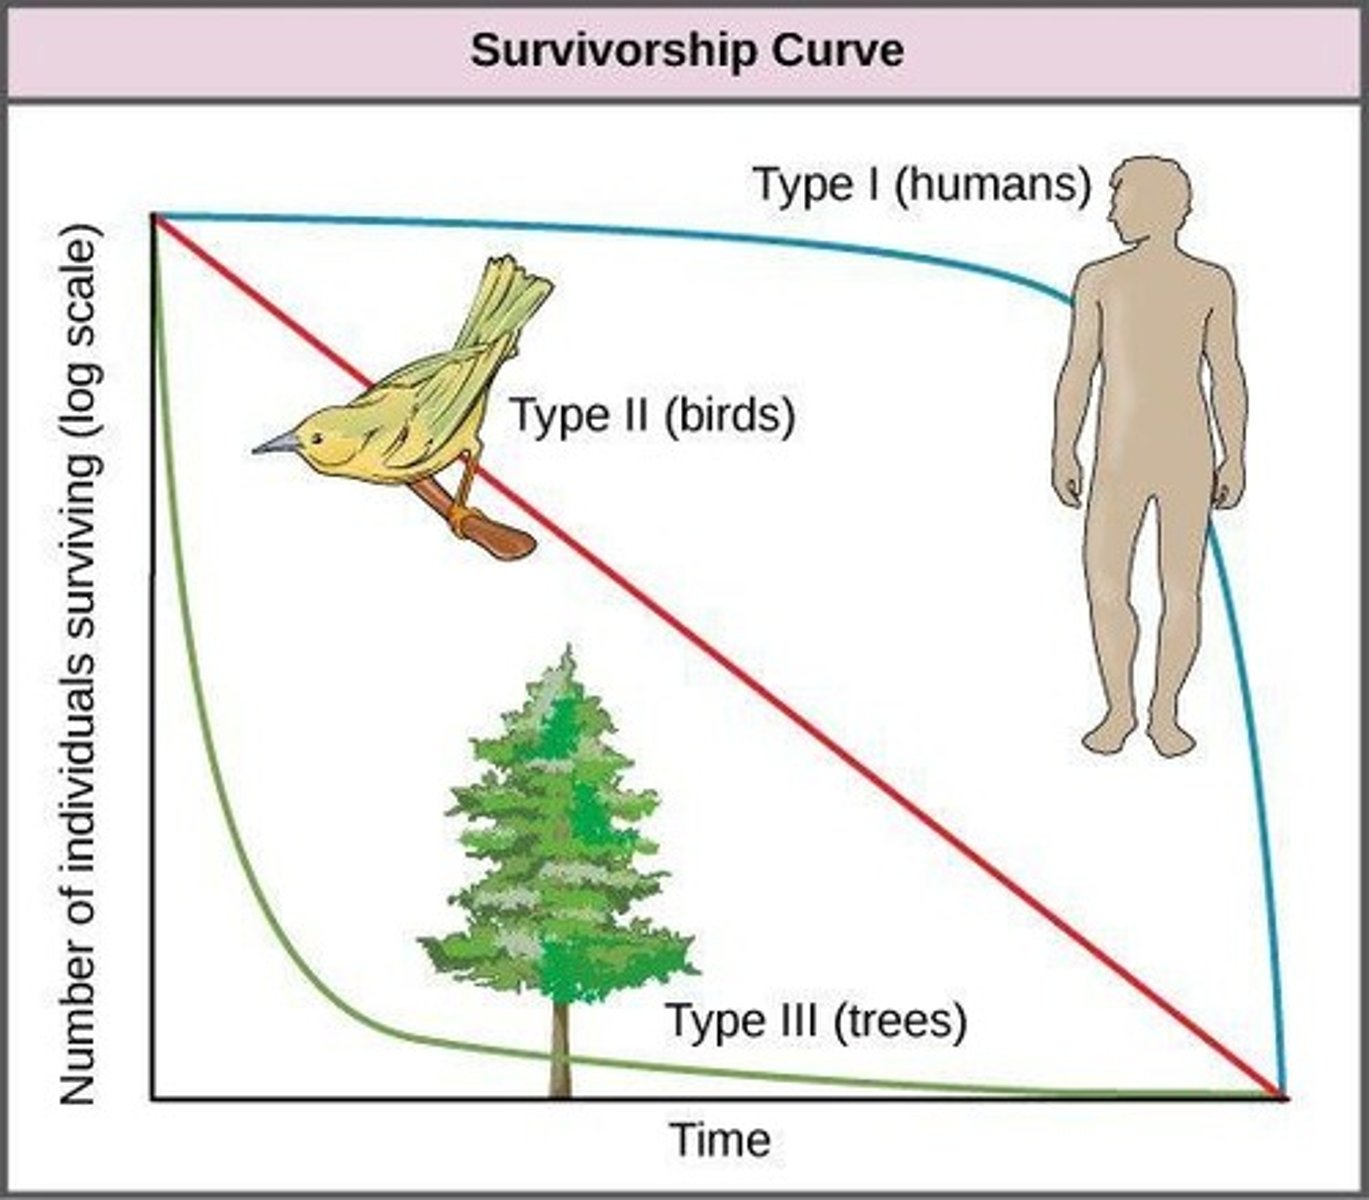
Type I Survivorship Curve
Characterized by high survivorship early in life due to high parental care, with a rapid decrease in survivorship in late life.
Type II Survivorship Curve
Characterized by steadily decreasing survivorship throughout life.
Type III Survivorship Curve
Characterized by high mortality early in life due to little to no parental care, with few making it to adulthood.
Invasiveness
The ability of a species to spread rapidly and outcompete native species for resources.
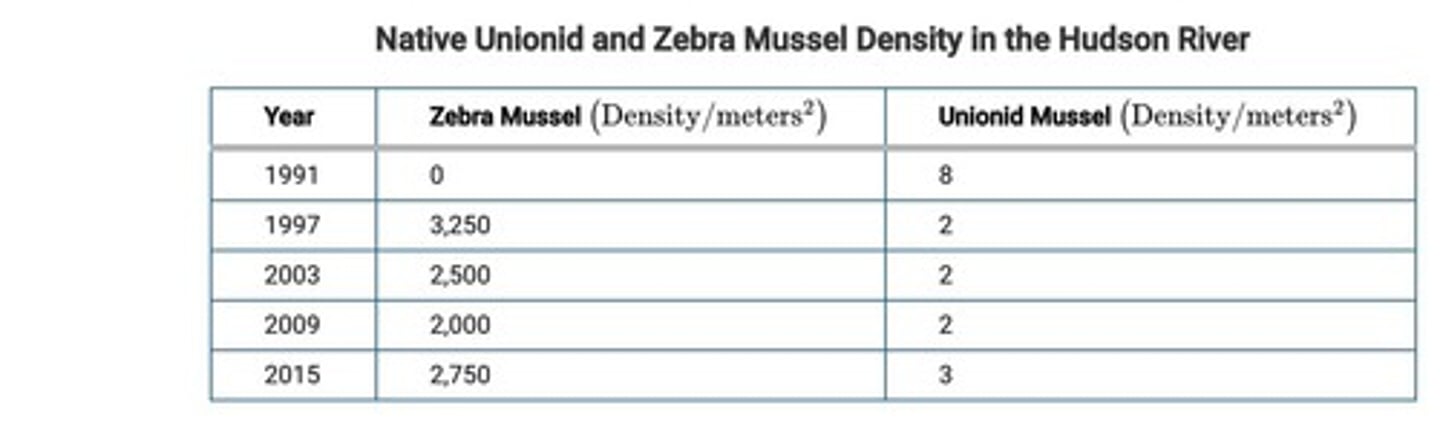
Population Density
The number of individuals of a species per unit area or volume.
Hudson River
A river in New York where the relationship between Zebra Mussel and Unionid Mussel population density is studied.
Extinction Risk
The likelihood of a species becoming extinct due to various factors, including ecological niche and adaptability.
Adaptability
The ability of a species to adjust to changes in environmental conditions.
Ecological Niche
The role and position a species has in its environment, including all interactions with biotic and abiotic factors.
Rapid Population Growth
A characteristic of r-selected species, often resulting in a higher chance of adaptation and lower chance of extinction.
Disturbance
An event that disrupts ecosystem structure and function, impacting species survival and population dynamics.
Invasive Species
Non-native species that spread widely in a new habitat, often causing harm to native species and ecosystems.
Reproductive Events
Instances of reproduction that can vary in frequency between r-selected and K-selected species.
Mortality Rate
The rate at which individuals in a population die, which can influence survivorship curves.
Cohort
A group of individuals of the same age within a population.
Environmental Change
Alterations in the environment that can affect species survival and population dynamics.
Carrying Capacity (k)
the max. number of individuals in a pop. that an ecosystem can support (based on limiting resources)
Die-off
sharp decrease in pop. size when resource depletion (overshoot) leads to many individuals dying
Overshoot
when a population briefly exceeds carrying capacity
Consequence of overshoot
resource depletion, e.g., overgrazing in deer
Example of Die-off
Reindeer of St. Paul Island: 25 introduced in 1910, growth was gradual (10'-30'), then exponential (30'-37'), carrying capacity was overshot, sharp die-off led to pop. crash as food resource (lichen) was severely depleted
Population Characteristics
Size (N): total # of individuals in a given area at a given time
Density
# of individuals/area, e.g., (12 panthers/km2)
Distribution
how individuals in pop. are spaced out compared to each other: Random (trees), Uniform (territorial animals), Clumped (herd/group animals)
Sex Ratio
ratio of males to females; closer to 50:50, the more ideal for breeding (usually)
Density-Independent Factors
factors that influence pop. growth independent of their size
Density-Dependent Factors
factors that influence pop. growth based on size, e.g., natural disasters (flood, hurricane, tornado, fire)
Example of Density-Dependent Factor
Food is a density dependent factor (also a limiting resource); when twice as much food was added to the dish, both species increased carrying capacity by about 2x
Logistic Growth
initial rapid growth, then limiting factors limit pop. to K
Calculating Population Change
Population Size = (Immigrations + births) - (immigrations + deaths)
Example of Population Change Calculation
An elk pop. of 52 elk has 19 births and 6 deaths in a season, and 5 new elk immigrate to the herd and 0 elk emigrate from the herd: (19+5) - (6+0) = + 18 elk; 52 + 18 = 70 elk
Percent Change in Population Size
Calculate the percent change in the population size of a 14 wolf pack that experiences 5 deaths, 3 births, and 4 new wolves released into the pack from a nearby wildlife sanctuary.
Age Cohorts
Groups of similarly aged individuals.
Prerproductive Age
Individuals aged 0-14.
Reproductive Age
Individuals aged 15-44.
Post Reproductive Age
Individuals aged 45 and older.
Growth Rate
Indicated by the size difference between age cohorts 0-14 and 15-44.
Extreme Pyramid Shape
Indicates rapid population growth.
Less Extreme Pyramid
Indicates slow, stable population growth.
House Shape
Indicates stable population with little to no growth.
Narrowest at Base
Indicates a declining population.
Infant Mortality Rate (IMR)
Number of deaths of children under 1 year per 1,000 people in a population.
Total Fertility Rate (TFR)
Average number of children a woman in a population will bear throughout her lifetime.
Replacement Level Fertility
The TFR required to offset deaths in a population and keep population size stable.
Factors in IMR Decline
More reliable food supply, access to clean water, and access to healthcare.
Government Policy
Can play a huge role in fertility through coercive or noncoercive policies.
Affluence
More developed or wealthy nations have a lower TFR than less developed nations.
Female Education
More education leads to fewer unplanned pregnancies and more job opportunities for women.
Malthusian Theory
The theory that Earth has a human carrying capacity, probably based on food production.
Technological Advancement
Humans can alter earth's carrying capacity with technological innovation.
Exponential Increase in Food Supply
Dramatic increase in food supply due to innovations like synthetic fertilizers.
Growth Rate (r)
Percentage increase in a population, usually per year.
Crude Birth Rate (CBR)
Births per 1,000 people in a population.
Crude Death Rate (CDR)
Deaths per 1,000 people in a population.
Global CBR
20
Global CDR
8
Doubling Time (Rule of 70)
The time it takes for a population to double is equal to 70 divided by the growth rate.
Example of Doubling Time Calculation
For a global growth rate of 1.2%, doubling time is 70/1.2 = 58.3 years.
Annual Growth Rate Calculation
For a country with a CDR of 9 and a CBR of 18, the growth rate is (18-9)/10 = 0.9%.
Doubling Time from Growth Rate
For a growth rate of 0.9%, doubling time is 70/0.9 = 77.77 years.
Factors Increasing Population Growth
Higher Total Fertility Rate (TFR), high immigration levels, and increased access to clean water and healthcare.
Factors Decreasing Population Growth
High death rate, high infant mortality rate, increased development, increased education for women, delayed age of first child, and postponement of marriage age.
Standard of Living
Quality of life indicators for people in a country.
Life Expectancy
Average age a person will live to in a given country; a key health indicator of standard of living.
Gross Domestic Product (GDP)
Total value of goods and services produced; a key economic indicator of standard of living.
Per Capita GDP
Total GDP divided by total population.
Stage 1 - Preindustrial
Characterized by high infant mortality rate (IMR) and high death rate due to lack of access to clean water, stable food supply, and healthcare.
Stage 2 - Industrializing/Developing
Marked by declining IMR and CDR, low per capita GDP, and high TFR due to factors like high infant mortality and lack of education for women.
Stage 3 - Developed/Industrialized
Features high per capita GDP, low infant mortality, and delayed marriage and first child, with TFR near replacement level (2.1).
Stage 4 - Post-Industrialized/Highly Developed
Characterized by very high per capita GDP, longest life expectancy, TFR below replacement level (2.1), and negative population growth.
Demographic Transition
The process of economic and social transition from an agrarian economy to an industrial one.
Generational Lag
The time it takes for education and societal change to spread.
High TFR
Indicates a higher birth rate, often driven by high infant mortality and the need for child agricultural labor.
High Infant Mortality Rate
Can drive up TFR as families have more children to ensure some survive.
Access to Family Planning
Involves availability of contraceptives and education to help manage birth rates.
Economic Indicators of Development
High GDP and life expectancy are both indicators of development and low population growth.
Population Growth Rate
The rate at which the number of individuals in a population increases in a given time period.