Financial Management Final Exam Theory
1/82
There's no tags or description
Looks like no tags are added yet.
Name | Mastery | Learn | Test | Matching | Spaced |
|---|
No study sessions yet.
83 Terms
Financial Management
Means planning, organizing, directing, and controlling financial activities such as procurement and utilization of enterprise funds.
It means applying management principles to the financial resources of the enterprise.
Key Performance Indicators (KPIs)
Sales
Liquidity
Profitability
Return on Assets (ROA)
Return on Equity (ROE)
Assets
Balance Sheet
Equity
Sales
The most important factor; without sales, nothing else matters.
Profitability
The percentage of a profit of a company makes (ex. net income margin)
Return on Assets (ROA)
Net income divided by total assets, indicating how efficiently assets are used to generate profit
Liquidity
The ability to manage cash flows
Current Ratio (razón circulante): measures short-term liquidity
Quick Ratio: A more conservative measure of short-term liquidity
Return on Equity (ROE)
Net income divided by equity, showing profitability for investors
Assets
What the company owns
Balance sheet
Shows the company’s financial position (assets, liabilities, and equity)
Equity
The money invested by investors
Core Principle
“Every decision has a cost”
Financial Analysis
Assessing liquidity, profitability, and solvency
Cost definition
The cash or cash equivalent sacrificed to obtain goods or services, expected to provide a future benefit (usually revenue for a company
Cost Accounting
A specialized branch of accounting focused on classifying, accumulating, assigning, and controlling costs
Objects of Cost Accounting
Ascertaining the cost of products or services.
Determining selling prices.
Controlling and reducing costs.
Aiding management in decision-making. Ascertaining profit.
Providing a basis for operating policies.
Identifying inefficiencies and carelessness.
Providing information about production activities.
Establishing costing system principles and procedures.
Preparing comparative analysis through data collection.
Estimating costs.
Disclosing and minimizing waste.
Factors that Influence Costs
exchange rates, interest rates, taxes, tariffs, wars, etc.
Historical costs
Costs ascertained after they have been incurred (actual costs)
Pre-determined costs
Cost estimated in advance of production, used for planning and controlling
Direct materials
Costs easily identified with and allocated to unit costs; becomes part of the finished product (ex. fabric on a tie)
Indirect materials
Materials not easily identified with individual cost units (ex. consumables, small tolls, labels on products)
Direct Labor
Wages paid to workers directly involved in converting raw materials into finished goods.
Indirect Labor
Labor that supports production but is not directly involved (ex. supervisors, maintenance).
Direct Expenses
Expenses directly identified with cost centers or units.
Indirect Expenses
Costs not directly identified with a specific job or process,
common to cost units (ex. rent, depreciation)
Manufacturing Overhead
Costs related to manufacturing activities, excluding direct materials and direct labor (ex. rent, taxes, depreciation)
Product Cost
Costs necessary for production; incurred only if there is production (ex. direct materials, direct labor, factory overhead)
Period Cost
Costs not necessary for production; incurred even if there is no production (ex. rent, administrative salaries)
Fixed Costs
Costs that remain constant over a specific activity range and time
period, regardless of production volume (ex. rent, salaries).
Variable Costs
Costs that change in direct proportion to production volume;
cost per unit remains constant.
Real Cost (Actual Cost)
The actual cost of manufacturing a product.
Standard Cost
An estimate of the expected cost of production.
Cost of Goods statements
Statement of Production of Goods Sold: Includes Work-in-Progress (WIP) inventory.
Schedule of Cost of Goods Manufactured: Details the costs involved in producing goods.
Cost of Goods Sold (COGS):
Represents the direct costs of producing goods sold by a company
Inventories
Direct materials, WIP, and finished products
Accounting
Focuses on recording, reporting, and analyzing financial information (ex. income statement, balance sheet, cash flow statement).
Finance
Focuses on the origin (financing) and destination (investing) of money (ex. capital expenditures, portfolio investments).
Financial Cycle
The flow of money through a business
Management Process
Planning, directing, controlling, improving, and decision-making
Manufacturing Costs
Direct Materials
Direct Labor
Factory Overhead.
Cost center
A department of people doing something
Business Unit
A department that makes its own money
Punto de Equilibrio - Break-Even Point
El nivel de ventas donde los ingresos totales igualan los costos totales; no hay ganancia ni pérdida.
Costos Fijos (CF)
Costos que no cambian con el nivel de producción (ex. alquiler)
Costos variables
Costos que cambian con el nivel de producción (ej. materia prima)
Costo de Bienes Vendidos Unitario - Cost of Goods Sold (COGS)
El costo de producir una unidad del producto
Margen de Contribución - Contribution Margin (CM)
Precio de venta unitario menos el costo variable unitario; lo que cada unidad contribuye a cubrir los costos fijos y generar ganancia
Margen de Contribución Porcentual %
El margen de contribución unitario dividido por el precio de venta unitario, en porcentaje
Mix de Ventas (% de ventas)
La proporción en que se venden los diferentes productos
Margen de Contribución Promedio Ponderado (CMXG)
El margen de contribución promedio cuando se venden varios productos
Utilidad antes de Impuestos - Earnings Before Interests and Taxes (EBIT)
Ganancias antes de intereses e impuestos
Marginal Analysis
Evaluating the additional benefits and costs of a business decision
Análisis Marginal
Este análisis se trata de tomar decisiones sobre "la siguiente unidad". Por ejemplo, si estás pensando en vender un vaso más de limonada, el análisis marginal te ayuda a decidir si hacerlo aumentará tus ganancias. Consideras los ingresos adicionales (el precio de venta del vaso) y los costos adicionales (el costo de los limones y el azúcar para ese vaso). Si el ingreso adicional es mayor que el costo adicional, entonces vender ese vaso extra es una buena decisión.
If fixed costs increase
then break-even increases
If fixed costs decreases
then break-even decreases
If unit variable cost increases
then break-even increases
If unit variable cost decreases
then break-even decreases
If unit selling price increases
then break-even decreases
If unit selling price decreases
then break-even increases
Financial Statements
Balance sheet
Income statement
Cash flow
Assets = Liabilities + Equity
What you own, what you have
Machinery, furniture, inventory, rights (from contracts)
Liabilities + Equity
Where does the money come from?
Financing sources
External financing sources
Bank, financial institutions, %interest rate, suppliers
Internal financing sources
Board (investors)
Common Analysis (vertical analysis)
is a method in finance used to analyze financial statements by expressing each line item as a percentage of a base figure within the same statement. This technique provides insights into the proportional relationship of different items within a financial statement.
On the income statement the 100 goes in the net sales
On the balance sheet the 100 goes in the total of assets
On the balance sheet the 100 goes in the total of liabilities + equity
Profit and cash flows
Profits is not the same as having cash flows. The retained earnings might be on the assets, on the inventory, on the accounts receivable, having
Profitability
Measures the company’s ability to generate profits relative to its revenue assets, or equity. Some of the metrics to know profitability are:
Gross Profit Margin (Gross Profit / Revenue) - indicates how efficiently a company manages its production costs
Net Profit Margin (Net income / Revenue) - shoes how much profit a company retains after all expenses
Return on Assets (ROA) (Net income / Total Assets ) - measures how effectively a company uses its assets to generate profit
Return on Equity (ROE) (Net income / Shareholder’s Equity) - Indicates how much profit a company generates with shareholder investments
Finding the Greatest Money Lender on the Balance Sheet
You can infer this by examining the "liabilities" section.
Specifically, look for:
Notes Payable: Short-term debt obligations.
Long-Term Debt: Obligations due beyond one year.
By comparing the amounts listed under these categories, you can identify which entity or type of debt represents the largest financial obligation.
Also, sometimes the notes in the financial statements will give more detail about who the lenders are.
Determining if a Company Generates Enough Profits to Finance Operations
Income Statement:
Net Income: Is the company consistently profitable?
Cash Flow Statement:
Cash Flow from Operations: Does the company generate sufficient cash from its core business activities to cover its operating expenses? This is very important.
Operating costs:
Raw materials
Labor
Indirect costs
Marketing team
Accountant
Rent
Insurance
Balance Sheet:
Retained Earnings: Accumulates profits that have been reinvested in the business. A growing retained earnings balance suggests the company is generating profits and reinvesting them.
Current Ratio and Quick Ratio: These ratios assess a company's ability to meet its short-term obligations.A healthy ratio indicates the company has sufficient liquid assets to finance operations.
By looking at the cash flow statement, and by seeing if the cash on hand is increasing over time, you can have a very good idea if the company is generating enough profit to finance operations.
In short, strong positive cash flow from operations is a very strong indicator that a company is generating enough profits to finance operations.
How can we know if the Earnings before taxes are okay if we only have 2 years?
We can know if we go to the market, to see the risk free rate.
Risk Free Rate: Stated by the banco de México, it is a theoretical rate of return on an investment with 0 risk of loss. It represents the return an investor would expect to earn on an invest that has no possibility of default
Financial ratios
Liquidity
Efficiency / Activity
Profitability
Solvency
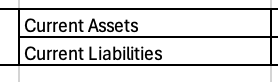
General liquidity (sweet test)
It indicates whether a company has enough highly liquid assets (assets that can be quickly converted to cash) to cover its current liabilities (debts due within one year) without needing to sell inventory.
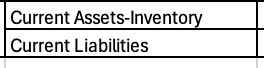
Acid-test ratio (or quick ratio)
shows if a company can easily pay its short-term bills using everything it owns that can quickly become cash but without counting items that might take longer to sell like unsold products
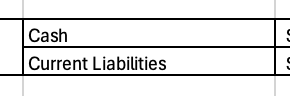
Sour Test
only looks at actual cash on hand to cover those immediate bills.
Liquidity ratios
General liquidity - Acid Test: This difference primarily highlights the role of inventory and prepaid expenses in a company's short-term liquidity.
Acid Test - Sour Test: This difference shows the impact of accounts receivable and marketable securities on a company's immediate liquidity, about what they owe me
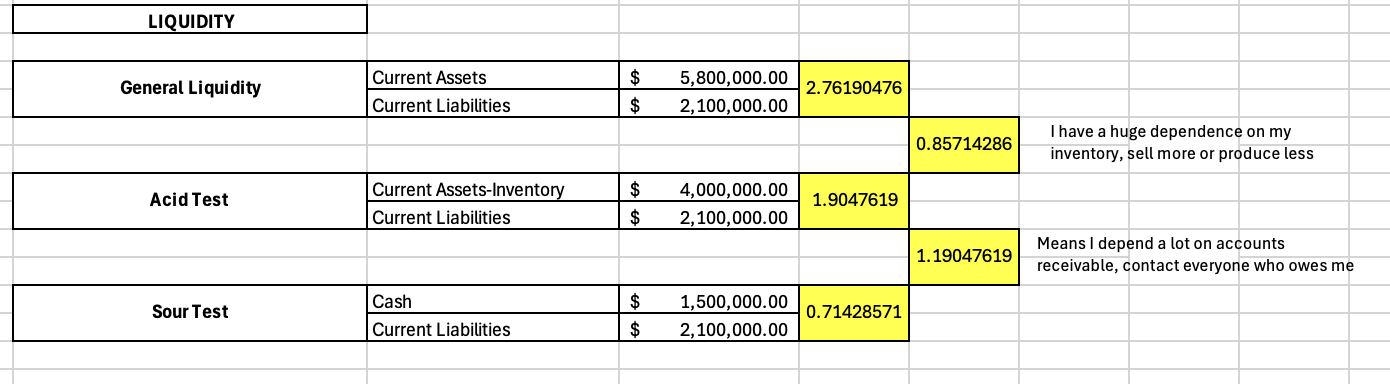
General liquidity - Acid Test
A positive difference indicates that a significant portion of the company's current assets is tied up in inventory and prepaid expenses. This means that if the company needed to quickly pay its bills, it would have to rely on selling its inventory or waiting for prepaid benefits to materialize, which are less liquid than cash, marketable securities, and accounts receivable.
A small difference suggests that inventory and prepaid expenses make up a smaller portion of current assets, and the company has a larger buffer of highly liquid assets to cover immediate obligations.
Acid Test - Sour Test
A positive difference indicates that the company relies on collecting money owed by customers (accounts receivable) and assets that can be quickly sold (marketable securities) to meet its short-term liabilities. While more liquid than inventory, these are still not as immediately available as cash.
A small difference suggests that the company has a large proportion of its liquid assets readily available as cash and cash equivalents. This signifies a very strong and immediate ability to meet its short-term obligations.
Efficiency Ratios
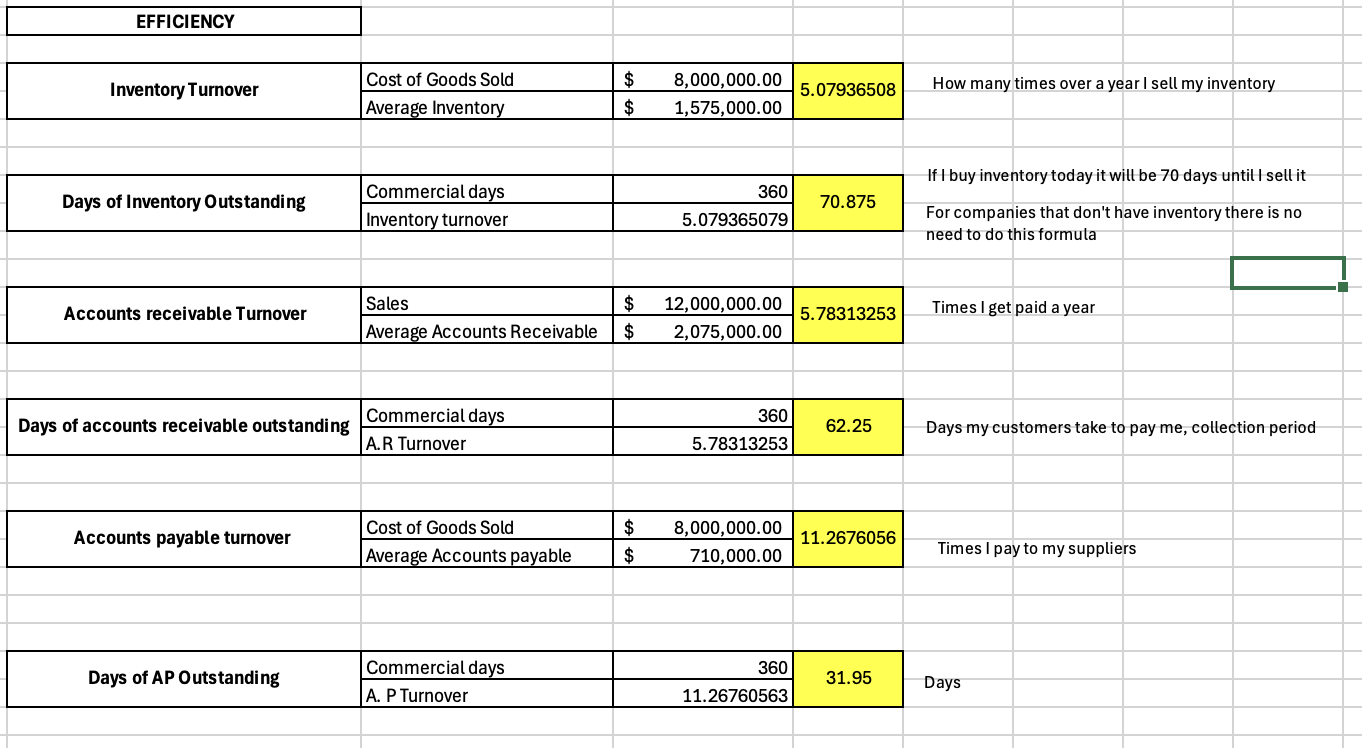
Inventory turnover
Shows how many times a company sells and replaces its inventory over a period (más común un año). A high number means they sell their products quickly.
Days of Inventory Outstanding
Indicates how many days, on average, the company holds onto its inventory before selling it. A low number suggests inventory sells fast.
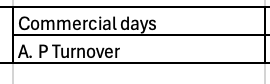
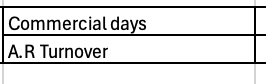
Commercial days : siempre 360
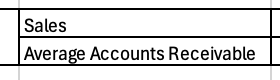
Accounts Receivable Turnover
Shows how many times a company collects the money its customers owe during a period. A high number means they collect payments quickly.
Days of Accounts Receivable Outstanding
Indicates how many days, on average, it takes customers to pay what they owe the company. A low number is better, meaning the company gets its money faster.
Commercial days : siempre 360
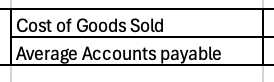
Accounts Payable Turnover
Shows how many times a company pays its suppliers during a period. A higher number can mean they pay quickly, which can be good or might suggest they aren't taking full advantage of credit terms.
Days of AP Outstanding (DPO)
Indicates how many days, on average, it takes the company to pay its suppliers. A higher number means the company takes longer to pay, which can help save cash but might strain supplier relationships if it's too high.
Commercial days : siempre 360