IMED1003 - Integration of Metabolism (L29)
1/20
There's no tags or description
Looks like no tags are added yet.
Name | Mastery | Learn | Test | Matching | Spaced | Call with Kai |
|---|
No analytics yet
Send a link to your students to track their progress
21 Terms
Metabolism Overview
DIAGRAM ON SLIDE 3
Control of Metabolic Pathways
- activation and inhibition of key enzymes
- compartmentalisation
- availability of substrates
- covalent modification of enzymes
- induction and repression of enzyme synthesis
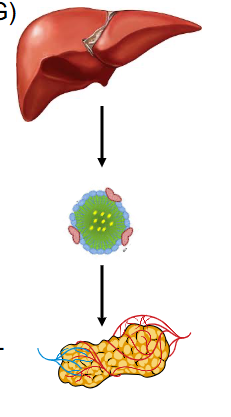
Insulin stimulates conversion of excess glucose to triacylglycerides
- Promotes synthesis of triacylgycerides (TAG) in hepatocytes
- Insulin stimulates glycolysis: overall, glucose -> acetyl CoA
- Insulin stimulates TAG synthesis: acetyl CoA -> malonyl CoA (enzyme: acetyl CoA carboxylase)
.
TAG exported as VLDL (exported to adipocytes)
.
- insulin promotes hydrolysis of FA from VLDL in adipose tissue by lipoprotein lipase (LPL) (insulin stimulates TAG synthesis
.
- phosphorylation of Acetyl CoA carboxylase is what regulates the activity of the enzyme

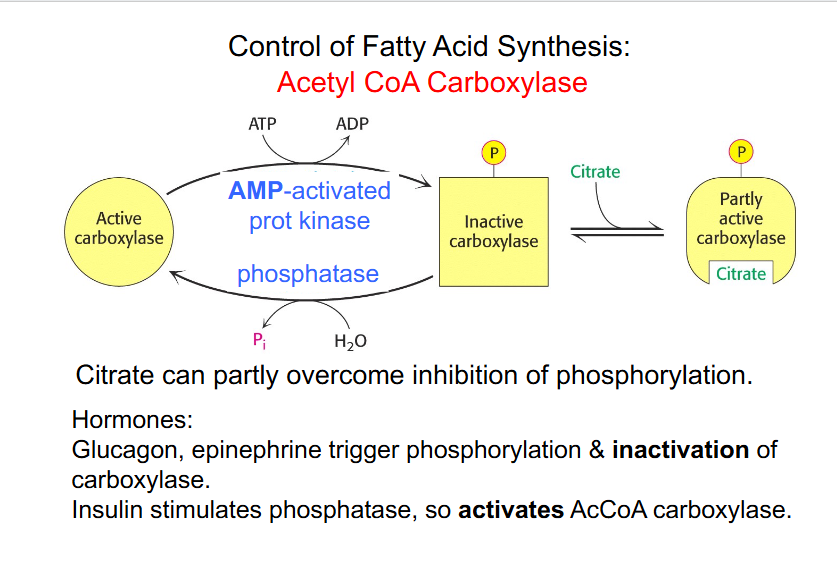
Control of Fatty Acid Synthesis
DIAGRAM ON SLIDE 6 (whole slide)

Integration of Metabolism
- Metabolic processes must be coordinated
- opposing pathways cannot operate simultaneously
- cell must respond to constant changes: external conditions e.g availability of nutrients and internal conditions e.g genetics
.
- in multi-cellular organisms, cells must communicat4e and cooperate
- simplfiued by divison of labour between tisues
- diffe pathway soeoprate in dif tisues and cellular comparenmtns

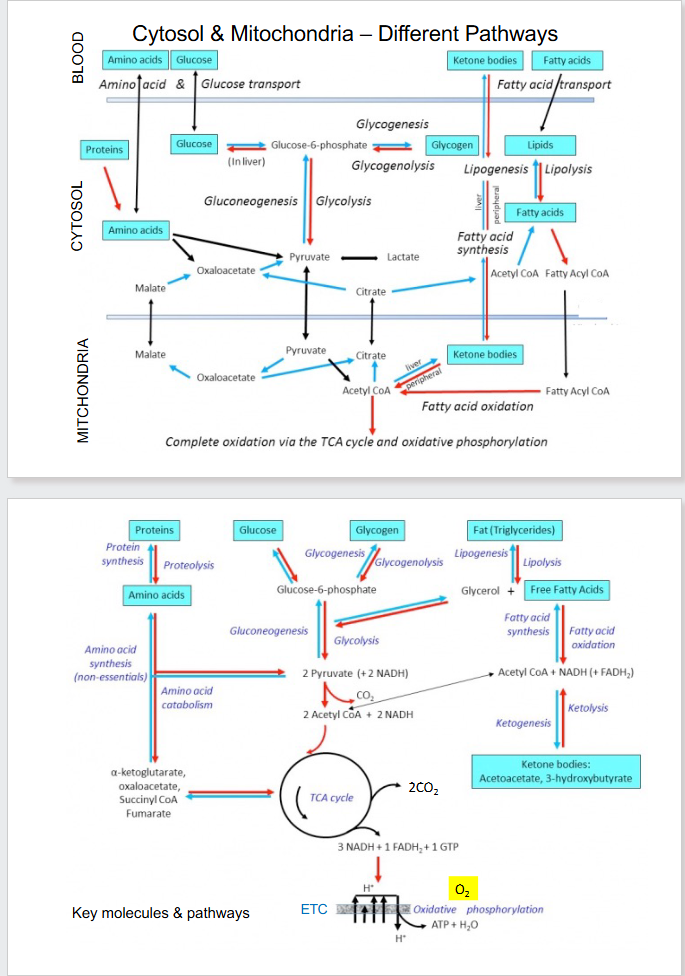
Cytosol and Mitochondria - Diff Pathways
DIAGRAM ON SLIDE 8 and 9

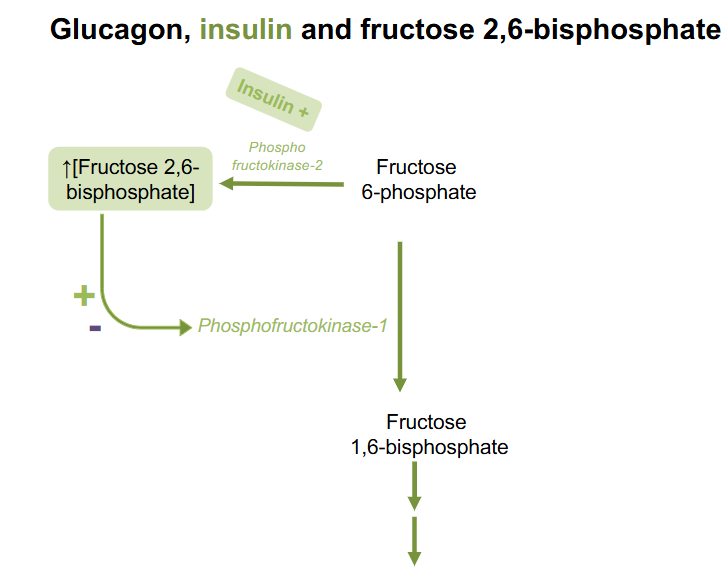
Glucagon, Insulin and Fructose 2,6-bisphosphate
- increase F26BP means PFK1 is activated (promotes glycolysis)
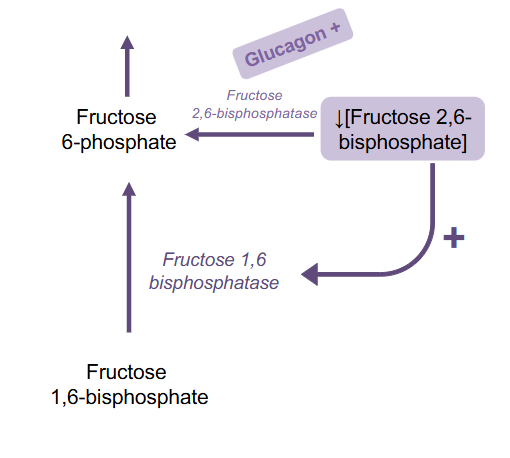
- low F26BP activates Fructose-1,6-bisphosphotase which stimualtes gluconeogenesis
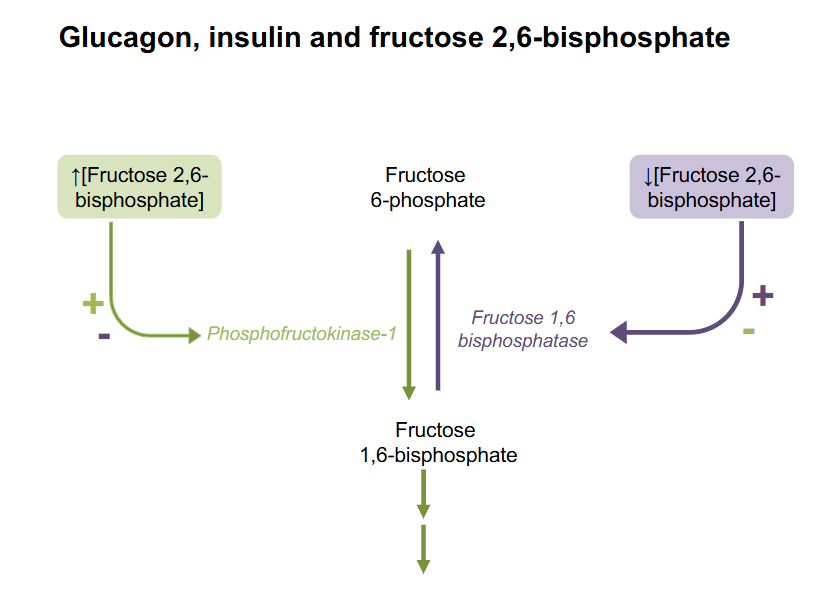

Signal for Insulin turning on F2,6BP
- insulin turns on phosphofructokinase-2 which produces Fructose26BP

Signal for Glucagon turning off F2,6BP
glucagon activates fructose 2-6-bisphosphotase which causes F2,6BP to be broken down into Fructose-6-phosphtae

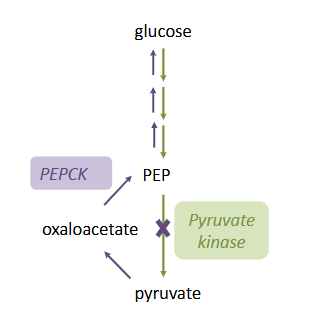
Glucagon Raises Blood Glucose
- promotes gluconeogenesis
inhibits glycolysis
- pyruvate kinase is inactivated by phosphorylation (PEP to pyruvate)
- accumulation of PEP favours gluconeogenesis
.
STIMUALTES GLUCONEOGEENSIS:
- increases PEPCK expression

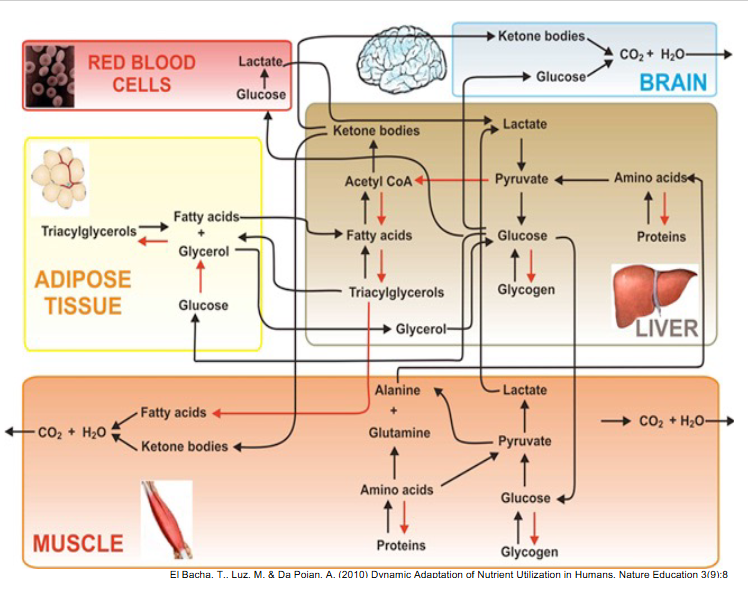
Integration
DIAGRAM ON SLIDE 15 and 16 (WHOLE SLIDE)
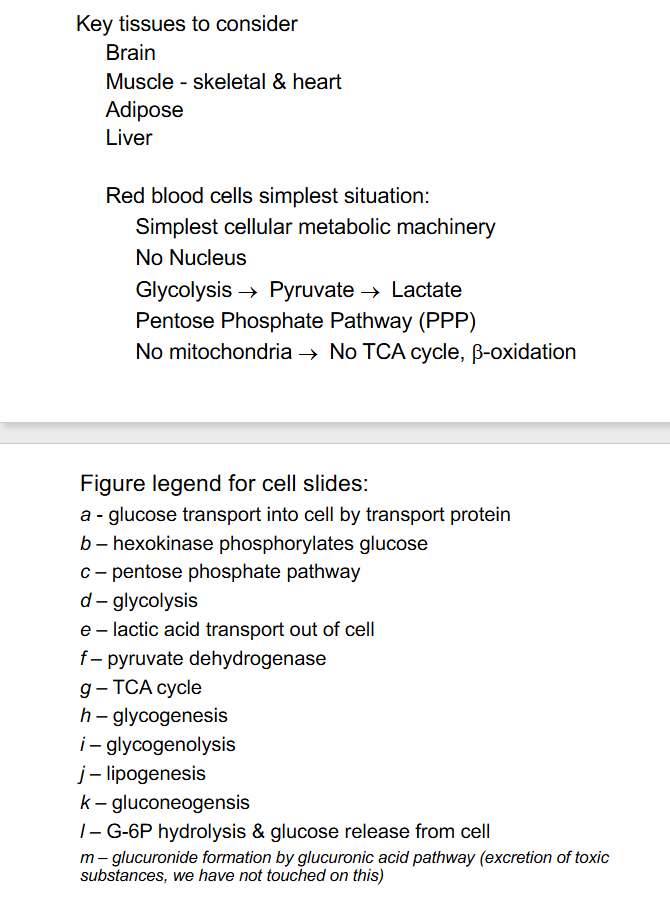

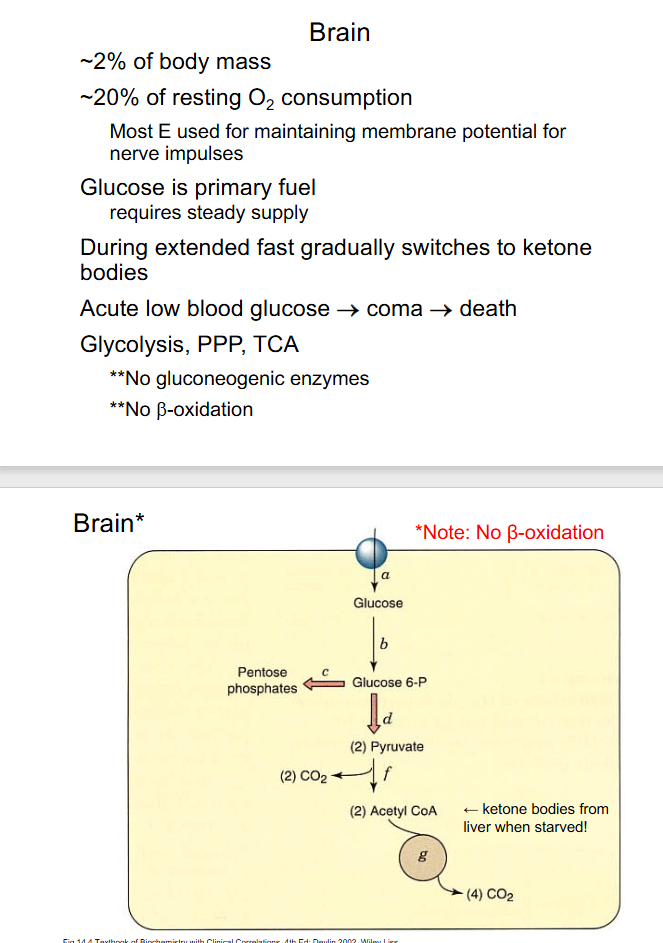
Brain
- dont need to kno w exact numbers

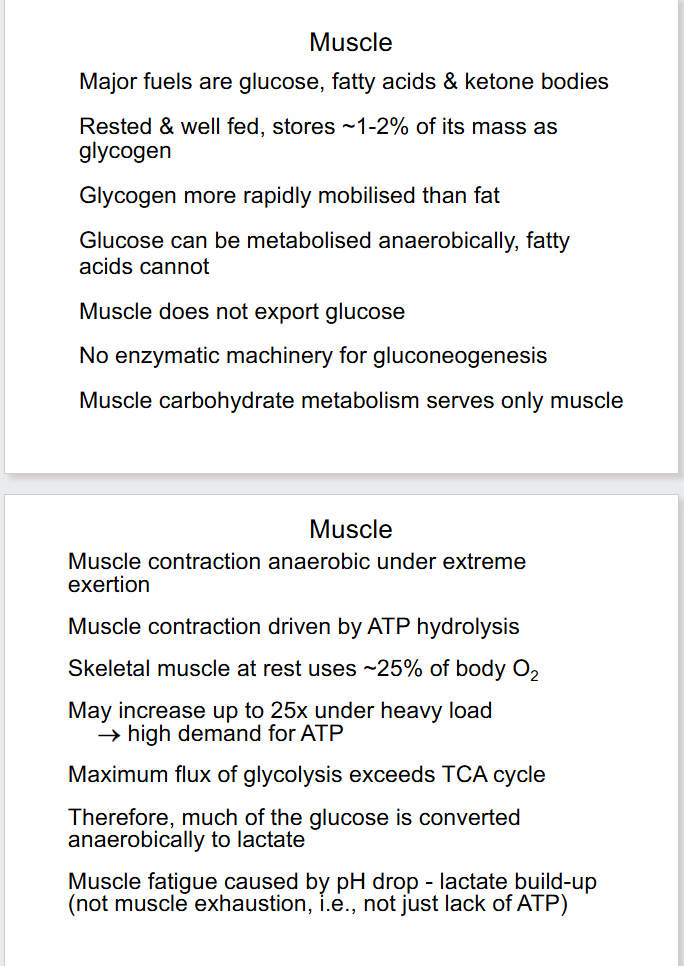
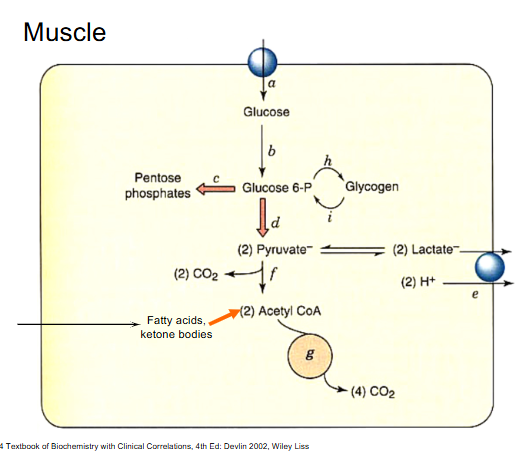
Muscle
DIAGRAM ON SLIDE 20 and 21

Heart
heart has lots of mitochondria becauise it needs to be aerobically respiring if it wants to survive

Muscle DIagram
- this is the heart


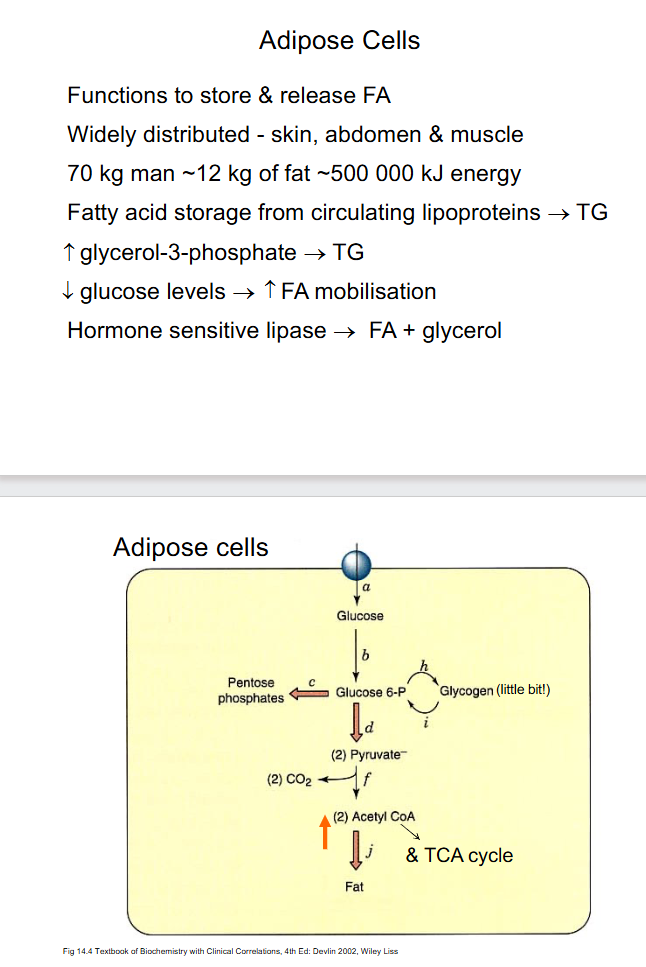
Adipose Cells
DIAGRAM ON SLIDE 24 and 25

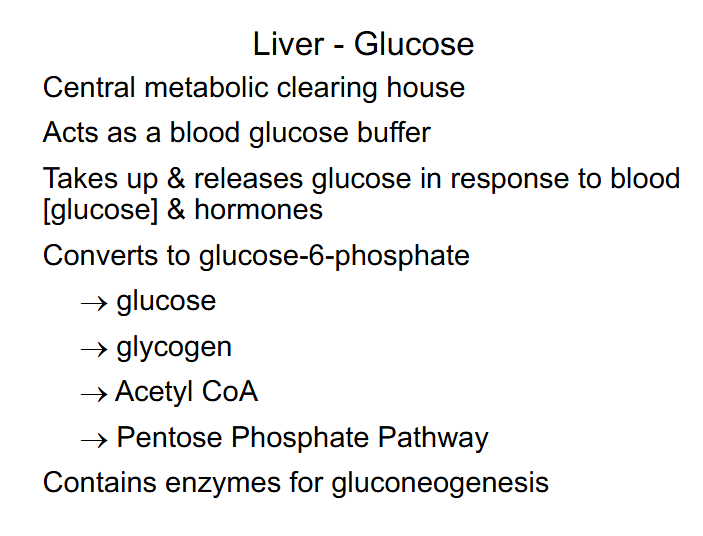
Liver - Glucose
DIAGRAM ON SLIDE 26
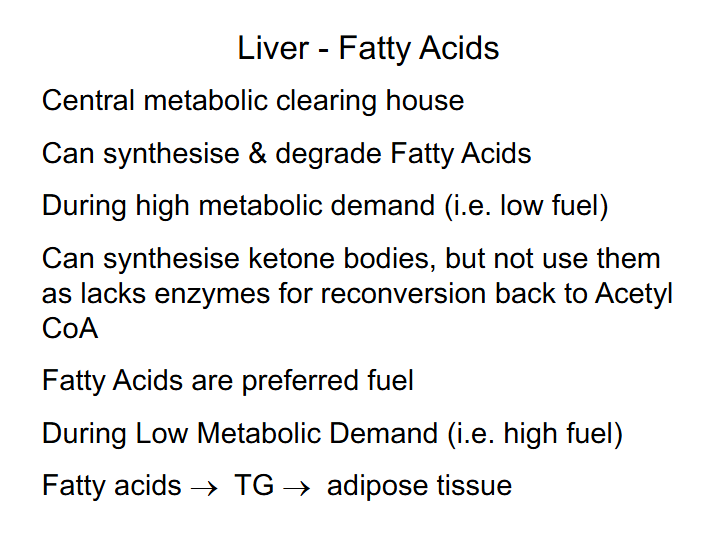
Liver - Fatty Acids
DIAGRAM ON SLIDE 27


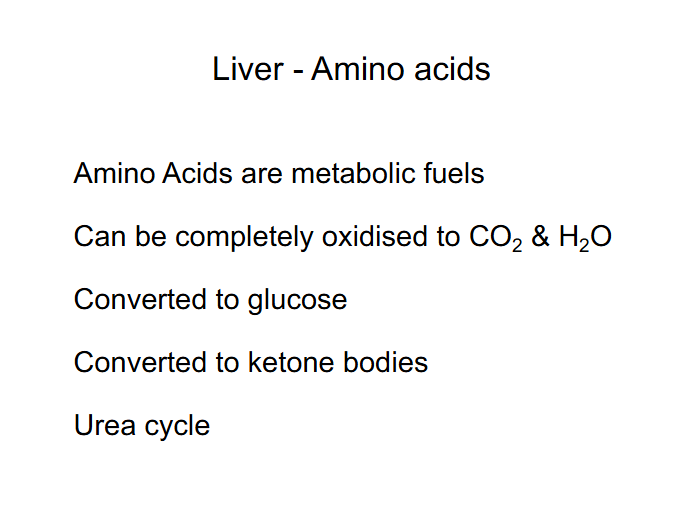
Liver - Amino ACids
DIAGRAM ON SLIDE 28

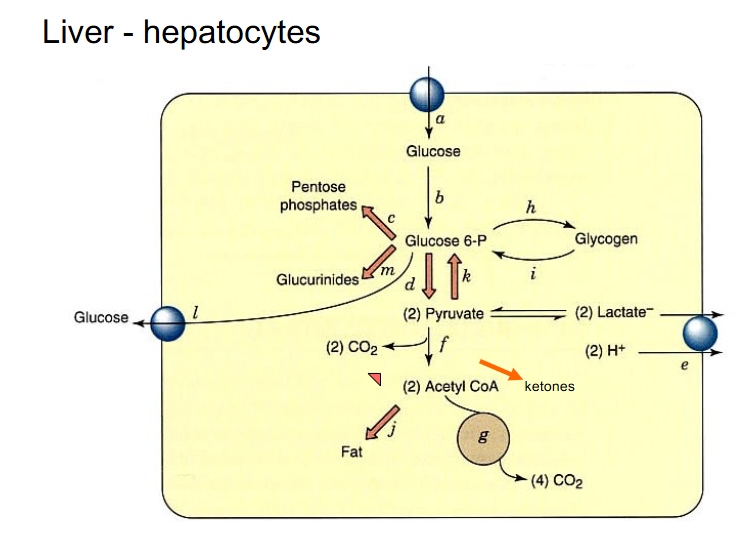
Liver - hepatocytes
DIAGRAM ON SLIDE 29
SUMMARy
DIAGRAM ON SLIDE 30
