GW Blok 6 Seminar 1.2 Descriptive statistics for two continuous variables
1/22
There's no tags or description
Looks like no tags are added yet.
Name | Mastery | Learn | Test | Matching | Spaced |
|---|
No study sessions yet.
23 Terms
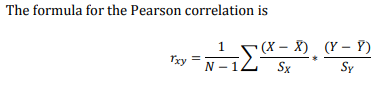
What is a pearson correlation and how do you calculate it?
The Pearson correlation coefficient (often denoted as r) measures the strength and direction of the linear relationship between two continuous variables.
r depends on the average distance of the observations from some straight line
Value range: -1 to +1
+1: Perfect positive linear correlation (as one variable increases, the other increases)
-1: Perfect negative linear correlation (as one variable increases, the other decreases)
0: No linear correlation
Pearson correlation measures linear relationships only
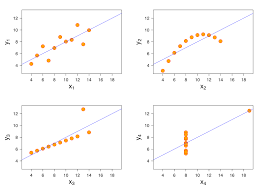
When is it appropriate to calculate the piersons correlation?
Both variables are continuous and measured on an interval or ratio scale.
(e.g., height, weight, temperature, test scores)The relationship between the two variables is linear.
Pearson’s correlation measures linear associations — if the relationship is curved or non-linear, Pearson’s r might be misleading.Data is approximately normally distributed (especially important for small samples).
Normality helps with hypothesis testing related to Pearson’s r, though for large samples this assumption is less strict.No extreme outliers in either variable.
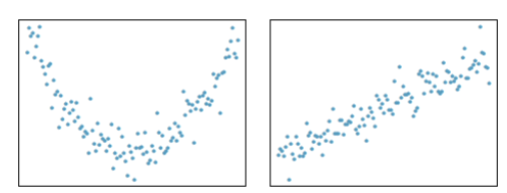
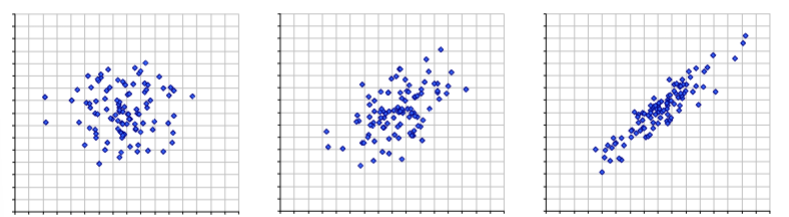
Outliers can heavily distort the correlation coefficient.Plaatje: 1 en 3 mag je Pierson meten, 2 geen lineair verband en 4 je hebt geen spreiding op x-as
How do you interpret a positive and negative slope in a scatterplot in terms of correlation?
A positive slope indicates a positive correlation; as X increases, Y also increases.
A negative slope indicates a negative correlation; as X increases, Y decreases
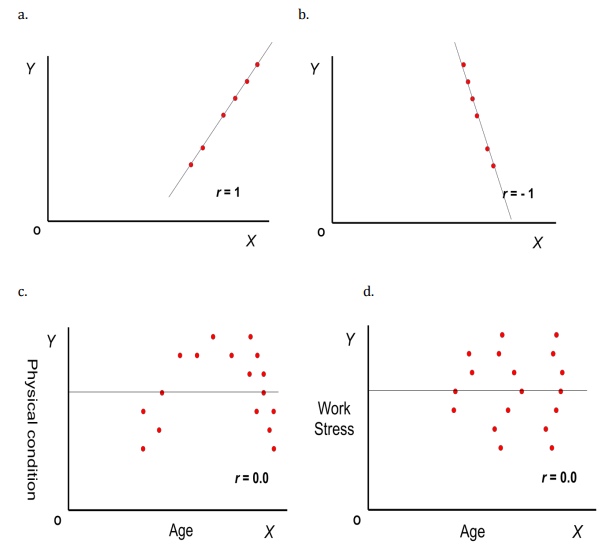
Interpret the following graphs
Perfect positive relationship (Figure 1.7 a)
Large X-values are associated with large Y-values.
The relationship is perfect because if you know the value of X (or Y), then the value of Y (or X) is fully determined. All observations are on a straight line.
r = 1
Perfect negative relationship (Figure 1.7 b)
Large X-values are associated with small Y-values.
This relationship is also perfect and Y (or X) is fully determined by X (or Y).
In that case the correlation is equal to the optimal negative correlation, i.e. r = -1
Non-linear relationship (Figure 1.7 c)
In Figure 1.7 c, there is a bell-shaped relationship between X and Y but the Pearson correlation is still equal to 0.
However, it doesn’t imply no association; it only reflects a zero linear association. There is, however, a quadratic association, which is not a topic of this course.
No association at all (Figure 1.7 d)
Figure 1.7 d. shows a scatter plot where there is no association at all.
The way how the Yvalues vary around the horizontal line seems to be unaffected by the value of X, i.e. there is a same amount of variation of Y-values around the horizontal line, independently of the Xvalues.
How is the "quality of fit" of the regression line related to correlation strength?
The better the fit (less scatter around the line), the stronger the correlation.
What?
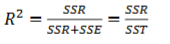
Coefficient of determination (R 2 ): 0 ≤ 𝑅^2 ≤ 1
Why?
How good the fitted model is? Or how precise the predicted value is?
How?
i.e., how much total variability in the y values (SST) is in the explained part (SSR)
Interpretation: It indicates the percentage of variability of y explained by the variable x
When is it appropriate to use simple linear regression?
Y variable (dependent variable): quantitative (continuous)
X variable (independent variable): usually numeric/continuous, but can be categorical
Goal: determing the (approximately) average Y value for a given X value (or conditional on X).
X: independent variable/cause
Y: dependent variable/effect
What is the difference between correlation and regression?
Correlation coefficient (r):
Measures the strength and direction of a linear association between X and Y.
Symmetric: correlation of X with Y equals correlation of Y with X.
Does not imply causation or prediction.
Regression:
Asymmetric: regression of Y on X is different from regression of X on Y.
Focuses on predicting mean Y given X or estimating how Y changes as X changes.
What is the simple linear regression model?
The general idea of performing a linear regression analysis in our example is to summarize the scatter plot by means of a straight line that can be interpreted as (approximate) average values of length for different values of Age.
Goals:
Effect Size Model: Estimate and interpret effect of X on Y
Prediction Model: Predict Y value given X value
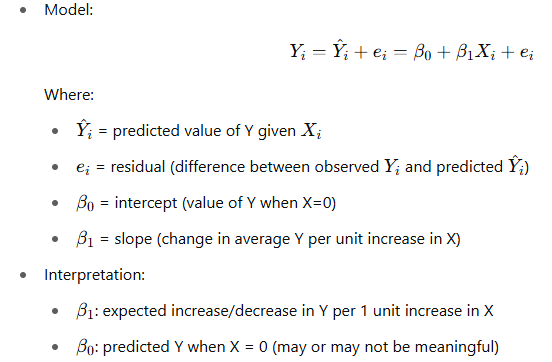
How can you calculate B1 and B0?
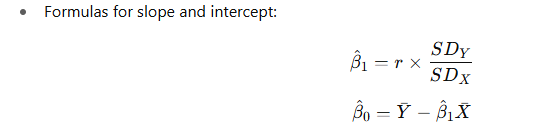
What is a regression line?
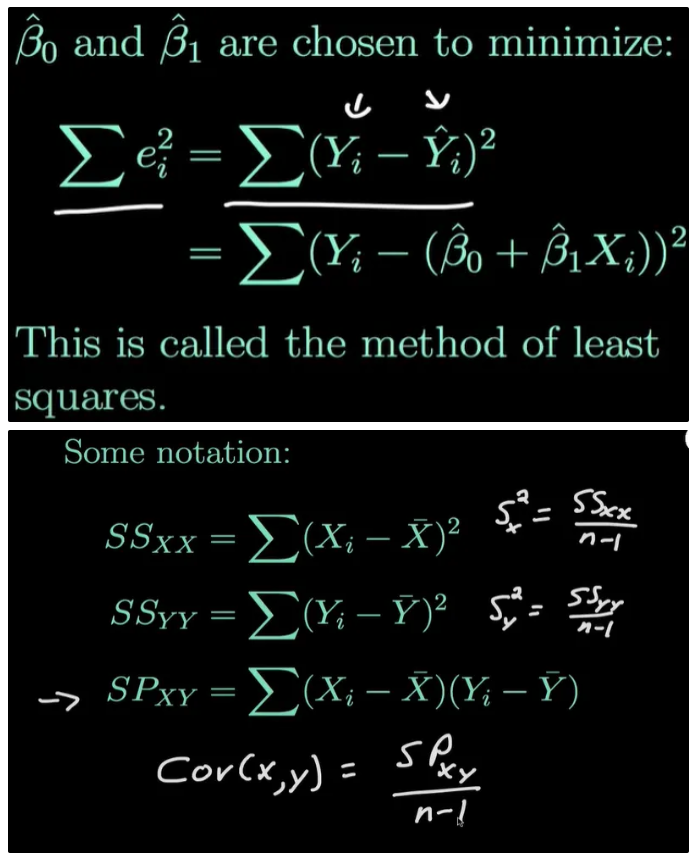
The best-fitting line minimizes the sum of squared residuals (Method of Least Squares).
The regression line passes through the point (Xˉ,Yˉ) (the means of X and Y).
The points on the regression line are only approximately equal to the average Y values, which will be assumed to be equal for very large sample sizes (almost equal to the population size).
For a finite sample size (which will be the case in practice), these points will be called predicted Y-value and denoted as Y-hat
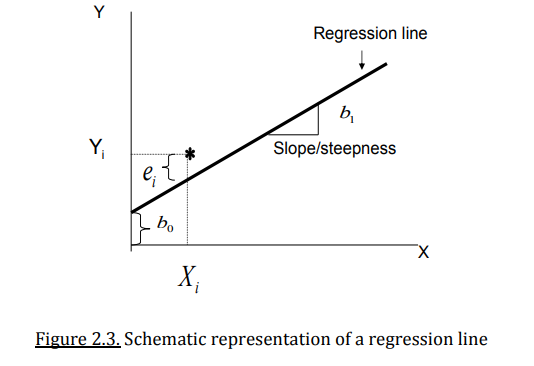
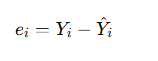
What are residuals?
The (vertical) deviations of the observation from the line are called the residuals. Reflects how good the regression line summarizes the scatter point by means of a straight line.
Residuals = observed Y - predicted Y
They represent unexplained variability due to biological variation, measurement error, or other factors.
Residuals can be positive (above line) or negative (below line).
Error: theoretical error
Residual: observed error for a set of data
What does the correlation coefficient describe?
It describes only the direction and strength of the association between two variables, not the effect of X on Y or the ability to estimate Y from X.
What is the "method of least squares" in regression?
It is a method that estimates the best-fitting line by minimizing the sum of squared errors (residuals).
SSxx: sum of squares for X
s2 = variance
SSyy: sum of squares for Y
SPxy: sum of product
cov = covariance
The residuals sum to 0
The line passes through (Xˉ,Yˉ)
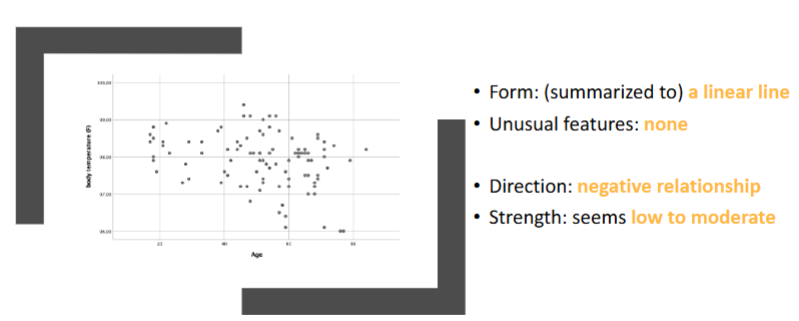
How can you visually inspect a scatter plot?
Think about:
Direction
Functional form
Strength
Unusual features
WHY do we need to investigate these four elements?
Because they justify whether Pearson correlation or linear regression model is appropriate!!!
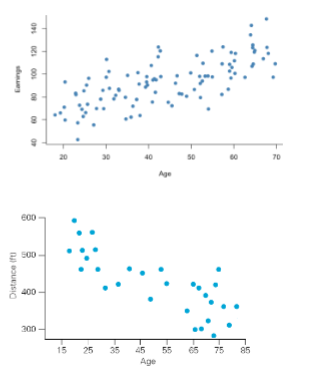
Direction of a scatter plot
Positive association: the values of y tend to increase as the values of x increase
e.g.: Earnings increases by age
Negative association: the values of y tend to decrease as the values of x increase
e.g.: Max legibility distance of highway signs decreases by driver age
Functional form of a scatter plot
Non-linear vs linear
Strength of a scatter plot
How strong is the association? How strong is the association?
From weak to highly associated (more straight line)

Unusual features of a scatter plot
Example inspection scatter plot
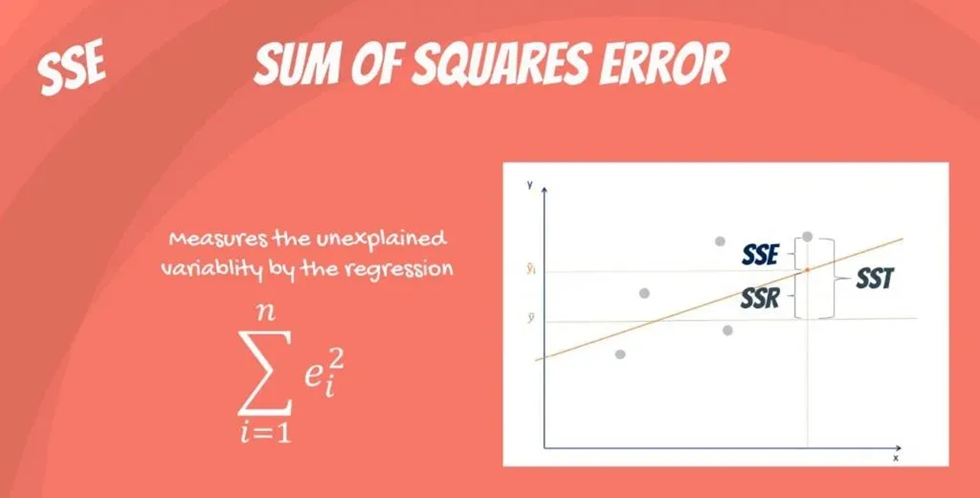
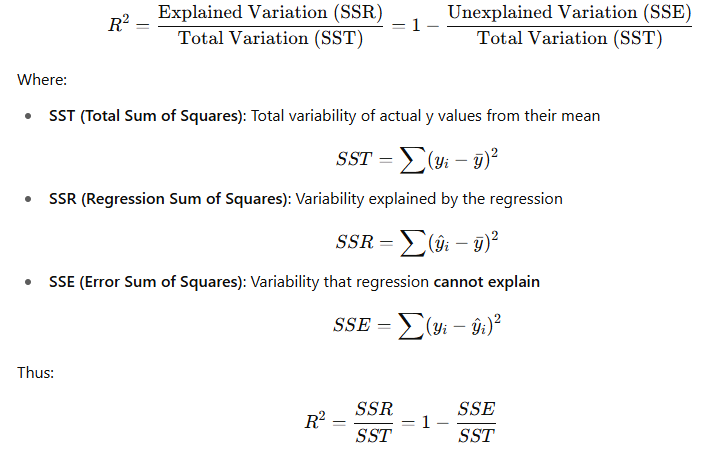
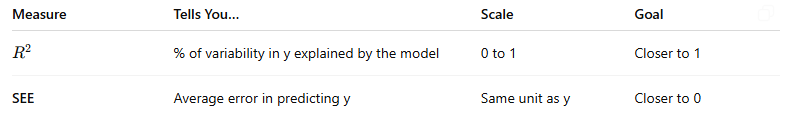
What is R squared (R2) and how do you calculate it?
R2 tells us how well the regression line fits the data.
It quantifies how much of the variation in the dependent variable (y) is explained by the independent variable (x) using the regression model.
0 ≤ R2 ≤ 1
R2 =1 → perfect prediction (all actual values lie on the regression line)
R2 =0 → regression line explains none of the variability in y
SSR + SSE = SST
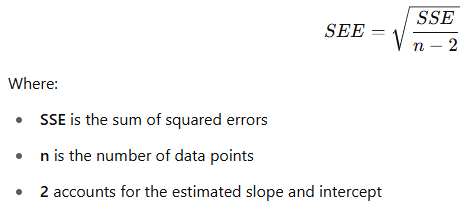
NOT A TOPIC OF THIS COURSE What is standard error of the estimate (SEE) and how do you calculate it?
Measures the average distance between the actual y-values and the predicted y-values.
It's like a standard deviation of the residuals.
SEE gives us an absolute measure of prediction error (in units of y).
Lower SEE means the model predicts more accurately.
NOT A TOPIC OF THIS COURSE What is the difference between R2 and SEE
Sum of squares error