(1.3.2 B) Hydrographs + Somerset Levels
1/15
Earn XP
Description and Tags
Name | Mastery | Learn | Test | Matching | Spaced |
|---|
No study sessions yet.
16 Terms
What is a river regime?
A graph showing the variability in a river’s discharge throughout the course of a year.
What does a hydrograph show?
The variation of a river’s discharge over a short period of time, usually following a rainstorm.
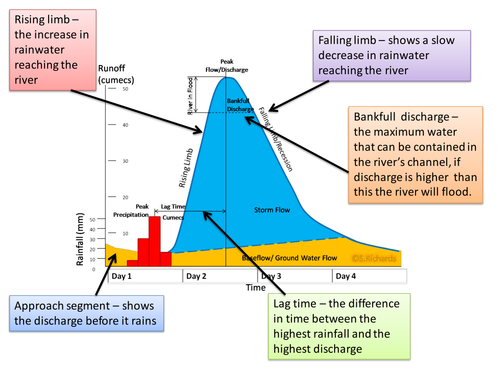
Features of storm hydrographs: Approach Segment
The river’s discharge before it rains.
Features of storm hydrographs: Rising Limb
The increase in rainwater reaching the river- the discharge.
The steepness depends on the speed of water transfer.
Features of storm hydrographs: Peak Discharge
The highest level of discharge
Features of storm hydrographs: Lag Time
The period between maximum precipitation and peak discharge.
This shows how long it takes for the water to reach the river.
Features of storm hydrographs: Falling/Receding Limb
Point where discharge levels are decreasing. Falls less steeply than rise as throughflow is still being released into the channel.
Features of storm hydrographs: Bank full Discharge
Capacity of the river- if water reaches higher than this, the surrounding land will be flooded
What is a flashy hydrograph?
steep rising limb
dominated by quick flow processes
likely to flood
What is a steady hydrograph?
shallow rising limb
dominated by slow flow processes
unlikely to flood
Give an overview of the area of Somerset Levels.
coastal, low-lying farmland and wetland area
Majority of land at or just above sea level
Mainly used for agriculture, grazing and some settlements
Dec 2013 - Feb 2014, high levels of severe flooding.
Somerset Levels Flooding: Human Factors
Not dredging → build up of silt → reduced capacity → flooding
changes to agricultural practices → grassland became cereal plants → lowered retention and interception → bare in winter → higher discharge due to surface run-off
Land drained, irrigated and modified for agriculture → lowered infiltration → fast water movement
Somerset Levels Flooding: Physical Factors
coastal, low lying, flat area → prone to flooding
tides and storm surges from Bristol come in pushing rainfall back up the river → flooding
200% increased level of rainfall from average for Jan + wet since October
Somerset Levels Flooding: Social Impacts
Disrupted work and schooling
Increase in crime and theft immediately after
Mental and emotional health took a toll
Volunteers, rescue crews and Marines assisted, floods on news - prompting action
Somerset Levels Flooding: Environmental Impacts
Standing water prevented oxygen from reaching the ground → toxic ground
Wildlife in the area suffered, drowning and destroyed habitats
Somerset Levels Flooding: Economic Impacts
Estimated £16M in property damage
Lost homes, property, livestock and farmland
House prices and valuations decreased and insurance rose as people grew wary and reluctant
Government pledged money to prevent a repeat of the event