Calculus - Graphing
1/6
Earn XP
Description and Tags
Name | Mastery | Learn | Test | Matching | Spaced |
|---|
No study sessions yet.
7 Terms
second derivative
gives the concavity
measures the change in slope
second deriv > 0
positive
concave up
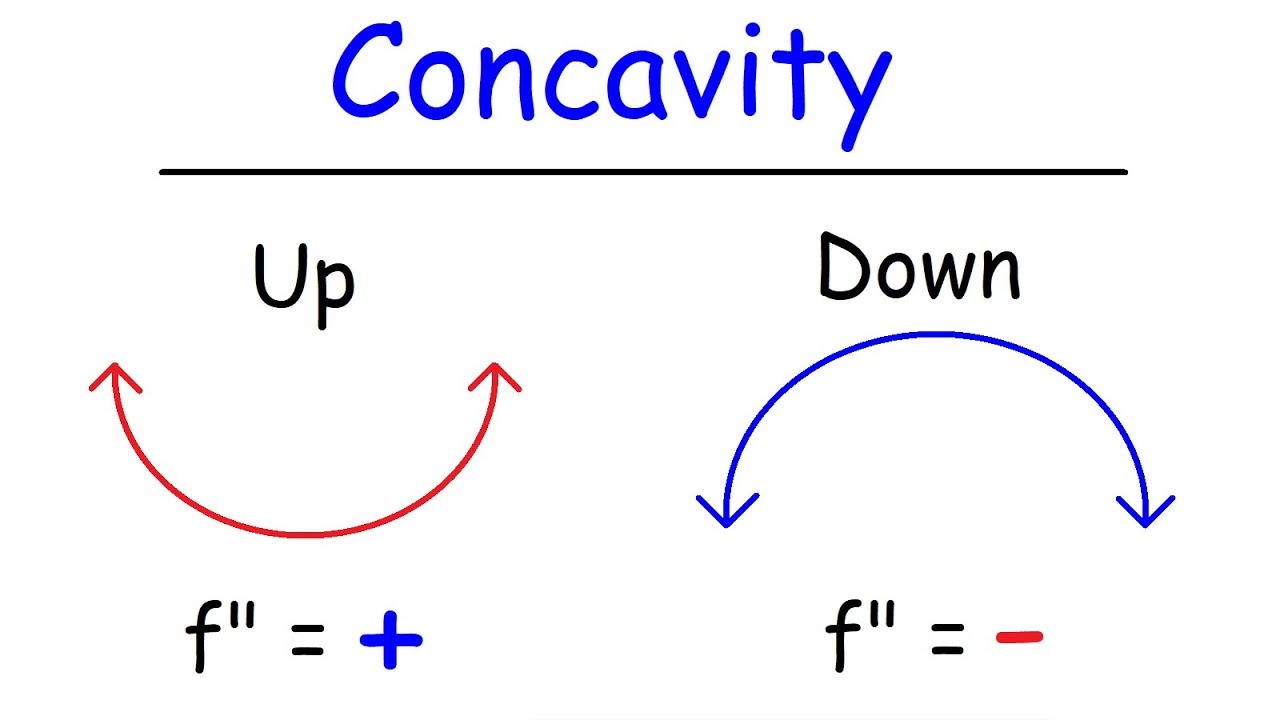
second deriv < 0
negative
concave down

inflection pt
pt on curve when the curve changes from CU to CD and vice versa
second deriv test
if f’(x) = 0 and f’’(x) > 0, there is a local MIN at x
if f’(x) = 0 and f’’(x) < 0, there is a local MAX at x
if f’’(x) = 0, then evaluate using intervals of decrease and increase
all components of curve sketching
x-intercepts
y-intercepts (evaluate after x-intercepts bc it could be (0,0)
local max and mins from first deriv and the second deriv test
det concavity from second deriv by finding inf pts
curve sketching for rational functions
same components as other graphs except you also need:
vertical asymptotes
horizontal asymptotes (LC’s if same deg top and bottom, y = 0 if deg on bottom is higher than deg on top, slant asymptote if deg on top is one higher than bottom)