AP Human Geography Unit 1 Flashcards
1/79
There's no tags or description
Looks like no tags are added yet.
Name | Mastery | Learn | Test | Matching | Spaced |
|---|
No study sessions yet.
80 Terms
Situation
The location of a place relative to other places and its surroundings.
Situation
Denver, Colorado is situated near the Rocky Mountains, influencing its climate and transportation routes.
Situation
Istanbul, Turkey is situated on the Bosporus Strait, making it a strategic link between Europe and Asia.
Cartography
The science and art of mapmaking, involving design, data visualization, and spatial analysis.
Cartography
Ancient Polynesians created stick charts to navigate the Pacific Ocean using wave patterns.
Cartography
GIS (Geographic Information Systems) modernizes cartography by layering spatial data like population density.
Distortion
Misrepresentation of shape, area, distance, or direction on a map due to projecting a 3D globe onto 2D surfaces.
Distortion
Mercator projection exaggerates Greenland’s size, making it appear larger than Africa.
Distortion
Polar regions appear stretched on Azimuthal projections, compressing equatorial areas.
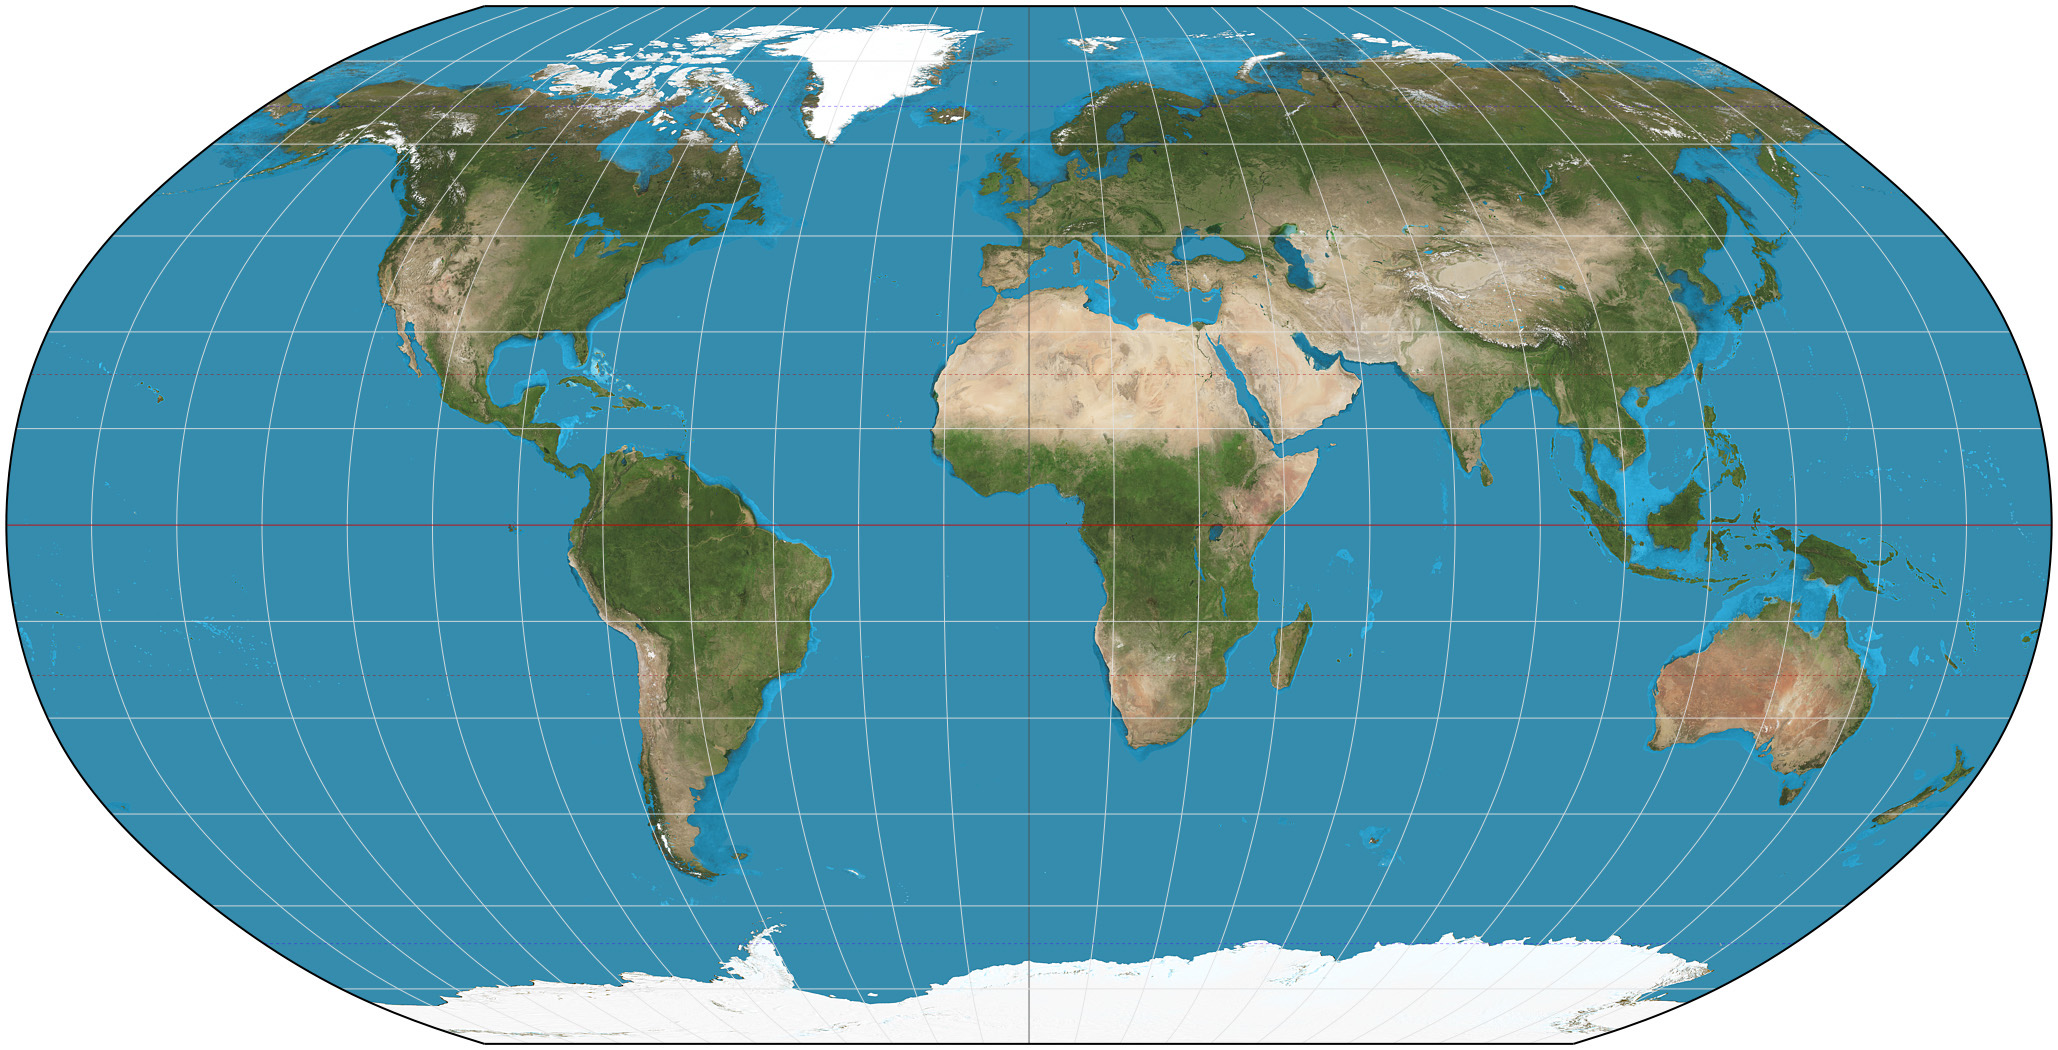
Robinson Projection
A compromise projection minimizing distortion of shape, size, and area, used in world maps.
Robinson Projection
Used by National Geographic (1988–2014) for its balanced portrayal of landmasses.
Robinson Projection
Curved meridians reduce polar distortion but still skew Antarctica.
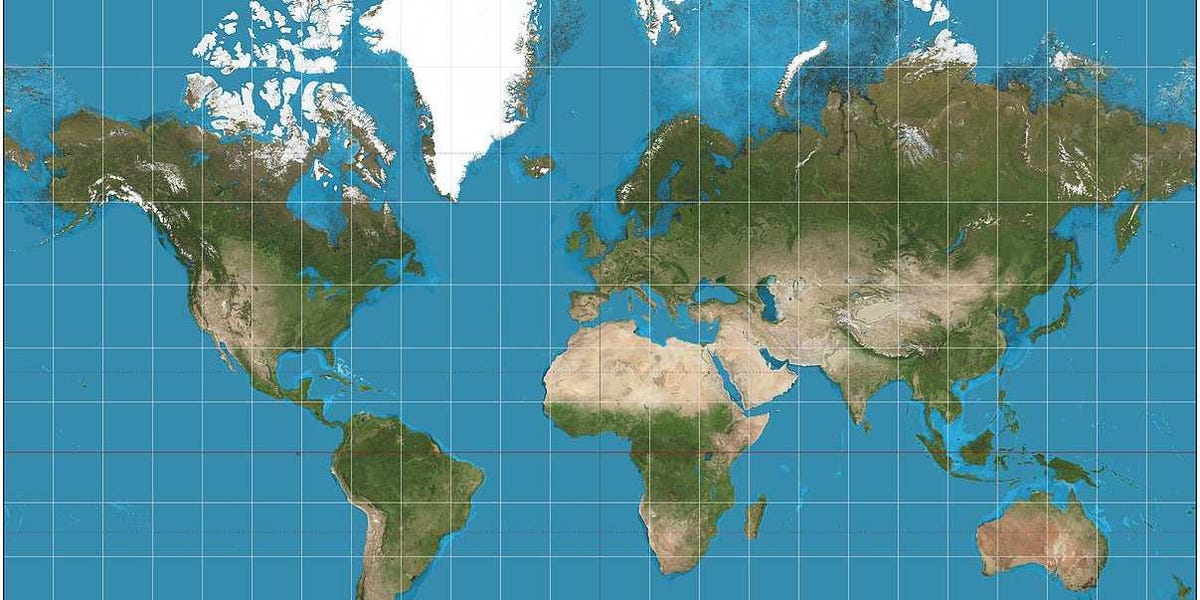
Mercator Projection
Preserves direction (used for navigation) but distorts size near poles.
Mercator Projection
Colonial-era sailors used it for straight-line rhumb lines, but it inflates Europe’s size.
Mercator Projection
Greenland appears comparable to Africa, despite being 1/14th its actual size.
Gall-Peters Projection
Equal-area projection correcting Mercator’s size distortion but stretching shapes.
Gall-Peters Projection
Used in schools to emphasize developing nations’ true size (e.g., Africa’s dominance).
Gall-Peters Projection
Criticized for distorting countries into elongated shapes (e.g., Chile).
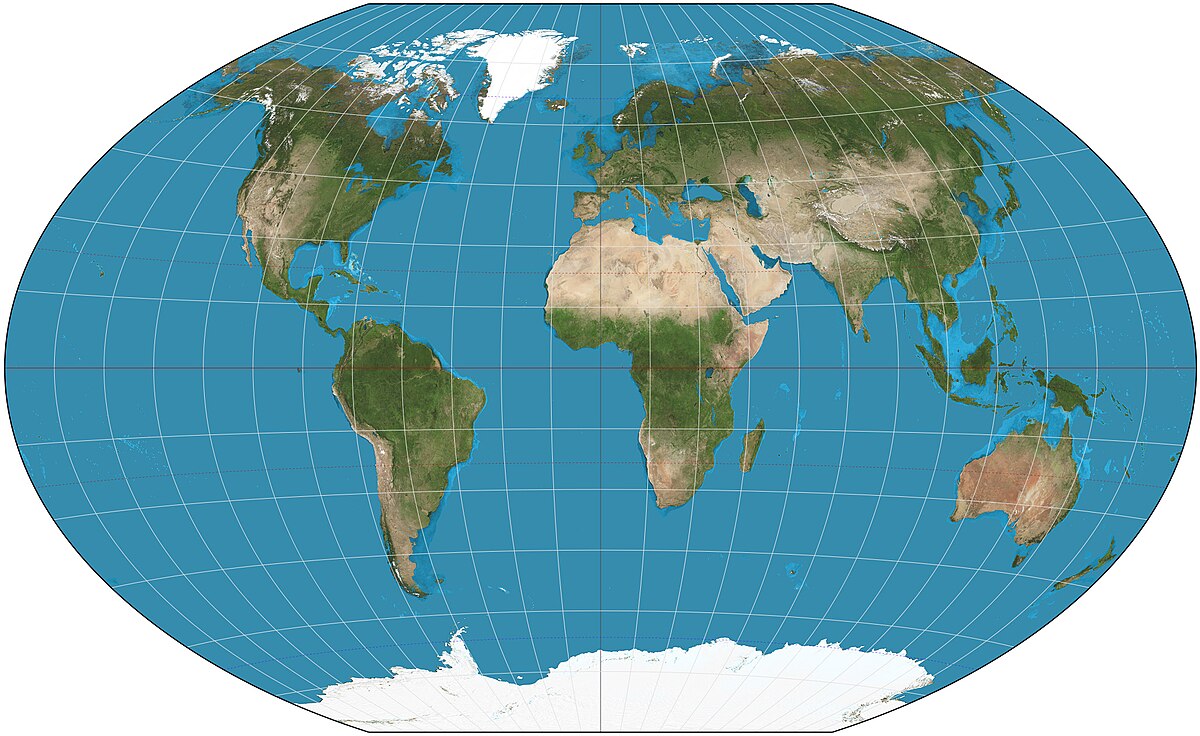
Winkel Tripel Projection
National Geographic’s current standard, balancing area, shape, and distance errors.
Winkel Tripel Projection
Oval shape minimizes polar distortion better than Robinson.
Winkel Tripel Projection
Compromises on perfect accuracy for overall visual appeal.
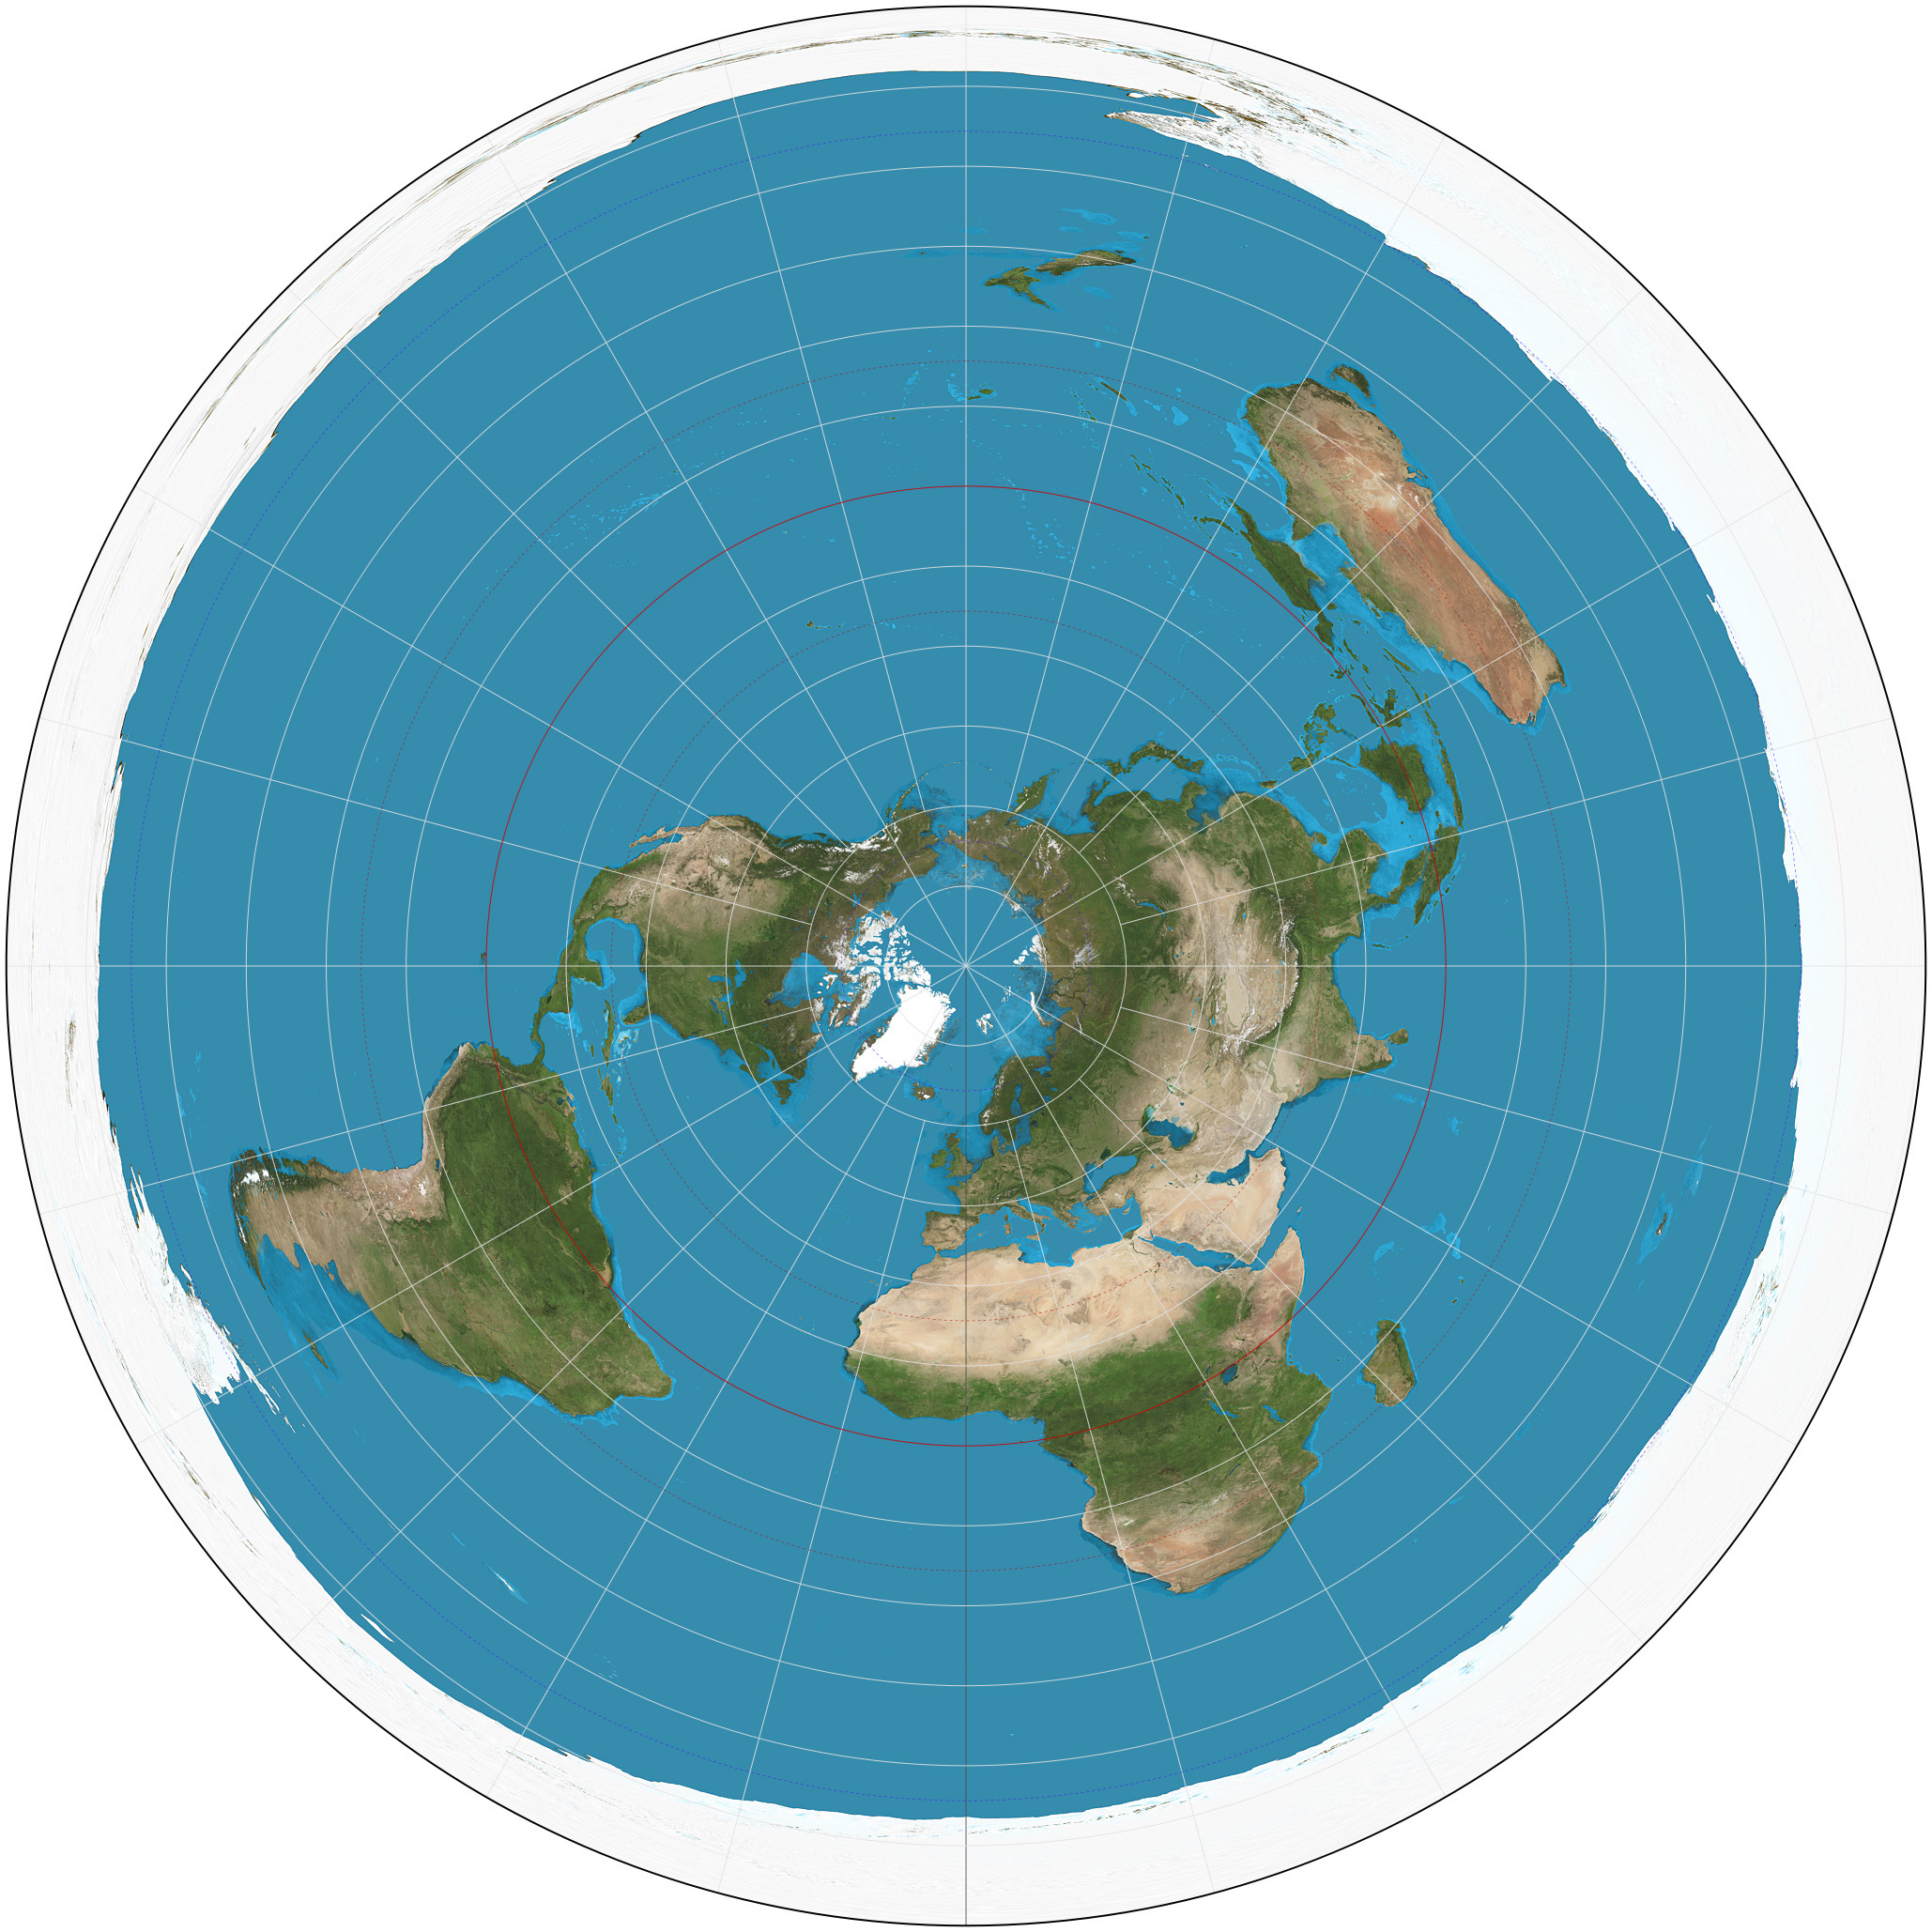
Azimuthal Equidistant Projection
Azimuthal Equidistant Projection
Preserves distance/direction from one central point (e.g., poles).
Azimuthal Equidistant Projection
UN logo centers on the North Pole, showing true distances from it.
Azimuthal Equidistant Projection
Air-route maps use this to display flight paths from a hub city.
Formal Region
An area with uniform characteristics (e.g., government boundaries, climate).
Formal Region
The Sahara Desert, defined by its arid climate and consistent vegetation.
Formal Region
Canada, a political region with shared laws and borders.
Functional Region
A space organized around a central node (e.g., transportation, economic ties).
Functional Region
The NYC subway system, linking suburbs to Manhattan’s core.
Functional Region
Amazon’s delivery network, radiating from fulfillment centers.
Vernacular Region
A perceptual region based on cultural identity (no formal boundaries).
Vernacular Region
"The American South," associated with accents, cuisine, and history.
Vernacular Region
"Tuscany," perceived as Italy’s artistic/heartland despite no official borders.
Hearth
The origin point of a cultural trait (e.g., religion, agriculture).
Hearth
Mesopotamia (Fertile Crescent) as the hearth of early agriculture (wheat/barley).
Hearth
The Indus River Valley as the hearth of Hinduism.
Distance-Decay Function
The idea that interaction decreases as distance increases.
Distance-Decay Function
Fewer Mexican immigrants settle in Maine than Texas due to proximity.
Distance-Decay Function
Radio signals weaken farther from broadcast towers.
Space-Time Compression
Technology reduces perceived distance (e.g., flights, internet).
Space-Time Compression
Zoom calls enable real-time global meetings, collapsing time/distance.
Space-Time Compression
High-speed trains shrink travel time between Paris and Brussels.
Choropleth Map
Uses color shading to represent data (e.g., election results by state).
Choropleth Map
COVID-19 case rates visualized by red (high) to green (low) intensity.
Choropleth Map
U.S. poverty rates by county, with darker shades indicating higher poverty.
Dot Distribution Map
Each dot represents a quantity (e.g., population, disease cases).
Dot Distribution Map
U.S. Census dot map shows population clusters in coastal cities.
Dot Distribution Map
African elephant populations mapped as dots to track poaching hotspots.
Proportional Symbol Map
Symbols (e.g., circles) scale to data values (e.g., city populations).
Proportional Symbol Map
Larger circles represent higher earthquake magnitudes on a global map.
Proportional Symbol Map
Apple Store locations with bigger symbols for higher-revenue stores.
Isoline Map
Lines connect points of equal value (e.g., elevation, temperature).
Isoline Map
Topographic maps use contour lines to show elevation changes.
Isoline Map
Weather maps with isobars linking areas of equal atmospheric pressure.
Cartogram
Distorts land area to represent data (e.g., population, GDP).
Cartogram
World map resizes countries by population; India/China appear enlarged.
Cartogram
U.S. electoral college cartogram expands swing states’ visual weight.
Core Nations
Wealthy, industrialized countries dominating global trade (e.g., U.S., Germany).
Core Nations
Japan’s technological exports (Toyota, Sony) fuel its high GDP per capita.
Core Nations
Switzerland’s banking sector exemplifies core economic influence.
Peripheral Nations
Less developed, economically dependent countries (e.g., Haiti, Sudan).
Peripheral Nations
Bangladesh’s garment industry relies on core-nation outsourcing for low wages.
Peripheral Nations
DR Congo’s mineral wealth is extracted by foreign (core) corporations.
Relocation Diffusion
Spread of ideas through physical movement of people.
Relocation Diffusion
Christianity reaching the Americas via European colonists.
Relocation Diffusion
Silk Road traders spreading Buddhism from India to China.
Expansion Diffusion
Ideas spread while staying strong at the hearth.
Expansion Diffusion
Hierarchical: Fashion trends from Paris → NYC → smaller cities.
Expansion Diffusion
Contagious: Viral TikTok dances spreading globally via the internet.
Stimulus Diffusion
An idea is adapted to fit local culture (not fully adopted).
Stimulus Diffusion
McDonald’s serving McFalafel in Egypt instead of beef burgers.
Stimulus Diffusion
Japanese anime inspiring U.S. cartoons but with altered art styles. (e.g. Avater the Last Airbrnder)
Mercator Map Projection
Gall-Peters Map Projection
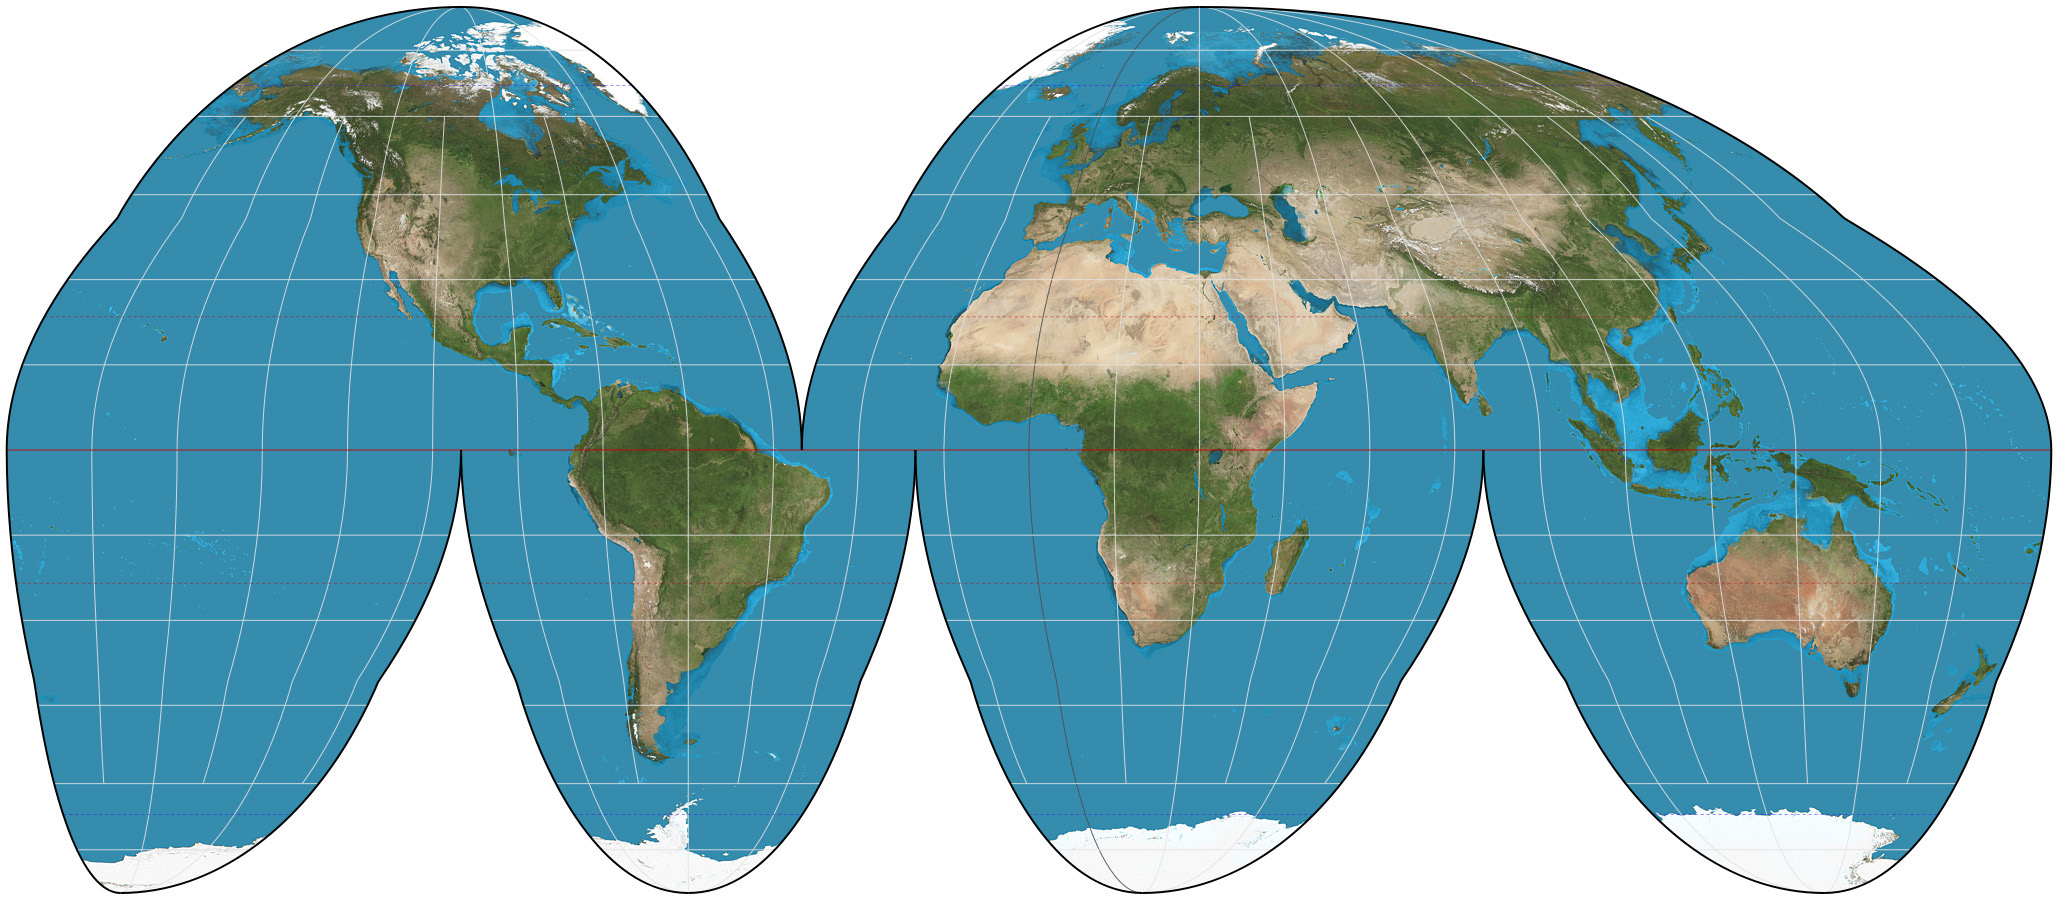
Goode-Homolsine Map Projection
Winkle Tripel Map Projection

Robinson Map Projection
Azimuthal Equidistant Map Projection