Inferential Stats
1/25
There's no tags or description
Looks like no tags are added yet.
Name | Mastery | Learn | Test | Matching | Spaced | Call with Kai |
|---|
No analytics yet
Send a link to your students to track their progress
26 Terms
Hypothesis testing
This will conclude or inference about the known parameter.
Hypothesis testing mechanism
we assume Ho (Null Hypothesis) & we dont assume the H1 (opposite of null Hypothesis)
after we perform the experiment what we will do
we accept or reject null hypothesis
P value
it like find the null hypothesis are true. This experiment is performed for verification.
if we have lower p value then it represent
it has null hypothesis
what does a p-value of 0.05 really mean?
5% probability that the observed results occurred by chance, assuming the null hypothesis is true. In other words, if the p-value is 0.05 or lower, it suggests that the results are statistically significant, and there is strong evidence against the null hypothesis.
This threshold is commonly used to determine whether to reject the null hypothesis in hypothesis testing.
Z test
if we know the population & sample size is know we can find z test.
z-test is used for hypothesis testing when you want to determine if there is a significant difference between sample and population means
T Test
if we dont know population or if we know population but we dont know sample size
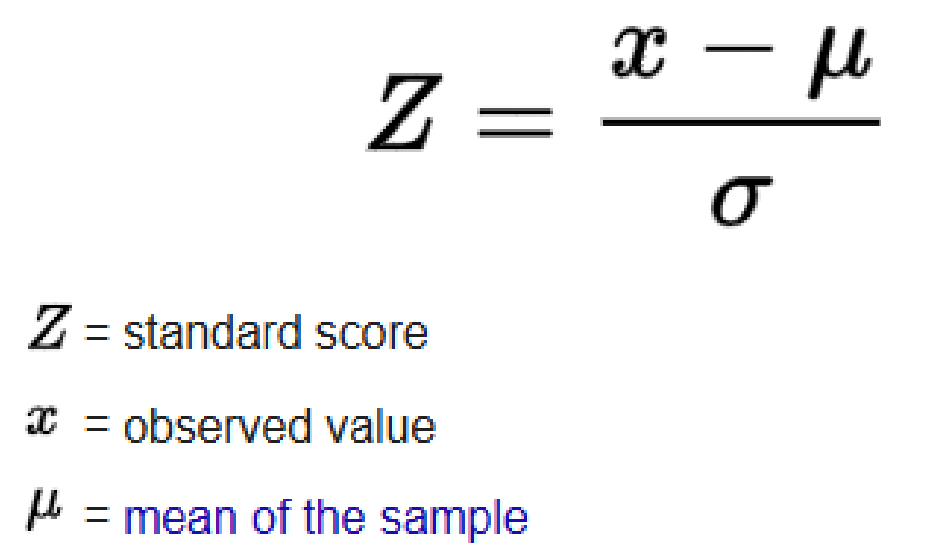
Z score
A z-score measures how many standard deviations a data point is from the mean. It is used in standardizing data and conducting hypothesis tests. It is a way to compare the results from a test to a “normal” population.
Chi Square
used for categorical values. used for significance between 2 categorical variables.
a significant association between two categorical variables.
Anova (analysis of variance)
This will compare mean of 3 or more group to see the different between them.
why do we use anova
to test a particular hypothesis between groups
the relationship between an independent variable and one quantitative dependent variable
Anova assumption
Independence: Observations must be independent of each other.
Normality: Data within each group should be approximately normally distributed. (bell-shaped curve).
Homogeneity of Variances: Variances among the groups should be approximately equal.
Additivity: The effects of different factors should be additive.
what happen if anova assumptions is failed
Then annova will not work
Chi Squre vs Anova in terms of data tyoe
Categorical & Categorical (Independant Variable) + Categorical (dependant variable)
Chi square vs Anova
testing between categorical values &
testing btween group mean
chi square vs Anova (Analysis of variance) output :
p value , Chi square
P value & group mean
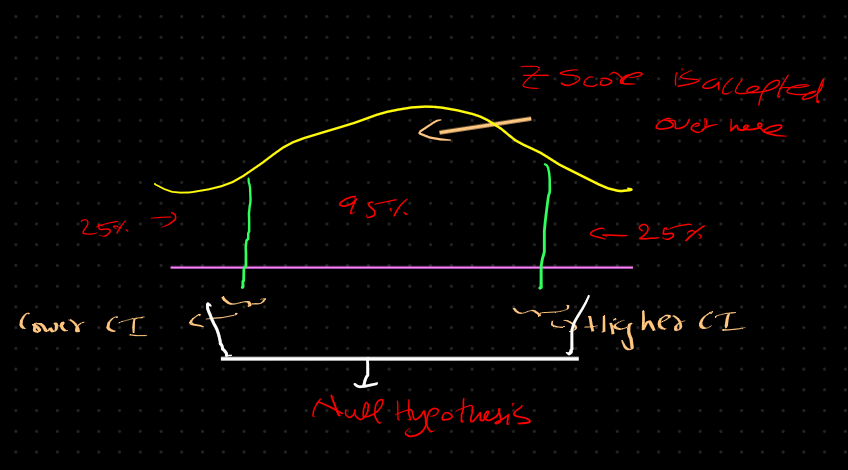
Confidance interval
The confidence interval is generally preferred, as it tells us how likely this interval is to contain the population parameter. This likeliness or probability is called Confidence Level or Confidence coefficient and represented by 1 — alpha, where alpha is the level of significance.
Confidance interval formulae
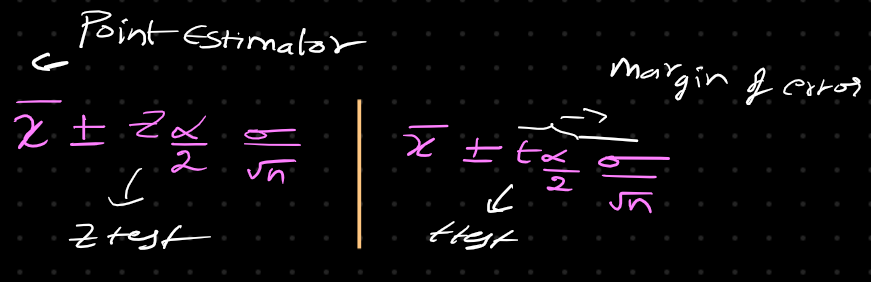
How Does the Width of the Confidence Interval Change With Length?
The width of the confidence interval increases with the confidence level. A higher confidence level, such as 95%, results in a wider interval, indicating more certainty but less precision.
R square
it is a measure of how well the model explains the variance in the dependent variable, with a higher value indicating a better fit.
statistical interaction
An interaction occurs when the effect of one factor (input variable) on the dependent variable (output variable) varies depending on the level of another factor. Essentially, the impact of one factor is not consistent across the different levels of another factor.
concept of statistical power
Statistical power is the probability of correctly rejecting a false null hypothesis. Higher power reduces the likelihood of Type II errors.
Difference Between a Validation Set and a Test Set?
A validation set is used during model training for parameter tuning and to prevent overfitting, making it a part of the training process.
In contrast, a test set is used after training to evaluate the model's performance on unseen data, assessing its predictive power and generalization capability.
Acid
ACID is atomicity, consistency, isolation, and durability.
• Atomicity refers that if any aspect of a transaction fails, the whole transaction fails and the database state remains unchanged.
• Consistency means that the data meets all validity guidelines.
• Concurrency management is the primary objective of isolation.
• Durability ensures that once a transaction is committed, it will occur regardless of what happens in between such as a power outage, fire, or some other kind of disturbance.
KPI
KPI is an acronym for a key performance indicator. It can be defined as a quantifiable measure to understand whether the goal is being achieved or not.
KPI is a reliable metric to measure the performance level of an organization or individual with respect to the objectives. An example of KPI in an organization is the expense ratio.