Llandudno fieldwork
1/19
There's no tags or description
Looks like no tags are added yet.
Name | Mastery | Learn | Test | Matching | Spaced | Call with Kai | Chat |
|---|
No analytics yet
Send a link to your students to track their progress
20 Terms
What was the aim for our human fieldwork investigation?
To investigate the differences in quality of life between Lladudno’s town centre & its suburbs
What was our hypothesis?
The quality of life will be better in the suburban areas than in the town centre
This is because we thought that the suburbs would have better air quality, less traffic, less noise pollution, lower crime rates & bigger houses with more green spaces
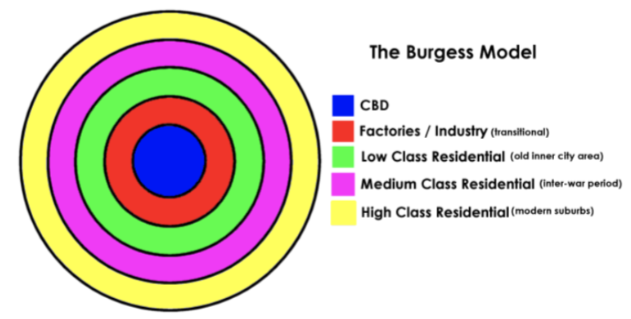
What geographical theory supports our hypothesis?
The Burgess model
Llandudno was a suitable location to sample because…
- Both the town centre & the suburbs were accessible on foot
- Llandudno is quite a small town which reduced the risk of getting lost or left behind
- The distinctive housing types between the town centre (terraced houses) & the suburbs (semi-detached & detached houses) made it easier for us to determine where the quality of life was better
What were the potential risks of our investigation & how were they avoided?
Roads/traffic could cause accidents & injuries → be careful when crossing roads, try to cross at zebra crossings or at traffic lights, listen to teachers instructions about road safety
Exploring a new town could cause getting lost → stay in groups of 3 minimum, have a map in each group as well as a phone with the teachers numbers
What methods did we use to collect data?
Environmental quality assessment (EQA)
Questionaire
What sampling strategies did we use & why?
Stratified sampling — for both the EQA & the questionnaire because it ensured that we collected data from both the town centre & the suburbs
Opportunity — during the questionnaire, however this could have meant that our results were not entirely representative because we might have been more willing to ask some residents than others
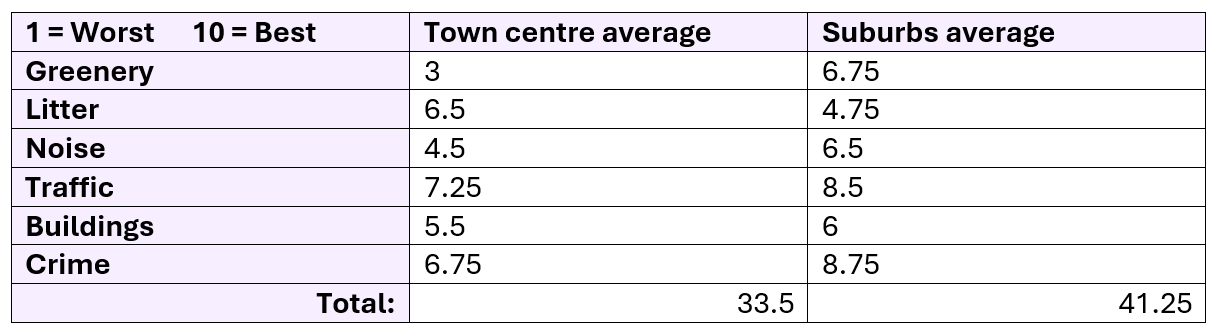
What were our results from the EQA?
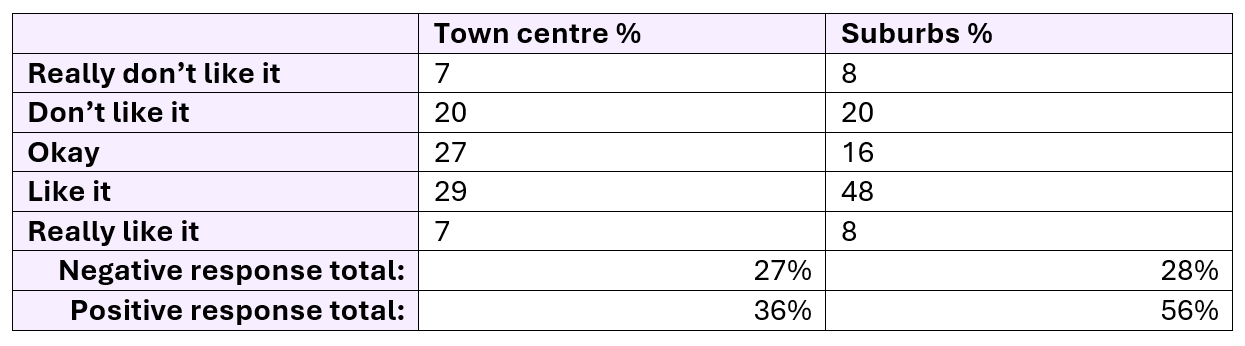
What were our results from the questionaire?
Our primary data collection WAS successful because…
- Each group asked 4-5 people in each area and these results were added together, allowing us to analyse a greater range of data. This also helped us to identify & eliminate any anomalies
- Our results align with our hypothesis and the Burgess model, suggesting that our data collection is accurate because it matches the geographical theory
- We used stratified sampling which ensured that we collected data from both the town centre & the suburbs, allowing us to do an equal comparison
Our primary data collection WAS NOT successful because…
- 70% of people who did the questionnaire in the suburbs were retired
- We carried out the questionnaire on a weekday, so there might not have been any interviewees from the working class
- In the town centre, the majority of people were tourists & so did not reflect the views of the residents
- Both the EQA & the questionaire were subjective as they were based on our opinions & who we chose to ask
- The sample size of the questionaire was small compared to Llandudno’s population
- The people who were willing to answer our questionaire might have been more positive
CONTEXT
Llandudno is a ____ with a population of ____. Originally it was a ____ however, when the ____ was built it became a tourist town. Lots of the people work in ____ & ____% are employed (in line with the UK average).
1 = Coastal town
2 = 20,000
3 = Fishing village
4 = Railway
5 = Hospitality & retail
6 = 84%
KEY WORDS
Quality of life
The standard of health, comfort & happiness experienced by an individual or group
KEY WORDS
Inner city
Residential area characterised by dense terrace housing built in the 19th century
Situated near formal industrial areas of a city/town
KEY WORDS
Suburb
Residential area characterised by detached or semi-detached housing with large gardens built from the 1930s & onwards
KEY WORDS
Accurate
Data that is close as possible to the true value
KEY WORDS
Reliable
When similar data is obtained every time that the investigation is repeated
KEY WORDS
Qualitative
Data that involves words or pictures
(e.g. someone’s answer to a questionnaire)
KEY WORDS
Quantitative
Data that involves numbers
(e.g. height or time)
KEY WORDS
Subjective
Something that is based on someones opinion