Forecasting Techniques and Methods in Decision Making
1/54
There's no tags or description
Looks like no tags are added yet.
Name | Mastery | Learn | Test | Matching | Spaced | Call with Kai |
|---|
No analytics yet
Send a link to your students to track their progress
55 Terms
Forecasting
A statistical task for making better decisions that involves predicting all given information available as accurately as possible, including historical data and knowledge of any future events that might impact the forecast.
Qualitative Forecasting
A forecasting method that relies on subjective judgment and non-quantifiable information.
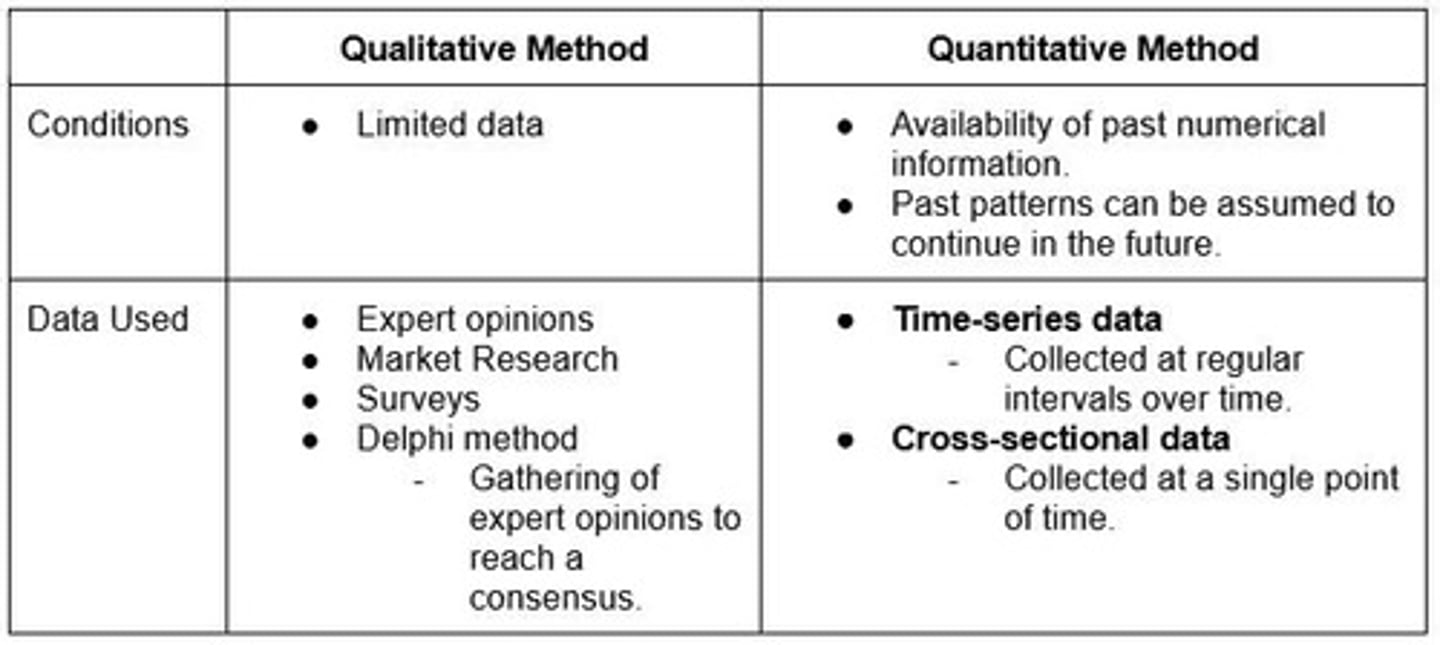
Quantitative Forecasting
A forecasting method that uses numerical data and statistical techniques to predict future outcomes.
Four Factors of Forecasting
Properties, Accuracy, Cost of Application, and the method that maximizes the utilization of available data.
Properties (in forecasting)
The forecaster should use a method that maximizes the utilization of available data.
Accuracy (in forecasting)
Different methods offer varying levels of accuracy in predictions.
Cost of Application (in forecasting)
Consider the resources (time, money, expertise, computing power) required to implement and maintain each forecasting method.
Time-series Analysis
A method that involves a list of numbers recorded over time, which can be analyzed to identify trends, seasonal patterns, cyclical patterns, and random fluctuations.
Trend
The long-run direction of a time series that includes any constant value in the data, which could be represented as a straight line or linear trend.
Seasonal
Forecasting factors based primarily on nature and human behavior, such as seasonal demands for certain goods like swimsuits or fur coats.
Cyclical
A pattern that occurs when data exhibits rises and falls not based on a fixed frequency, usually due to economic conditions or the business cycle.
Random
Fluctuations in data that cannot be attributed to trends, seasonal patterns, or cycles.
Exponential Smoothing
A forecasting technique that applies decreasing weights to past observations to predict future values.
Moving Averages
A forecasting method that calculates the average of a set of data points over a specific number of periods to smooth out fluctuations.
Financial Planning
The process of estimating future financial outcomes and making decisions based on forecasts.
Inventory Control
The management of inventory levels to ensure that the right amount of stock is available to meet customer demand.
Production Scheduling
The process of planning and organizing production activities to optimize efficiency and meet demand.
Manufacturing Processes
The methods and techniques used to produce goods in a manufacturing setting.
Investment Strategies
Plans developed to allocate resources in a way that maximizes returns based on forecasts.
Goals
Objectives that you intend to achieve, which should be linked to forecasts and plans.
Planning
The process of outlining steps to achieve goals after making forecasts.
Unpredictable Events
Events or effects that cannot be predicted with certainty as they do not exhibit any pattern.
Exponential Smoothing Formula
Forecast = a (Last Value) + (1 - a) (Last Forecast)
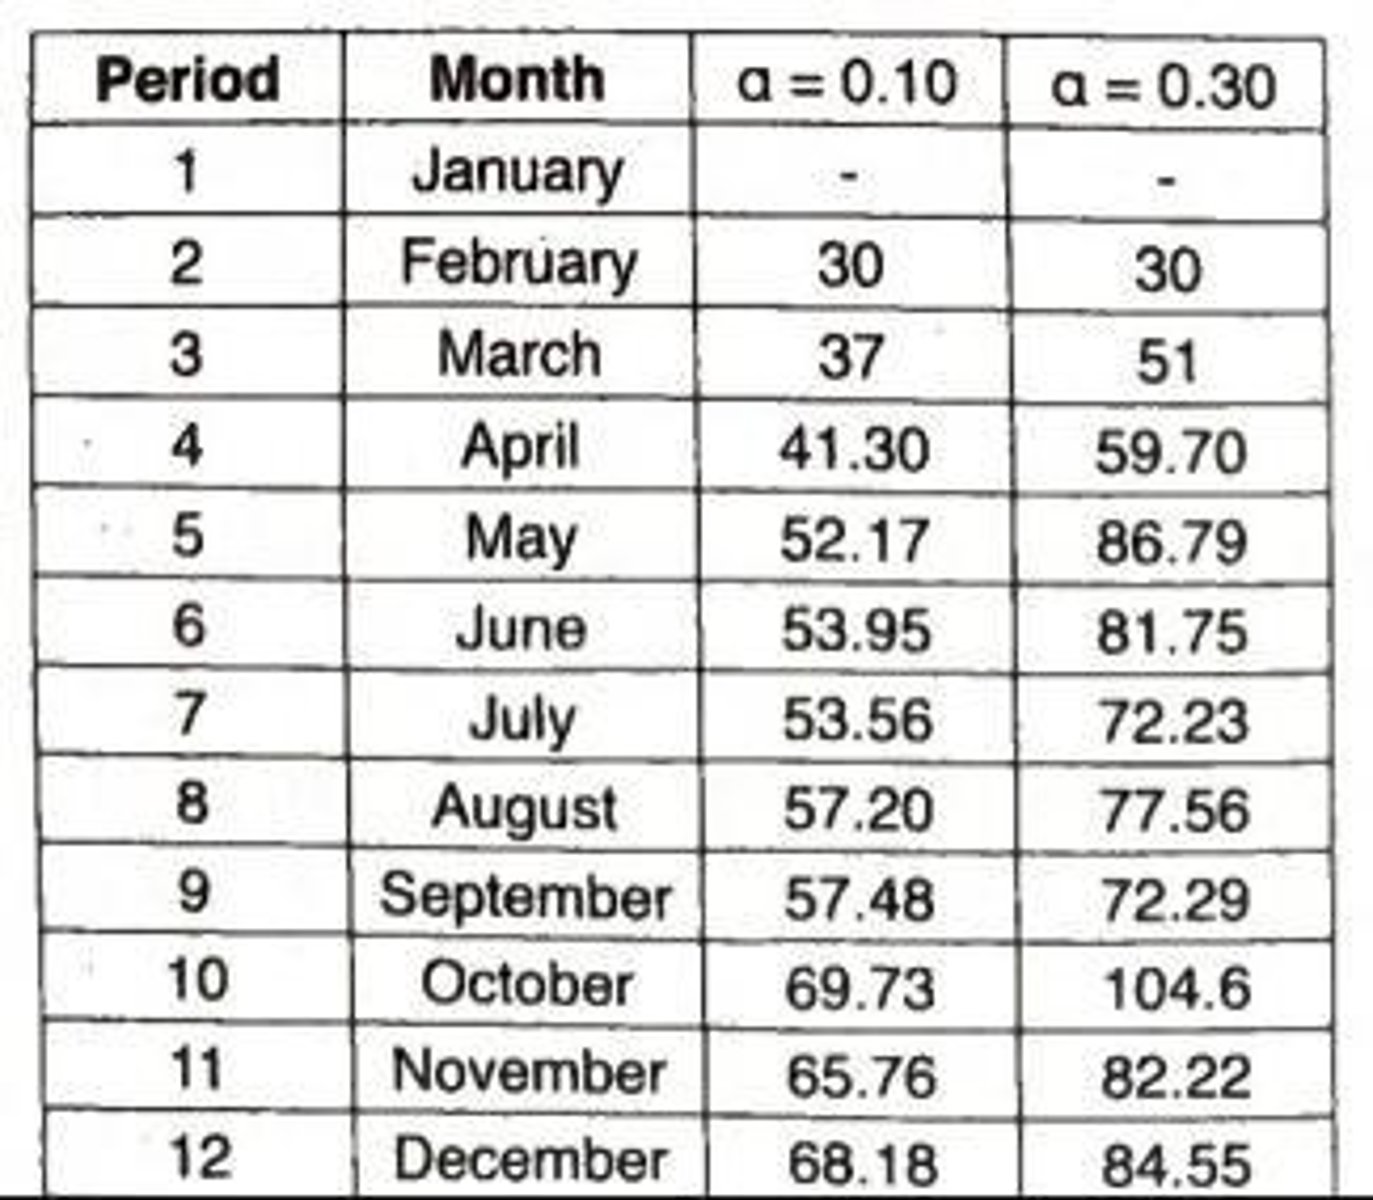
Forecasting Demand Example
Mary Insurance Agency forecasts demand for life insurance with a face value of ₱2,000,000 based on 11 months of sales records.
Simple Exponential Smoothing Forecast
A forecast method for insurance demand using α = 0.10 and α = 0.30.
Forecast Error
Defined as Actual Value - Forecast.
Mean Absolute Deviation (MAD)
A method for measuring forecast errors.
Bias
A method for measuring forecast errors.
Best Forecast Methods
Expected to have the least error measurements.
Linear Trend Model
Expressed as Forecast Trend Component (T) x Seasonal Component (S).
Trend Component
Part of the linear trend model focusing on the trend in the data.
Seasonal Component
Part of the linear trend model focusing on the seasonal variations in the data.
Historical Data Analysis
An attempt to break down original data into its trend and seasonal components.
Forecasting Accuracy
Measured by using bias and MAD values.
Single Prediction
Made one time period ahead using smoothing models.
Table 17.2
Summary table for the simple exponential smoothing forecast for insurance demand.
Figure 17.2
Visual representation of the simple exponential smoothing forecast for insurance demand.
Commonly Used Models
Moving averages and exponential smoothing in time-series analysis.
Forecasting Learning Outcomes
Identify accuracy of forecasting methods and explain linear trends.
Sales Records
Data accumulated for the past 11 months by Mary Insurance Agency.
Forecast Reliability
Measures the closeness of forecast in reflecting reality.
MAD (Mean Absolute Deviation)
A method of testing the reliability of a forecast.
Y-axis Intercept
The value of the Y where the trend line touches the Y-axis, where X is equal to zero.
Slope of the Line
The amount of change in Y for one period change in X.
Least Squares Regression
A method that determines a regression equation by minimizing the sum of squares of the vertical distances between actual and predicted values.
Best-fitting Line
The line that minimizes the sum of squared residuals of the regression model.
Forecasting Equation
An equation used to forecast the trend into the future.
Average of X
The mean value of the X data points in a dataset.
Average of Y
The mean value of the Y data points in a dataset.
Value of N
The number of data points in the dataset.
Slope (B)
The computed value indicating the average increase in sales per hour.
Intercept (A)
The computed value that represents the starting point of the trend line.
Forecast Values
Values obtained by substituting X into the forecasting equation.
Linear Trend
A method useful in estimating future trends using an estimated regression equation.
Forecast Accuracy
The reliability of a forecast as measured by MAD and bias.